AT40 = 68.0% of stocks are trading above their respective 40-day moving averages (DMAs)
AT200 = 55.1% of stocks are trading above their respective 200DMAs (essentially matches the 2019 high and is a new 10-month high)
VIX = 13.3
Short-term Trading Call: neutral (caveats below)
Stock Market Commentary
Good news is bad news….oops, nevermind
The search for bad news exchangeable for rate cuts from the Federal Reserve took an interesting twist with the June jobs report on Friday. At the U.S. market open, it seemed the stock market lamented the good news of job creation stronger than “expected” (even President Trump was surprised by the strength). By the close, the market seemed to change its collective mind and reassured itself that slow wage growth was bad news enough to maintain relatively high expectations for easier money from the Federal Reserve. (Yes, I am poking fun at the mercurial market and the conventional financial media that churns out headlines to follow every market squiggle).
Market Projections for Rate Cuts
Two key probabilities changed in the wake of the June jobs report. According to CME FedWatch, the odds for at least a 50 basis rate cut (2 rate cuts in 1!) at the July meeting dropped from 29.2% to a mere 5.4%. Since the market was already projecting two rate cuts were unlikely, this shift downward just solidifies the Fed’s buffer against disappointing the market with “only” one rate cut. I am surprised by any talk of disappointment about the reduced prospects for 50 basis points in July when Federal Reserve board member James Bullard already dismissed the need for such a big rate cut. The odds for a single rate cut of 25 basis points are still near certainty at 95.1%; the Fed essentially has no choice but to obey.
More importantly, the odds of three rate cuts (or 75 basis points) in 2019 changed. Ahead of the jobs report, Fed Fund futures projected 75 basis points of cuts by December of this year. The futures market pushed that timetable out to January. The table below puts the most likely rate level (horizontal axis) at the given meeting date (vertical axis) in blue. The probability for that (maximum) rate level is the SUM of all the probabilities in the blue cell and all the cells to the left of that blue cell. The current rate range is 2.25% to 2.50% (or 225 to 250 basis points).
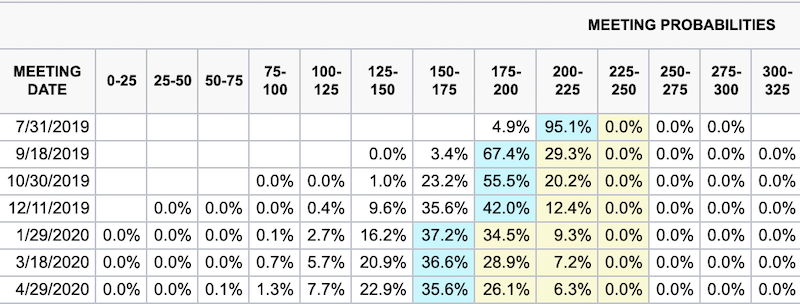
Source: CME FedWatchTool
Ahead of the jobs report, the odds were 57.9% for 75 basis points in cuts by December. Those odds are now 45.6% (35.6% + 9.6% + 0.4%). These numbers still represent a close call for 75 basis points in 2019.
These high odds for rate cuts this year still do not mollify President Trump. During his answer to a reporter about the jobs report, Trump blasted the Federal Reserve yet again, this time lamenting “we don’t have a Fed that knows what it’s doing.”
While Trump stewed about rate cuts, the change in the projection profile roiled currency markets.
Revenge of the U.S. Dollar
The U.S. dollar index (DYX) jumped higher for the second time time in a week. Friday’s strength surprised me since the change in odds for rate cuts is relatively small. The correlations are important lessons for trading going forward: the forex market is quite sensitive to changes in the prospects for rate cuts in the U.S.!
Suddenly, the U.S. dollar is back in a position of strength with the confirmation of support at its 200-day moving average (DMA). However, the index still has more to prove after fading from 50DMA resistance and the lower low that marks the prior 200DMA breakdown. If the U.S. dollar breaks down below its 200DMA in the coming weeks, I will get very aggressive with shorts against the currency. As I explained earlier, the 200DMA is a critical pivot for trading the U.S. dollar index.
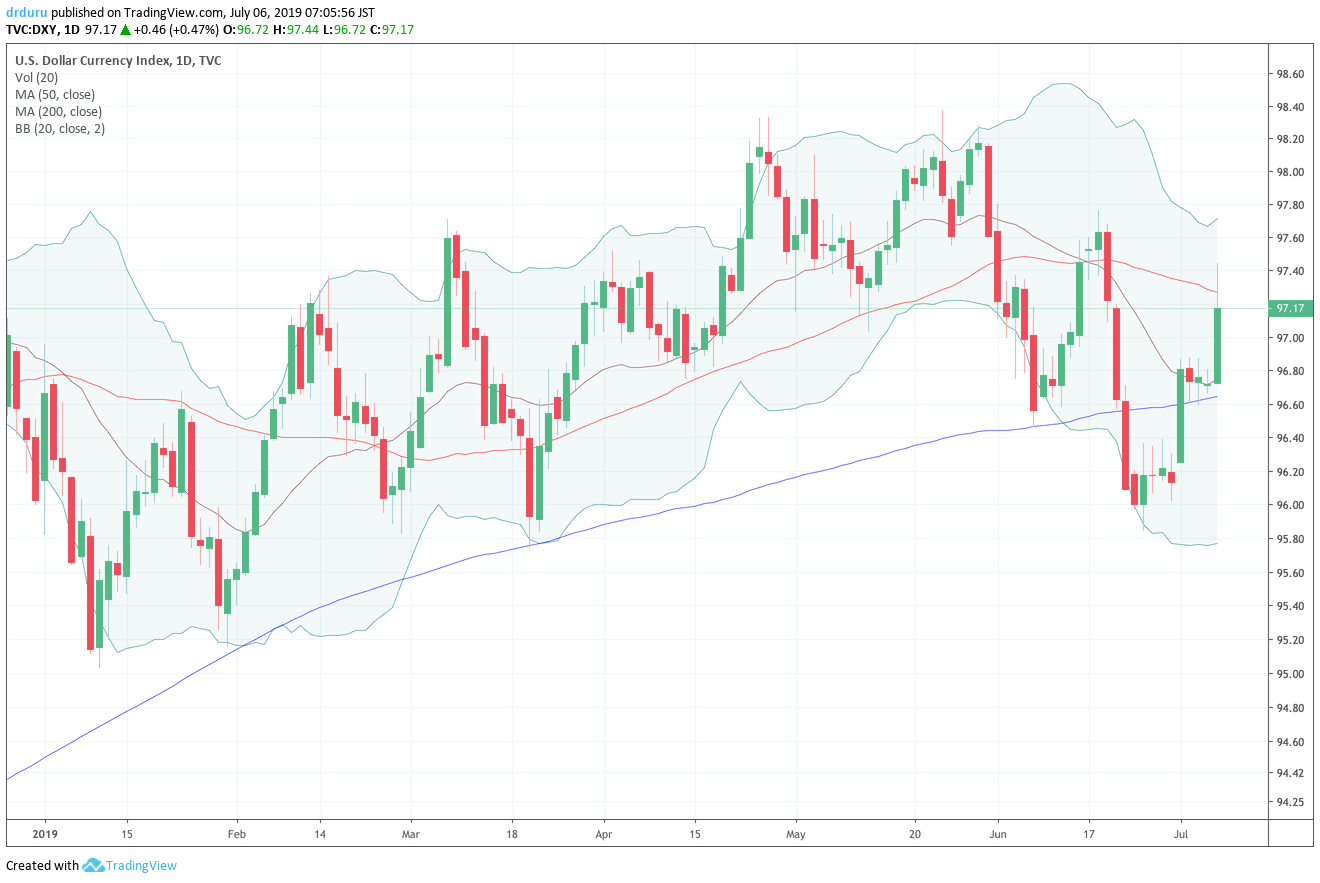
Source: TradingView.com
Small Caps Shine Again
Overall, the stock market performed well considering the revenge of the U.S. dollar.
The S&P 500 (SPY) finished with a loss of 0.2%. The NASDAQ (COMPQX) only lost 0.1%. The closes were anti-climactic compared to the initial headlines at market open declaring a retreat on Wall Street from good news. Both major indices closed nearly even with their respective all-time highs set the previous day.
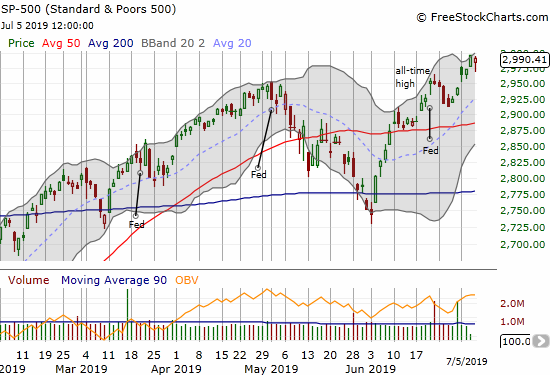
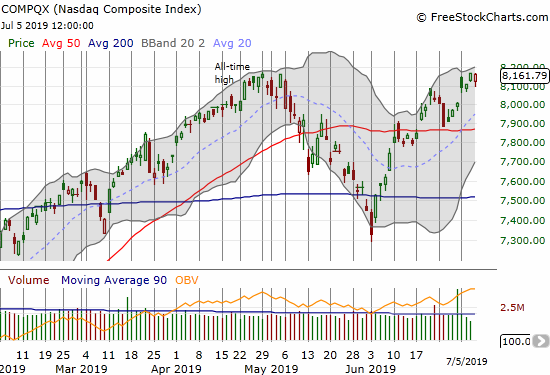
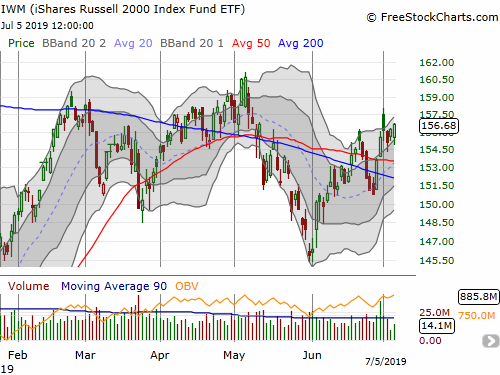
The iShares Russell 2000 ETF (IWM) was again the most interesting story to end a week. IWM was a clear sign of weakness with its earlier 50 and 200DMA breakdowns. IWM started last week with a fresh 50DMA breakout that buyers confirmed the next day albeit in the middle of an intraday fade. With IWM in a bullish position, I immediately bought the small dip in IWM with call options expiring in 2 weeks.
Looming Overbought Trading Conditions
AT40 (T2108), the percentage of stocks trading above their respective 40DMAs, crept ever closer to the 70% threshold for overbought with a close of 68.0%. My favorite technical indicator is on a bullish run with gains in 5 of the last 6 trading days. The last overbought period ended on March 6th with the S&P 500 closing at 2,771.45. The index is up 7.9% since then. This kind of gain is very high for the AT40 70% underperiod no matter the duration (currently 86 trading days); this performance is a sign of strength.
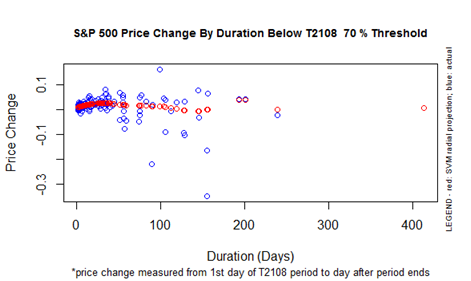
With overbought trading conditions looming as earnings season starts, I am on alert for changing my trading bias. Earnings could trigger an extended overbought rally or earnings could set up a bearish rejection from overbought territory. Of course with the context of a market euphoria over imminent rate cuts, I expect bearish signals will remain short-lived.
Volatility stalemate
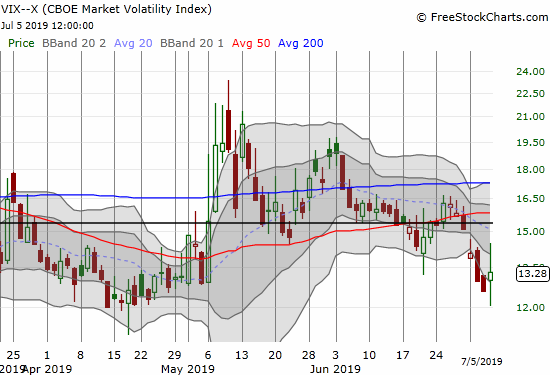
The volatility index (VIX) swung widely on the day but managed to end with a small gain. The intraday low matched support at the April lows, so it looks like the VIX may have found another bottom. The tension between the increased volatility that should come with earnings season and the looming overbought trading conditions will create summer trading fireworks…even if brief.
Stock Chart Reviews – Bearish
Broadcom (AVGO)
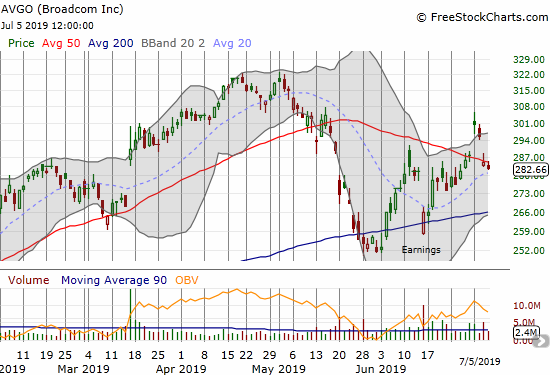
Broadcom (AVGO) gapped higher in celebration of the truce in trade tensions between the U.S. and China. While lamenting my put spread position, I failed to see the fresh opportunity to bet against the stock. I am not surprised AVGO quickly closed that gap up. On Friday, AVGO marginally confirmed a fresh 50DMA breakdown. I will be looking to take a fresh position.
The iShares Dow Jones Home Construction ETF (ITB)
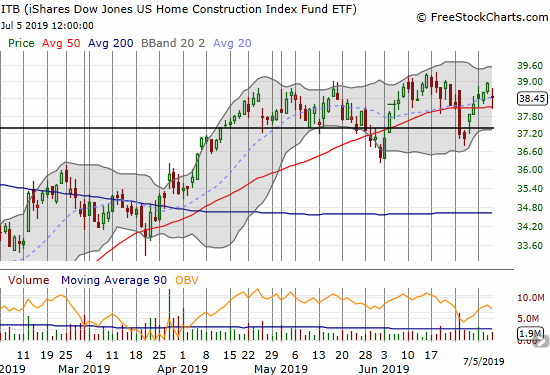
The iShares Dow Jones Home Construction ETF (ITB) demonstrated its sensitivity to interest rates by under-performing the stock market to the tune of a 1.3% loss on Friday. ITB was down as much as 2.4% when it touched 50DMA support. This weakness also confirmed for me that ITB has likely topped out as part of its typical seasonal pattern; this topping explains why I keep ITB in the bearish column. The rate cut outlook will not improve materially from here and the economic weakness that motivates rate cuts puts a ceiling on the economic growth that ITB needs to catalyze a further rally.
With this assessment I decided to make my first trade for the 2019/2020 period of seasonal strength. I bought an August/January $39 calendar call as a bet that $39 will hold as the top of the range until at least October and November when the odds for a breakout should be much higher. The calendar call spread is a way of using the current bearish topping pattern to pay for what I assume will be the eventual breakout months away. If the breakout happens before August expiration of the short calls, I will wait until expiration to decide on the next move.
XPO Logistics (XPO)
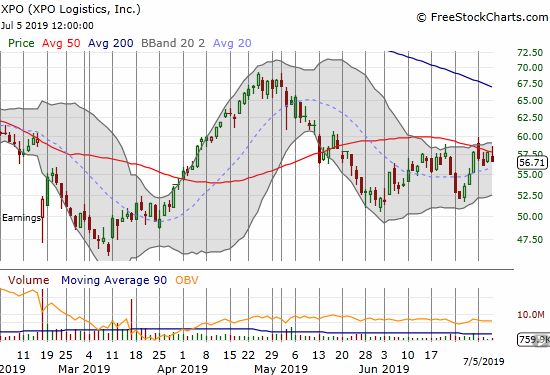
I am still holding onto call options in XPO Logisitics (XPO) in anticipation of a 50DMA breakout. Until that breakout occurs, XPO is technically in a bearish position with three failures in three weeks to break through resistance. My original bullish thesis on XPO keeps me from playing the bearish technicals.
Stock Chart Reviews – Bullish
Acuity Brands (AYI)
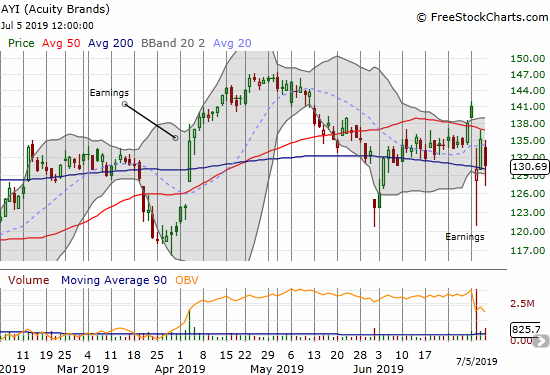
Acuity Brands (AYI) gets little attention, but I always think of its earnings report as a good launching pad for earnings season. The headline news on earnings tanked the stock as much as 14.4%, including a 200DMA breakdown. From the earnings report (emphasis mine):
“We remain cautiously optimistic about overall market conditions for the remainder of calendar year 2019 and do not believe that the demand outlook has meaningfully changed from our outlook provided last quarter. Third-party forecasts and several leading indicators continue to suggest that the North American lighting market, our primary market, should grow in the low-single digit range in calendar 2019, although some leading indicators of future market demand, such as the Architectural Billings Index and the Dodge Momentum Index, have recently softened. Our wide and varied base of customers generally remains positive about calendar year 2019 growth prospects as many customers continue to have healthy backlogs, though they continue to be concerned about the timing of releases and the potential impact that tariffs and higher prices may have on overall demand…
We believe our fiscal fourth quarter net sales could be down modestly compared with prior year’s net sales, which benefitted from the significant initial stocking of product in the stores of a new customer in the retail sales channel. Also, fourth quarter net sales may be negatively impacted by our efforts to enhance our margin profile as we expect to continue our program of reviewing portions of our product portfolio and services offerings with the objective of eliminating those items and activities that do not meet our return objectives. Lastly, we believe our fourth quarter adjusted operating profit margin will exceed prior-year’s fourth quarter margin as well as improve on a sequential basis from the third quarter.”
It was a strange mix of news. At the same time AYI reported no significant impact on its previous guidance, the company went ahead and cautioned about potential softness. During the earnings call Q&A, Chairman, President, and CEO Vern Nagel was more clear about the implications of the company’s results. From the Seeking Alpha transcript (emphasis mine):
“…our stock being done [sic] 11% today is ridiculous. I mean the value of the business and the things that we’re doing were enhancing the value of that. It’s all good things. We are really generating a lot of cash. We are doing great things within the key markets that we serve. We are looking to prune some of the things within our business that don’t really provide the kinds of returns that we expect.”
Nagel’s indignation clearly worked well enough for a good bounce. I also would have bought into that statement. I am a buyer here assuming the post-earnings intraday low was a successful test of the May low. The easy stop is a close below the March low.
Canada Goose Holdings (GOOS)
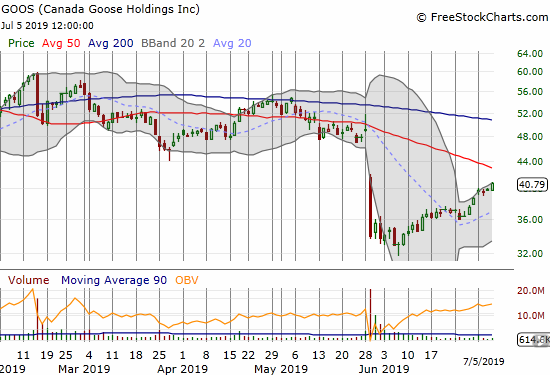
Canada Goose Holdings (GOOS) triggered my entry rule soon after I wrote about it. Friday’s gain hit my profit target on the call options. I am keeping GOOS in the bullish column for the potential it still has to tag overhead 50DMA resistance. At THAT point, it could of course easily turn bearish again.
Best Buy (BBY)
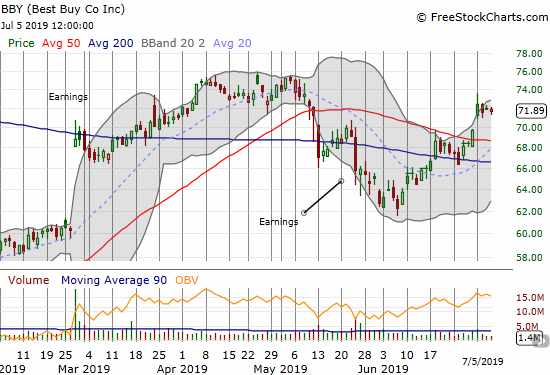
Best Buy (BBY) continues to amaze me. The stock worked through bearish conditions and last week confirmed a 50DMA breakout. While this move is bullish, I am not going to buy given the test looming from the 2019 highs. The stock is presumably a buy on a retest of 50DMA support.
Cronos Group (CRON)
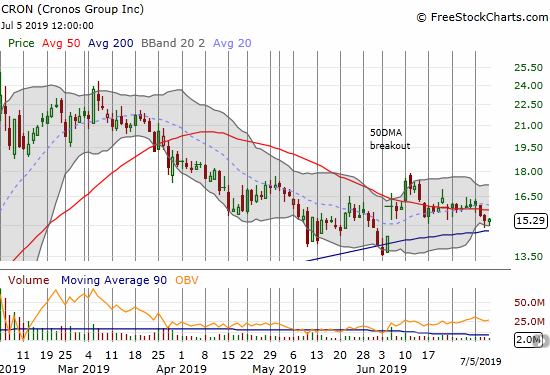
My call options in Cronos Group (CRON) are withering away as the stock churns away. CRON remains in a bullish position relative to its uptrending 200DMA. If my call options die in vain at July’s expiration, I may consider sitting on shares.
Alphabet (GOOG)
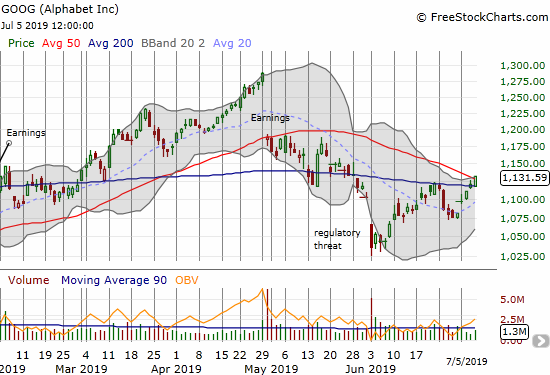
Alphabet (GOOG) is lagging the S&P 500 relative to all-time highs, but it is now making a bid to return to bullish form with a confirmed 200DMA breakout and a nudge above 50DMA resistance.
Walgreens Boots Alliance (WBA)
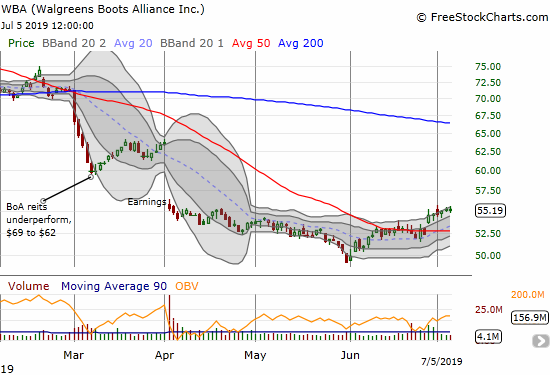
My bearish case on the pharmacy stocks is officially on hold in deference to a short-term bullish trading opportunity. In my last Above the 40 post, I gave a technical and valuation-based reason for making a contrarian bet. WBA barely drifted higher last week, but it was enough to confirm a bottoming pattern. Now CNBC’s Options Action is on-board with a bullish options trade expiring in 3 months.
I like trading for a fill of the gap but not the risk reversal configuration. I do not want to own the stock if it falls below $52.50 (the current 50DMA). I would consider such a drop a likely invalidation of the breakout and a fresh validation of my bearish thesis. So I am looking to buy call options outright like the October $57.50.
Qualcomm (QCOM)
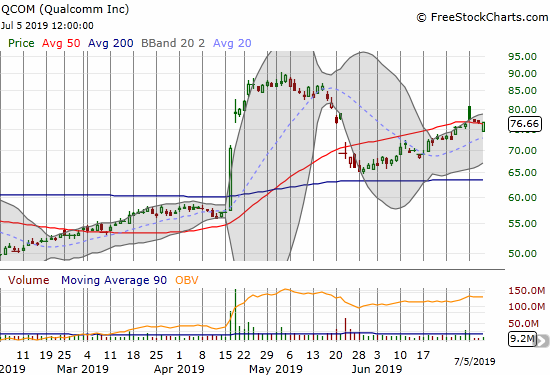
Qualcomm (QCOM) continues to deliver dramatic twists and turns. QCOM used the month of June to steadily recover from May’s sell-off. Like many semiconductor stocks, QCOM gapped up and faded after the trade war truce. The stock gapped below 50DMA support on Friday and looked ready to return to put 200DMA support into play. Buyers had other ideas. I like buying the dips in QCOM up to a test of 200DMA support.
U.S. Concrete (USCR)
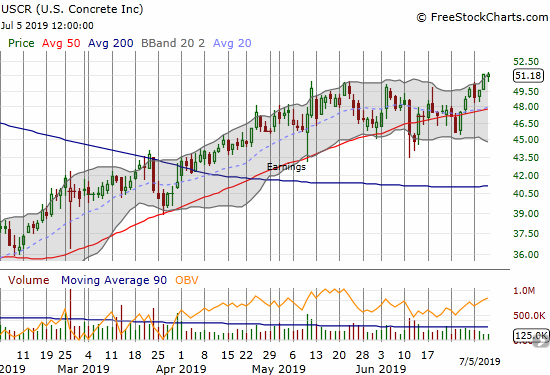
U.S. Concrete (USCR) broke out from a brief consolidation pattern. The stock is making progress measured in inches, but I will take it. My bullish interpretation of USCR earnings remains intact, and I remain a buyer on dips. (I am long overdue for another discussion with CEO Bill Sandbrook. Hopefully I can get another post-earnings interview later this year).
— – —
FOLLOW Dr. Duru’s commentary on financial markets via email, StockTwits, Twitter, and even Instagram!
“Above the 40” uses the percentage of stocks trading above their respective 40-day moving averages (DMAs) to assess the technical health of the stock market and to identify extremes in market sentiment that are likely to reverse. Abbreviated as AT40, Above the 40 is an alternative label for “T2108” which was created by Worden. Learn more about T2108 on my T2108 Resource Page. AT200, or T2107, measures the percentage of stocks trading above their respective 200DMAs.
Active AT40 (T2108) periods: Day #124 over 20%, Day #24 over 30%, Day #17 over 40%, Day #7 over 50%, Day #4 over 60% (underperiod), Day #86 under 70% (underperiod)
Daily AT40 (T2108)

Black line: AT40 (T2108) (% measured on the right)
Red line: Overbought threshold (70%); Blue line: Oversold threshold (20%)
Weekly AT40 (T2108)

*All charts created using FreeStockCharts unless otherwise stated
The T2108 charts above are my LATEST updates independent of the date of this given AT40 post. For my latest AT40 post click here.
Related links:
The AT40 (T2108) Resource Page
You can follow real-time T2108 commentary on twitter using the #T2108 or #AT40 hashtags. T2108-related trades and other trades are occasionally posted on twitter using the #120trade hashtag.
Be careful out there!
Full disclosure: long USCR, long and short U.S. dollar positions, long IWM calls, long XPO calls, long CRON calls, long ITB calendar call spread, long AVGO put spread, long UVXY calls, long GLD
*Charting notes: FreeStockCharts stock prices are not adjusted for dividends. TradingView.com charts for currencies use Tokyo time as the start of the forex trading day. FreeStockCharts currency charts are based on Eastern U.S. time to define the trading day.

