
AT40 = 45.6% of stocks are trading above their respective 40-day moving averages (DMAs)
AT200 = 48.5% of stocks are trading above their respective 200DMAs
VIX = 19.1
Short-term Trading Call: neutral
Stock Market Commentary
President Trump carried through on his threat to increase tariffs on China while at the same time tantalizing markets with fresh hope over some mysterious “alternative.”
Trump’s threat dropped while I was putting the finishing touches on my last Above the 40 post. The ensuing surge in volatility has lasted longer than I expected and resulted in much bigger volatility surges than I expected. I became so accustomed to seeing the market shrug off negative headlines and the growing weight of the China-U.S. trade war that I assumed this latest twist would not deliver much beyond the standard programming.
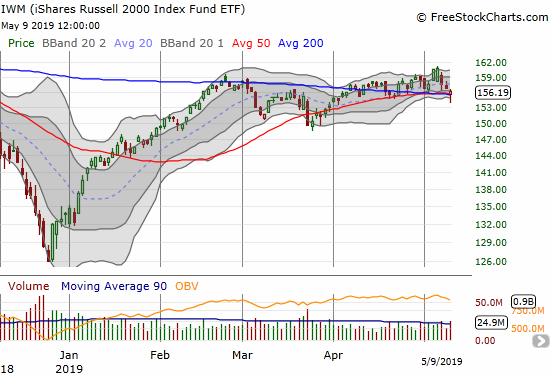
Instead, the S&P 500 (SPY) fell quickly into a test of support at its uptrending 50-day moving average (DMA) right alongside the same test for the NASDAQ (NDX). Even the iShares Russell 2000 ETF (IWM) fell through critical support levels only to rebound and close right on top of its 50DMA. The combination looked like a well-coordinated dance.
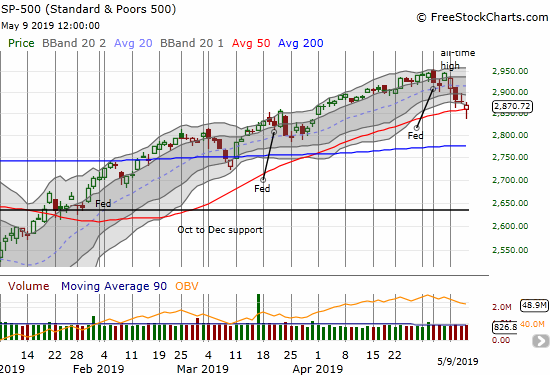
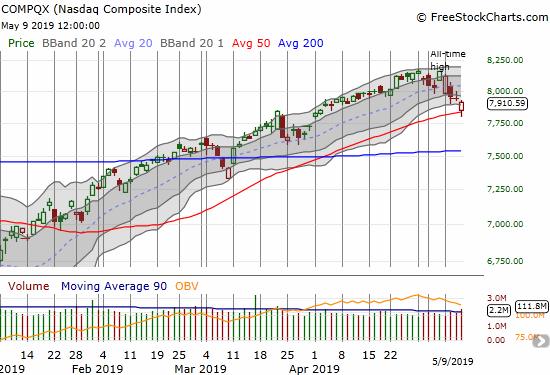
These simultaneous tests of the 50DMA look like a big setup. If you are bullish, it looks like a picture-perfect pullback to buyable support. If you are bearish, it looks like the perfect fakeout to make a subsequent 50DMA breakdown more lasting. I am staying neutral and looking for confirmation of one of these scenarios.
AT40 (T2108), the percentage of stocks trading above their respective 40DMAs, dropped as low as 38.1% and a 4-month low before rebounding to 45.6%. During a strong bull market, a steep drop for AT40 into the 30s is typically “good enough” to deliver a buy signal. That buy signal looks even better with AT200 (T2107), the percentage of stocks trading above their respective 200DMAs, only dropping to a 1-month low. Tentatively, I went back to the well that has been working in these situations: buy a fist full of IWM call options to sell into the next bounce.
The volatility index, the VIX, likely holds the key for the next move. After surging for three straight days – with strong fades from each intraday high – the volatility faders finally managed to push the VIX into a down day, albeit very slight. The VIX is demonstrating the beginning signs of seller’s exhaustion.
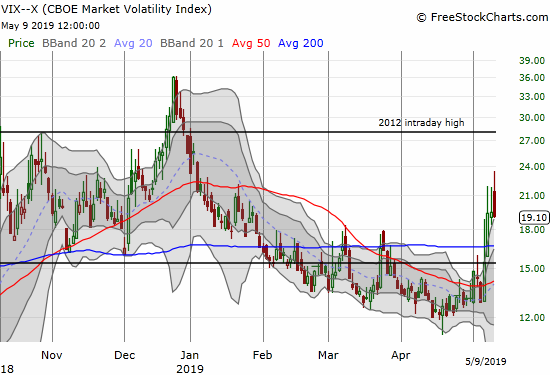
I wrote in the last Above the 40 post that I took a step back to assess my latest experiences trading volatility. Ironically, my call spread on the Ultra VIX Short-Term Futures ETF (UVXY) quickly went into the money, making me better off if I had an expiration date this Friday instead of next Friday. THIS week is the exact kind of week built for my previous strategy of keeping a rotation of UVXY call options; the call spread cut off what could have been outsized profits.
I decided to get right back to the new strategy of fading volatility with put options on UVXY. My first two tranches went to waste with expiration this Friday. My third tranche is now a kind of life saver for the profits on my UVXY call spread. I am planning to take profits on Friday as I expect volatility to strengthen ahead of a very uncertain weekend – outside some more tantalizing (and false) hope floated by the U.S. and/or China over the deepening trade war.
Bearish Divergence
The Australian dollar versus the Japanese yen (AUD/JPY) was key in reminding me that the bearish divergence was alive and well (for a refresher on the importance of AUD/JPY read “Why the Australian Dollar and Japanese Yen Matter for Stock Traders“). I expect weakness to continue into the price action from he flash crash that began the year. The continued weakness will either freshly confirm stock market weakness or build the foundation for the next bearish divergence.
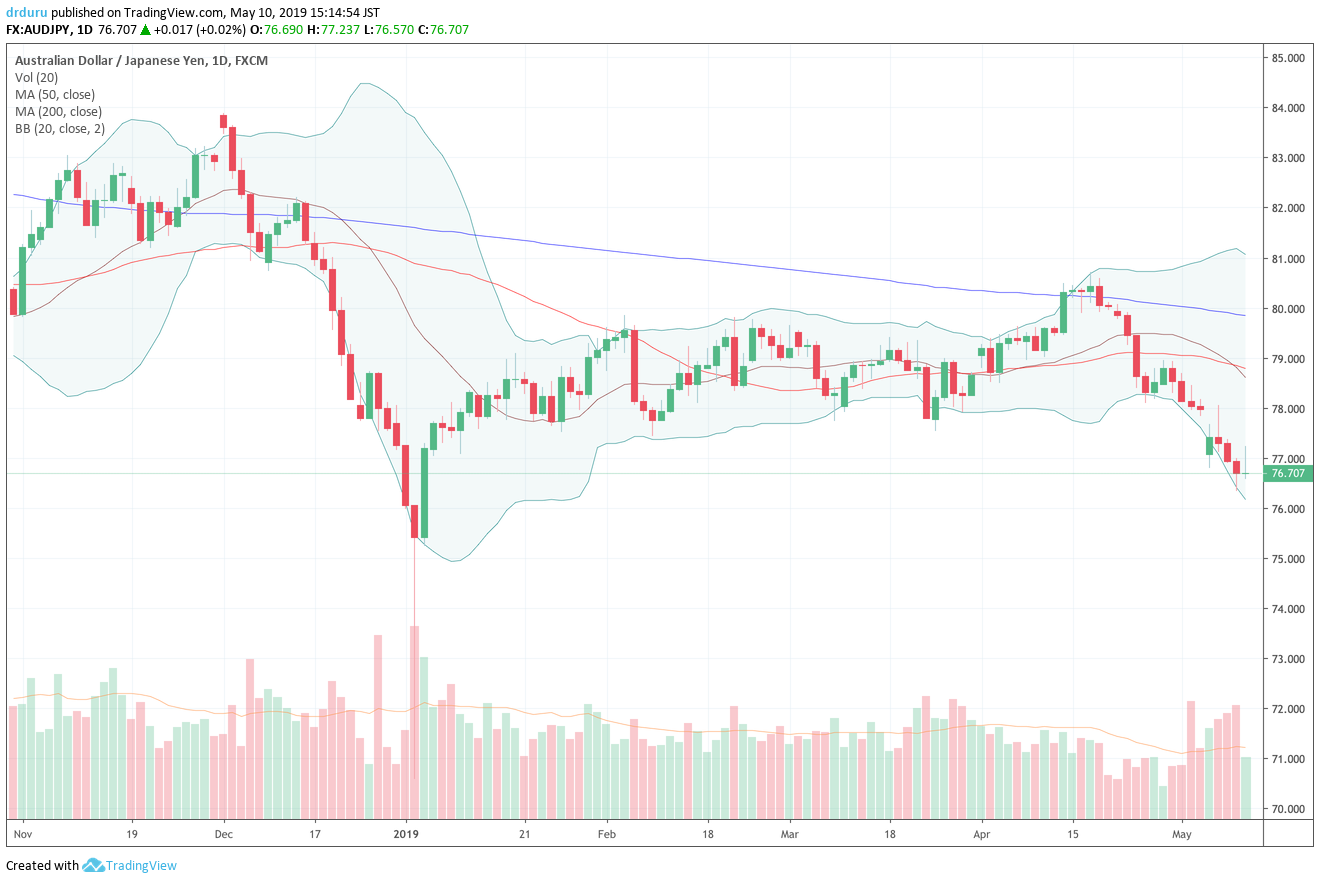
Source: TradingView
Stock Chart Reviews – Bearish
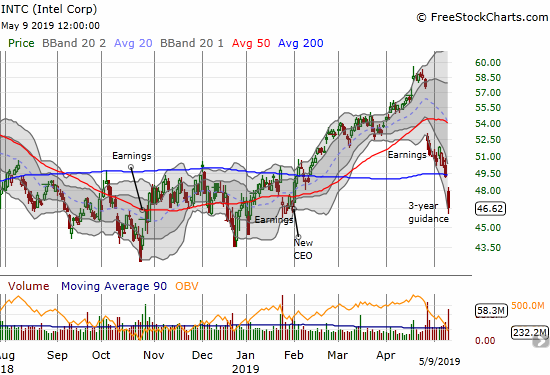
Intel (INTC)
My rush to launch my next between-earnings call buying on Intel (INTC) was clearly premature. INTC doubled down on bad news with the presentation of its 3-year plan. The resulting 5.3% drop to levels last seen in late January created a bearish 200DMA breakdown. Still, rules are rules. I went ahead and bought a second tranche of INTC call options with the assumption that the lows of this year will hold. If the lows from October break down, I will start considering a purchase of shares.
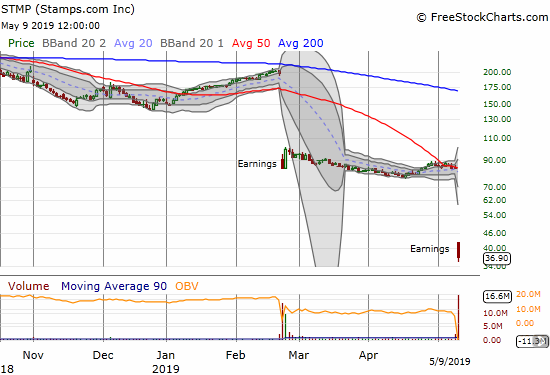
Stamps.com (STMP)
Stamps.com (STMP) achieved an astonishing feat with two consecutive post-earnings one-day drops over 50%. After STMP announced in February the loss of its partnership with the U.S. Postal Service (USPS), I wondered what other business the company had to support itself. The company is indeed scrambling to diversify its business. From the Seeking Alpha transcript of the earnings call:
” Despite the success of the USPS reseller program, we have very recently become aware that the USPS is currently renegotiating the NSAs of several of our reseller partners. While these ongoing – our ongoing negotiations with uncertain outcomes and we have limited visibility given that the negotiations are being conducted solely between the USPS and the resellers. We believe that is reasonably likely that margins earned by resellers as a result of these negotiations will begin to decrease starting around the second half of 2019 and may continue to decrease in 2020 and 2021. Because we are one of the 125 organizations that have a revenue share arrangement with the resellers, the expected decreases in margins earned by the resellers will also negatively impact our financial results.
We also expect that it will directly impact the financial results of many of those approximately 125 companies…
While we do not expect the USPS to take such actions, that in our opinion are counterproductive to their own interests, they are an example of why we feel so strongly that the actions we took last quarter to diversify our carrier relationships away from our USPS-centric model, were absolutely the right business decision…We have amassed a significant number of assets in worldwide e-commerce shipping that put us in a great position to succeed, as all of these rapidly changing global shipping trends unfold. “
Time is of the essence as the company is plowing ahead with more share repurchases despite being significantly underwater on the last tranche.
“During Q1, we repurchased approximately 235,000 shares at a total cost of approximately $32 million. On March 8 of 2019, our Board of Directors approved $60 million share repurchase plan, which is scheduled to expire in September 2019. To-date, approximately $24 million has been repurchased under our plan.
On May 1 of this year, the Board of Directors adjusted this repurchase parameters and the plan is now expected to repurchase an additional approximately $9 million in addition to the approximately $24 million already purchased between May 9 and expiration of September of this year. “
The stock’s plunge shows investors have little patience to stick around and see whether the company’s long-term strategies can outpace expectations for significant margin revenue reductions in 2020 and 2021.
Stock Chart Reviews – Bullish
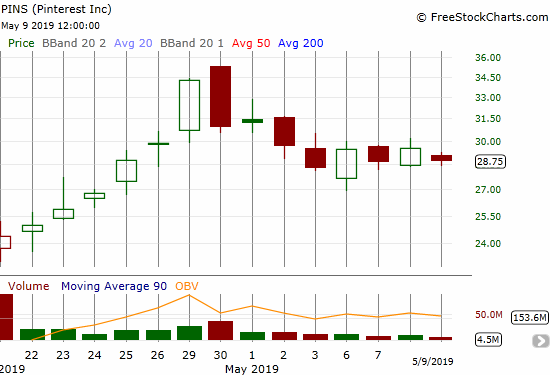
Pinterest (PINS)
Pinterest (PINS) has delivered a pleasant post-IPO surprise. The company priced its shares at $19 and the stock opened at $23.75. The stock went up for 6 straight days from there before sellers stepped in and put an emphatic end to the rally. The stock is now consolidating and presents a buying opportunity with a tight stop below $27.
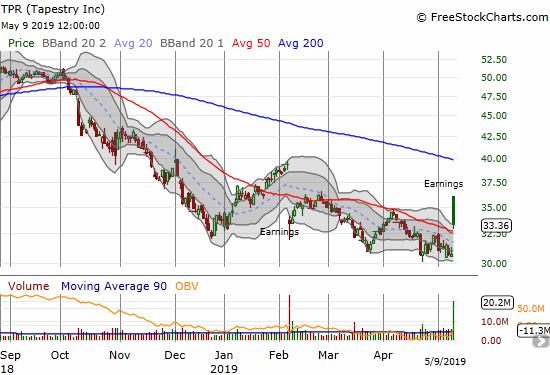
Tapestry (TPR)
When Tapestry (TPR) was known as Coach (COH), I looked to buy into post-earnings weakness. I have yet to trade TPR as the stock has been weighed down since a peak around $48 a year ago. The TPR post-earnings trade started well with a gap up and 50DMA breakout, but sellers quickly went to work. The stock ended up with a healthy 8.5% but a gap and crap that almost tested 50DMA support. The stock is still bullish with the potential for a “calm after the storm” setup unless it closes below its 50DMA again.
— – —
FOLLOW Dr. Duru’s commentary on financial markets via email, StockTwits, Twitter, and even Instagram!
“Above the 40” uses the percentage of stocks trading above their respective 40-day moving averages (DMAs) to assess the technical health of the stock market and to identify extremes in market sentiment that are likely to reverse. Abbreviated as AT40, Above the 40 is an alternative label for “T2108” which was created by Worden. Learn more about T2108 on my T2108 Resource Page. AT200, or T2107, measures the percentage of stocks trading above their respective 200DMAs.
Active AT40 (T2108) periods: Day #87 over 20%, Day #85 over 30%, Day #80 over 40% (overperiod), Day #3 under 50% (underperiod), Day #3 under 60%, Day #46 under 70%
Daily AT40 (T2108)
")
Black line: AT40 (T2108) (% measured on the right)
Red line: Overbought threshold (70%); Blue line: Oversold threshold (20%)
Weekly AT40 (T2108)

*All charts created using FreeStockCharts unless otherwise stated
The T2108 charts above are my LATEST updates independent of the date of this given AT40 post. For my latest AT40 post click here.
Related links:
The AT40 (T2108) Resource Page
You can follow real-time T2108 commentary on twitter using the #T2108 or #AT40 hashtags. T2108-related trades and other trades are occasionally posted on twitter using the #120trade hashtag.
Be careful out there!
Full disclosure: long UVXY call spread, long UVXY puts,long IWM calls, long INTC calls, long AUD/JPY (as a hedge)
*Charting notes: FreeStockCharts stock prices are not adjusted for dividends. TradingView.com charts for currencies use Tokyo time as the start of the forex trading day. FreeStockCharts currency charts are based on Eastern U.S. time to define the trading day.