
Overall Assessment
I am neutral on KB Home (KBH). The company’s Q2 2019 earnings report offered just enough to erase the negativity going into earnings but offered nothing to ignite renewed upward momentum.
The company talked a great game with a lot of bullish commentary but the actual numbers and metrics belie the headlines. KB Home suffered small year-over-year declines almost across the board and guidance provided insignificant upside. A bet on KBH here is a bet on a significant (and unlikely) rebound in the Californian housing market and a very robust 2020 Spring selling season from an increased number of community openings. Margins look capped by lower-priced, entry-level homes. The stock’s valuation is very low, so the price of KBH stock could launch higher on a renewed stock market rally and a fresh surge in economic strength – both unlikely anytime soon. KBH is extremely vulnerable to any rebound in mortgage rates.
Stock Performance
- One day after reporting 2Q earnings: +7.9%
- Since the close after Q2 2018 earnings: -3.4%
- Since the close after Q2 2019 earnings: 3.6%
- For the year until the close before earnings: +23.2%; compare to +31.3% for the iShares Dow Jones US Home Construction ETF (ITB)
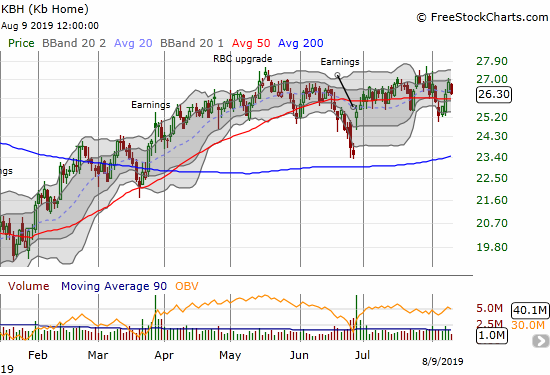
Source: FreeStockCharts
Valuation (from Yahoo Finance)
- 12-month trailing P/E: 10.4
- 12-month forward P/E: 8.7
- Price/book: 1.1
- Price/sales: 0.5
- Short % of float: 6.3%
Year-Over-Year Performance (3 months ended May 31, 2019 and quarter-ending values)
- Total revenue: -7.3%
- Home deliveries: +2%
- Average selling price: -8%
- Homebuilding operating income: -30.0%
- Homebuilding operating income margin excluding inventory-related charges: from 7.3% down to 5.5%
- Housing gross profit margin: from 17.1% to 17.2%
- Adjusted housing gross profit margin: 22.2% to 21.3%
- Net income per diluted share: -10.5%
- Ending backlog value: -3.1%
- Cash and cash equivalents: -73.3%
- Ratio of net debt to capital: from 46.8% to 43.3%
Year-Over-Year Performance (6 months ended May 31, 2019)
- Total revenue: -7.1%
- Home deliveries: 0%
- Average selling price: -7%
- Homebuilding operating income: -29.4%
- Net income per diluted share: from -$0.16 to +$0.82
Year-Over-Year Guidance and targets
- Community count for the year: +10% to +15%
- Housing revenues, 3Q: -10.0% to -3.4%
- Housing revenues, full year: -1.8% to +1.5%
- ASP, 3Q: -3.2% to -2.0%
- ASP, full year: -3.6% to -1.1%
- Home building operating margin: from 8.6% to a range of 6.7% to 7.3% (assuming this is not excluding inventory-related charges)
- Housing gross profit margin excluding inventory-related charges, 3Q: from 18.7% to a range of 17.9% to 18.5%
- Housing gross profit margin excluding inventory-related charges, full year: from 18.1% to a range of 17.9% to 18.5%
Highlights from the Earnings Call
General Guidance
- Higher confidence in forecasting visibility from the backlog, a strong quarter, and a strong Spring selling season : “this is the first time we’ve gone out to the full year.”
- A “strong finish” to the year.
- An increased contribution to mix from Californian homes.
- 10% – 15% increase in community count for 2019.
- “Normal seasonal trends” from Q2 to Q3.
- No “storm clouds on the horizon in the housing markets because there’s no inventory, rates are low and people out there looking and buying.”
- Margin gains from lower interest payments and higher margin community openings .
Market Conditions and Characteristics of Demand
- “…we’re right price point at the right place at the right time”
- A “nice ramp” in demand through the quarter.
- Higher priced homes have softer demand.
- Top 5 market share “…in just over 70% of our divisions as compared to roughly 50% when we launched our plan.”
- Grew share of first-time buyers to 55%.
- Company targets homes at the median income for the zip code.
Regional highlights
- In describing selling conditions in California, KBH talked a lot about mix, tough comps, and lack of inventory. The company even noted that the coastal division is its smallest in terms of units. When that division is doing well, KB Home typically makes it a highlight of the business.
- The West Coast region (probably mainly California) was a major driver of the revenue decline: a combination of a lower share of deliveries and lower ASPs from a shift in mix to lower-priced markets.
Margins and Costs
- A large change in the portfolio of homes drove most of the changes in margin.
- A second straight quarter of declines in input costs.
Pricing Power
- “Buyer pause” in second half of 2019 “moderated” housing prices.
- Sales incentives up just 30 basis points (bps) from Q1.
New markets and communities
- Falling Water in Seattle (Pierce County): targeting first-time and first move-up buyers starting with an ASP of $385,000 versus market’s median for a new house of $620,000 and existing home of $465,000.
Earnings sources
- 2019 2nd quarter results: June 26, 2019
- 2018 4th quarter results: January 9, 2019
- 2018 3rd quarter results: September 25, 2018
- Seeking Alpha Transcripts: KB Home (KBH) CEO Jeff Mezger on Q2 2019 Results – Earnings Call Transcript
Be careful out there!
Full disclosure: long ITB calendar call spread