
Overall Assessment
I am cautiously bullish on M/I Homes (MHO) which means I want to buy the stock on dips.
The company’s Q2 2019 earnings report demonstrated strong growth amid record financial performance. The homebuilder is benefiting from the increasing popularity of lower-priced homes as first-time home buyers look for affordable housing amid a scramble to take advantage of low mortgage rates. However, I am not fond of the company’s spec-based business model which creates additional vulnerability during a slowdown in the housing market. For now, the MHO’s inventory build should help the company profit nicely from the current demand dynamics.
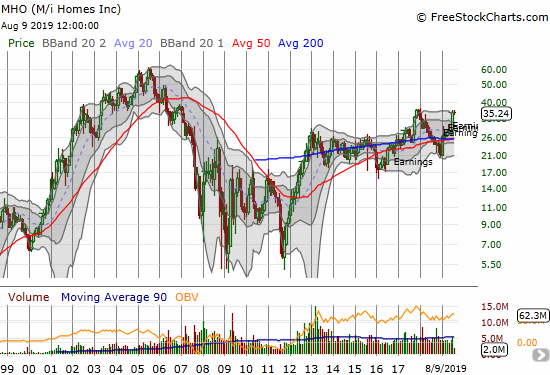
MHO caught my attention in late July, when the stock experienced a major post-earnings breakout (see daily chart below). With a widening breakout among select homebuilders two weeks prior, I decided it was finally time for me to get more familiar with M/I Homes. This earnings review is my first spin at examining the company. The monthly chart below helps explain why to-date I did not actively track MHO: 1) the company had a near-death experience during the financial crisis, 2) after the sharp rebound from the housing bottom, the stock went nowhere for about 5 years, 3) the big 2017 breakout lasted just 2 months before peaking. Note well how the latest run-up is bumping against that prior peak. On the bright side, based on past behavior, a breakout to new multi-year highs could quickly translate into a run-up toward the all-time highs set in 2005.
M/I Homes (MHO) is a very mature builder that has settled into a tight range on margins. The investment thesis for M/I Homes has to be all about sales and revenue growth that falls straight to the bottom-line. The company has lately found great success in affordable parts of the U.S. and in lower-priced homes in those markets. MHO relies on a spec business model of building inventory; the company sells homes from inventory. This is a great model when demand is strong and a heavy burden on the balance sheet when demand declines.
MHO does not provide forward-looking guidance, so the company is prone to major surprises both to the upside and downside. The large year-over-year increases in inventory suggest that the company is expecting very robust demand going forward. The company will be under pressure to sell these homes and continue its strong sales growth given it has little to no pricing power in the market.
Stock Performance
- One day after reporting Q2 2019 earnings: +10.1%
- Since the close after Q2 2018 earnings: +36.4%
- Since the close after Q2 2019 earnings: +10.6%
- For the year until the close before earnings: +37.6%; compare to +26.1% for the iShares Dow Jones US Home Construction ETF (ITB)
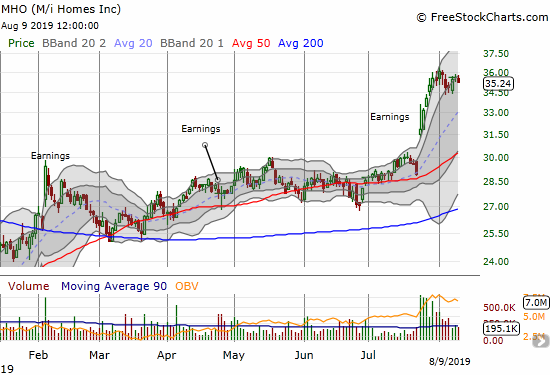
Source for charts: FreeStockCharts.
Valuation (from Yahoo Finance)
- 12-month trailing P/E: 9.1
- 12-month forward P/E: 8.4
- Price/book: 1.1
- Price/sales: 0.4
- Short % of float: 1.9%
Year-Over-Year Performance (3 months ended May 31, 2019 and quarter-ending values)
- Total revenue: +12% (record total)
- Home deliveries: +9%
- Average selling price: -0.3%
- Homebuilding operating income: +20.0%
- Housing gross profit margin: from 20.0% to 19.2%
- Adjusted housing gross profit margin: N/A
- Net income per diluted share: +12.5%
- Ending backlog value: -4.3%
- Cash and cash equivalents: -70.0%
- Ratio of net debt to capital: from 47% to 45%
Year-Over-Year Performance (6 months ended June 30, 2019)
- Total revenue: +10.9%
- Home deliveries: +7.6%
- Average selling price: +2.6%
- Homebuilding operating income: +10.0%
- Net income per diluted share: +9.6%
Year-Over-Year Guidance and targets
- N/A
Highlights from the Earnings Call
General Guidance
- Goal to maintain about a 1-year supply of own finished lots
Market Conditions and Characteristics of Demand
- “We’ve now learned that there is significant rate sensitivity…as the rates jumped up in the latter part of last year, I think it had a pretty obvious chilling effect on buyer demand with respect to new home purchases.”
- “…we’re not in a runaway demand situation by any measure…there [may be] a few pockets in the country where demand is off the charts.”
- MHO set company records for “new contracts, homes delivered, revenue and income.”
- For a few years now, the most affordable homes (the Smart Series) have performed better than the company’s other homes in margins and pace.
- The Smart Series is running about 20% sales and exceeding expectations of 15%.
- Traffic for Q2 was down 5%.
- First-timers in the Southern region: 43% of sales in Q2 versus 38% in Q1.
Regional highlights
- Realignment of regions
- Southern region (60% of deliveries): Florida (Tampa, Orlando, Sarasota), Texas (Houston, Austin, Dallas, San Antonio), North Carolina (Charlotte, Raleigh)
- Northern region (40% of deliveries): Columbus, Cincinnati, Indianapolis, Chicago, Minneapolis, Detroit.
- Washington D.C. winding down.
- Chicago appears to be the only market where results were poor.
Inventory
- 464 completed inventory homes (about 2 per community), up 24.1% year-over-year.
- 1,413 total inventory homes: 522 in the Northern region, 891 in the Southern region, up 11.1% year-over-year.
- Total value of homebuilding inventory is currently $1.8B, up $111M year-over-year from higher community count and finished lots.
Margins and Costs
- M/I Homes generally runs a 20% gross margin business. Sometimes it will get up to 20.5%, sometimes down to 19.5%.
- Construction and labor costs were flat year-over-year; lower lumber costs offset higher labor costs.
Pricing Power
- “…don’t see where there’s significant pricing power.”
- Smart Series ASP is $300K versus nearly $400K for other homes.
New markets and communities
- N/A (shutting down Washington D.C.)
Share repurchasing activity
- $5M of outstanding shares in Q1
- No activity in Q2
Earnings sources
- 2019 2nd quarter results: July 24, 2019
- 2018 4th quarter results: February 5, 2019
- 2018 3rd quarter results: October 24, 2018
- Seeking Alpha Transcripts: M/I Homes, Inc. (MHO) CEO Bob Schottenstein on Q2 2019 Results – Earnings Call Transcript
Be careful out there!
Full disclosure: long ITB calendar call spread