
AT40 = 58.4% of stocks are trading above their respective 40-day moving averages (DMAs)
AT200 = ~52.4% of stocks are trading above their respective 200DMAs
VIX = 14.5
Short-term Trading Call: neutral
Stock Market Commentary
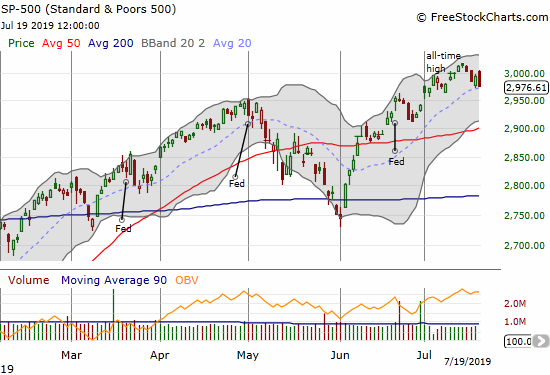
A week ago, the S&P 500 (SPY) made a new all-time, and I was expecting a trip into overbought conditions. AT40 (T2108), the percentage of stocks trading above their respective 40-day moving averages (DMAs), closed at 68.5%, just below the overbought threshold of 70%. My favorite technical indicator drifted lower from there and closed last week at 58.4%. This is typically a bearish move. While the S&P 500 is down 1.2% over that time, the risk/reward for shorting the market is poor ahead of a Federal Reserve meeting where the market giddily expects rate cuts and dovish talk.
Rate Cut Drama
There was a bit of rate cut drama last week with the Federal Reserve twisting the market in the winds a bit. The most interesting Fedspeak came from James Bullard who confirmed what Fed-followers already know: the Fed defers to the market and understands the negative impact of creating surprises with monetary policy. The video below from Nightly Business Report should start at the 1:55 mark.
The drama was enough on Thursday to send the odds of a 50 basis points cut this week soaring to 60% according to CME FedWatch. I am quite surprised the stock market had a relatively tepid response to that sharp change. The market promptly reversed course on Friday as the odds came back down to earth and flattened with levels from a week ago. This manic behavior sets up the market for higher odds of disappointment with the Fed. Can the Fed manage to deliver some kind of upside surprise?
Volatility resurgence
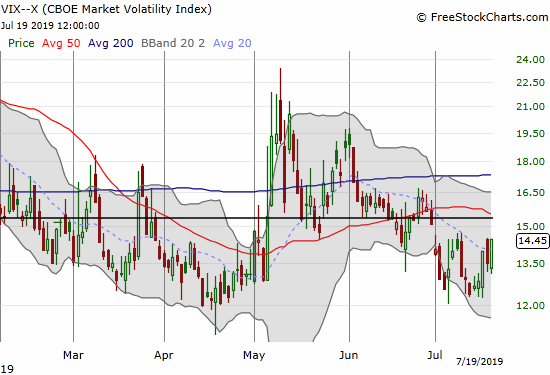
The volatility index (VIX) pulled off a strong week. The VIX’s strength on Wednesday forced my hand early on my plan to go long volatility just ahead of the Fed meeting. I bought a fresh tranche of call options on Ultra VIX Short-Term Futures ETF (UVXY) expiring on August 2. If they get cheaper before the Fed, I will buy more.
Stock Chart Reviews – Bearish
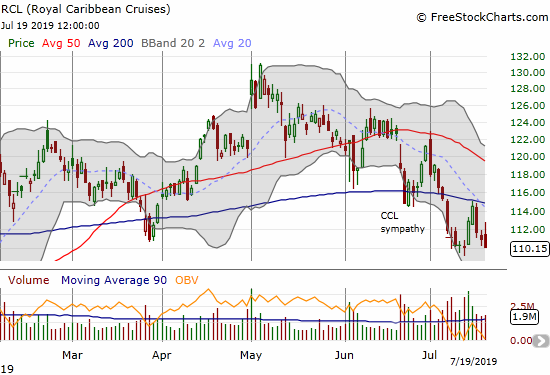
Carnival Corp (CCL) and Royal Caribbean Cruises (RCL)
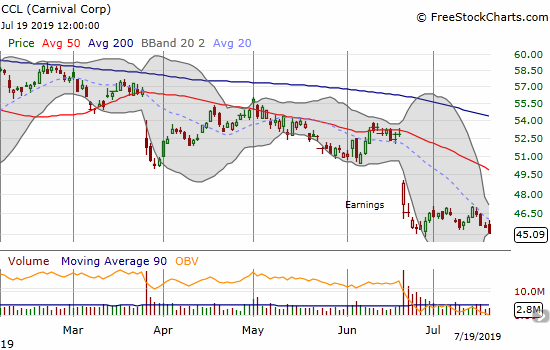
My pairs trade buying calls on Carnival Corp (CCL) and puts on Royal Carribean Cruises (RCL) completely failed. CCL never gained any upward push and even managed to close at expiration near a 3-year low. RCL still looks bearish, but the stock managed a deadcat bounce soon after I bought the put options. As they say, timing is everything…
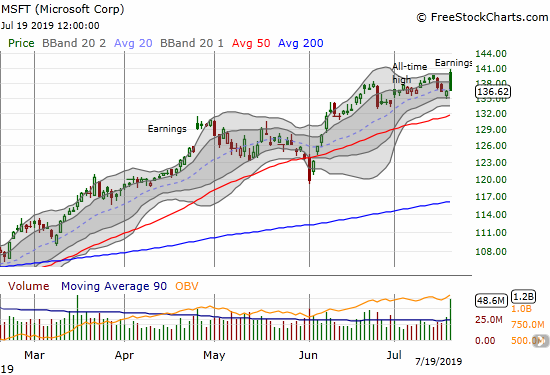
Microsoft (MSFT)
Technically, Microsoft (MSFT) is bullish since it is still in a healthy uptrend guided by 50DMA support; the long-term and intermediate trends are bullish. However, the gap and crap post-earnings move looks bearish since it completely reversed the gap and put MSFT at the edge of a continuation of the small pullback that preceded earnings. My downside expectations are quite modest: a fresh test of 50DMA support. A new all-time high will be very bullish.
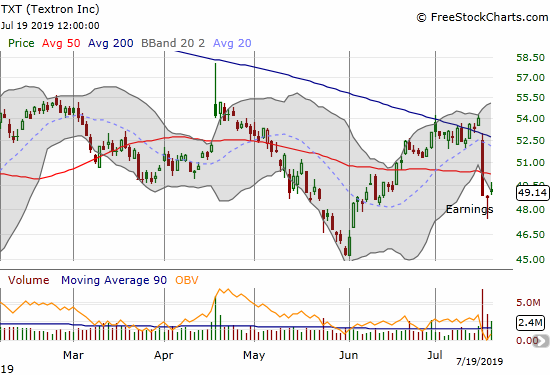
Textron (TXT)
Textron (TXT) is an industrial name that disappointed post-earnings. I will be watching TXT to see whether post-Fed euphoria revives the stock despite the bad news. I am collecting names like TXT as a test of whether the market is willing to assume that all will be well after rate cuts.
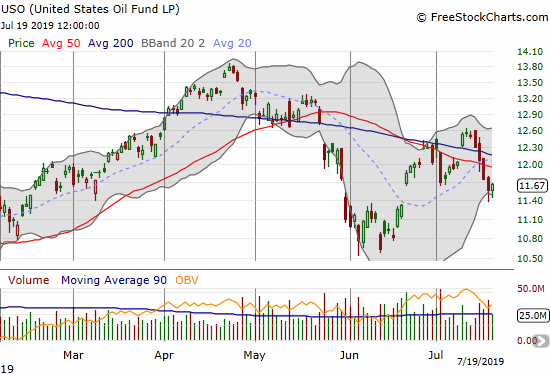
United States Oil Fund (USO)
Oil looks bearish again. The United States Oil Fund (USO) nearly filled the gap up from June. Even Iran’s seizure of a British tanker that reportedly violated shipping rules barely budged prices. My last USO trade worked well as it rallied into converged 50 and 200DMA resistance. The current pullback is too shallow to get me interested despite rate cuts around the corner.
Stock Chart Reviews – Bullish
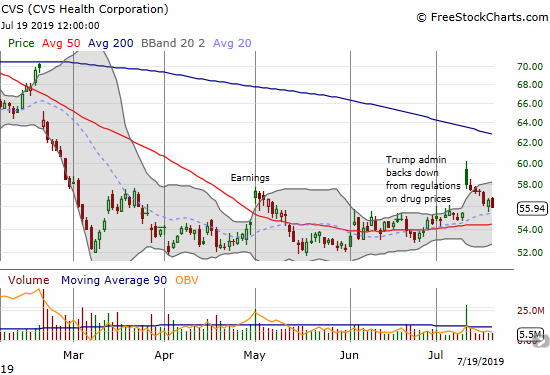
CVS Health Corporation (CVS)
CVS Health Corporation (CVS) experienced a bullish breakout on the heals of capitulation by the Trump administration on regulations for drug prices. If I was still in bearish mode on pharmacies, I would have jumped on the chance to fade the stock. Instead I just watched as CVS sank and sank slowly but surely. I am keeping CVS in the bullish camp because of the extended period of consolidation that seems to be building a good base. SwingTradeBot is flagging several bullish signals for CVS.
Ironically, after trying for days to get my long trade on Walgreens Boots Alliance (WBA) going, this regulatory news finally got me into the call options at the price I wanted.
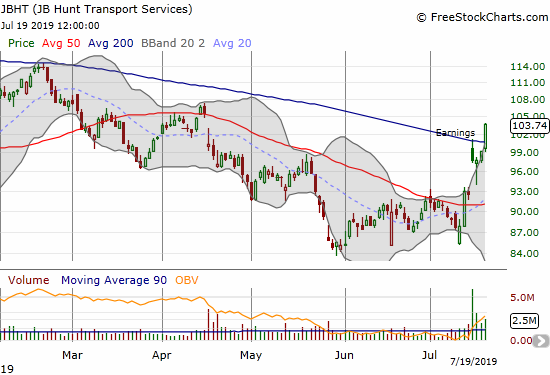
JB Hunt Transport Services (JBHT)
JB Hunt Transport Services (JBHT) impressed with a post-earnings 200DMA breakout. The stock went through some tough gyrations to get there. It now needs another day of follow-through buying to confirm the turn.
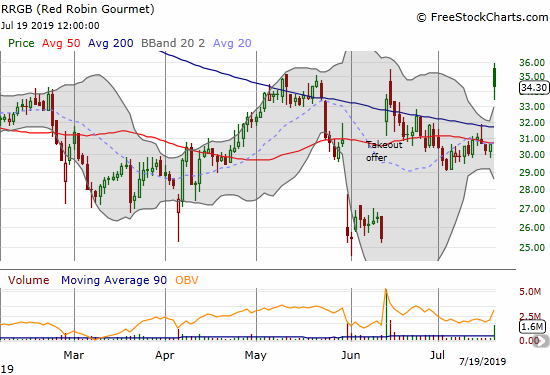
Red Robin Gourmet (RRGB)
Red Robin Gourmet (RRGB) drifted lower from the stock’s breakout on a takeout offer. I jumped on the opportunity to buy into the market’s skepticism about the news and accumulated stock on the way down. Even now with an official offer on the table, the stock faded from is intraday highs and remains well below the presumed $40 value of the deal. I am staying long.
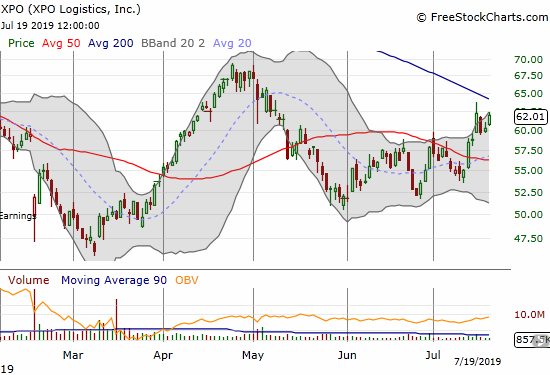
XPO Logistics (XPO)
XPO Logistics (XPO) hit my price target for the latest trade. The market remains very wary of this stock. I am ready to buy the next dip. I imagine XPO will not manage a 200DMA breakout before the next dip.
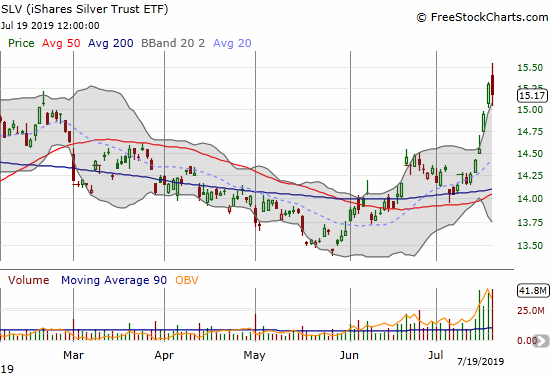
iShares Silver Trust ETF (SLV)
Again, timing is everything. A month ago, iShares Silver Trust ETF (SLV) finally broke out from converged 50 and 200DMA resistance. I bought a fist full of call options to supplement my long-term holdings in shares. I thought a month was plenty of runway, but SLV proceeded to drift lower into a successful test of support. With expiration barreling down on the position, I took profits on Tuesday’s breakout to near 4-month highs and a move above the upper Bollinger Band (BB). After SLV faded, I felt relief that I did not chance pushing my luck close to expiration. SLV proceeded to sprint two more days before Friday’s stalling action. I left a LOT of money on the table!
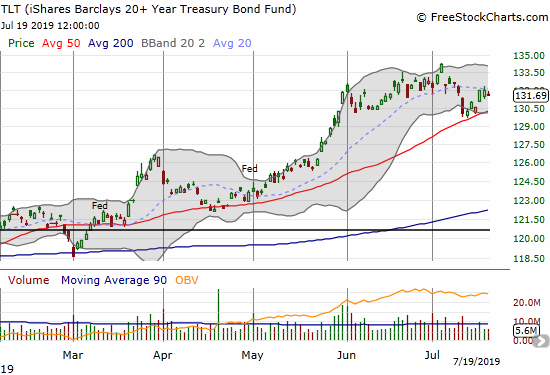
iShares Barclays 20+ Year Treasury Bond Fund (TLT)
Assuming the bond market has priced in its beliefs about near-term monetary policy, I think the iShares Barclays 20+ Year Treasury Bond Fund (TLT) has topped out. The main catalyst remaining to push it higher would be an economic calamity that moves beyond the near-term reach of monetary policy. Otherwise, I will not be surprised if the bond market starts to push long-term rates a little higher (TLT lower) in anticipation of the (re)inflationary impact of lower rates. I am mainly interested in TLT puts at these heights.
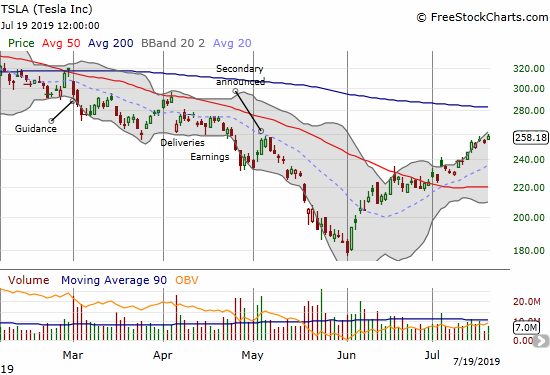
Tesla (TSLA)
Soon after I wrote about trading strategies for Tesla (TSLA), the stock fells out of bed. The scenario for hedging unfolded faster and deeper than I imagined at the time. The persistent selling after the secondary particularly caught me off guard; it normally would have been a time for me to try a short or put options. Now, the stock is enjoying a sharp rally off its multi-year low ahead of earnings this week. While I am not trying a pre-earnings play, I estimate there is a 50/50 chance that either post-earnings TSLA quickly tests 200DMA resistance or drops sharply back to 50DMA support. I hope to have enough post-earnings time to choose one of the scenarios after earnings.
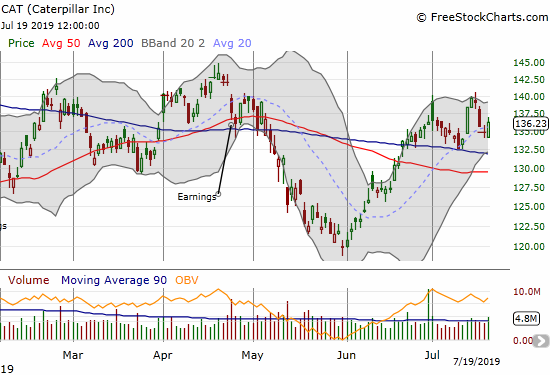
Caterpillar (CAT)
Caterpillar (CAT) has churned in a wide range for a month. During this time, the stock precisely held 200DMA support. Earnings are the morning of July 24th. If the stock goes down, I plan to join the sellers.
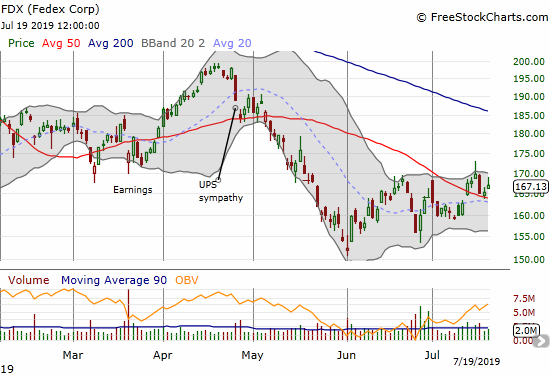
Federal Express (FDX)
The pattern is subtle: a bottoming is unfolding for Federal Express (FDX). Since the June low, FDX made a higher low on the heels of its last earnings report. Last week’s 50DMA breakout ushered in a higher high. I am a buyer given the 50DMA held as support on Thursday.
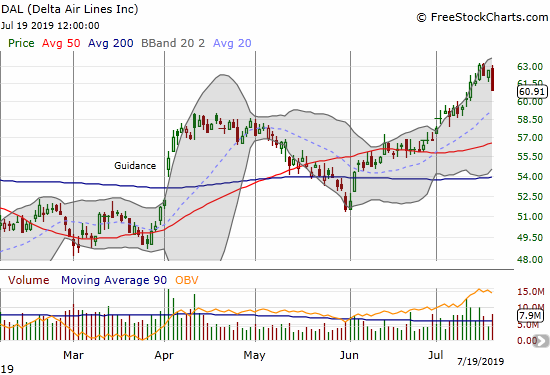
Delta Air Lines (DAL)
Delta Airlines has uncharacteristically marched steadily higher for 2 months. The party looks like it is finally over with the 2.8% pullback on Friday. The risk/reward for a buy does not improve until a 50DMA test.
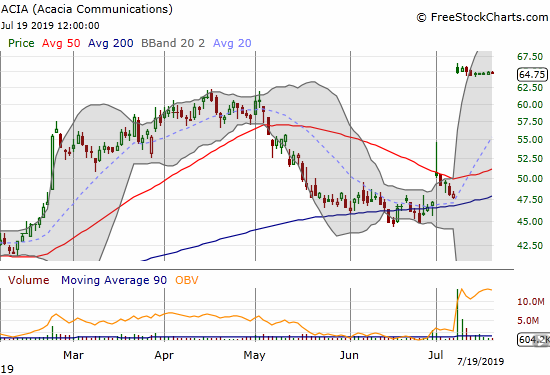
Acacia (ACIA)
I wrote bearishly several times about Acacia (ACIA) including a summary of the bearish case back in April, 2018. However, after December’s plunge, I stopped paying much attention. Now the game is over with Cisco (CSCO) buying out the company at a price that matches an all-time high. There was an opportunity to go long ACIA with 200DMA support holding up after the May sell-off.
— – —
FOLLOW Dr. Duru’s commentary on financial markets via email, StockTwits, Twitter, and even Instagram!
“Above the 40” uses the percentage of stocks trading above their respective 40-day moving averages (DMAs) to assess the technical health of the stock market and to identify extremes in market sentiment that are likely to reverse. Abbreviated as AT40, Above the 40 is an alternative label for “T2108” which was created by Worden. Learn more about T2108 on my T2108 Resource Page. AT200, or T2107, measures the percentage of stocks trading above their respective 200DMAs.
Active AT40 (T2108) periods: Day #134 over 20%, Day #34 over 30%, Day #27 over 40%, Day #17 over 50% (overperiod), Day #1 under 60% (underperiod, ending 13 days over 60%), Day #91 under 70% (underperiod)
Daily AT40 (T2108)
")
Black line: AT40 (T2108) (% measured on the right)
Red line: Overbought threshold (70%); Blue line: Oversold threshold (20%)
Weekly AT40 (T2108)

*All charts created using FreeStockCharts unless otherwise stated
The T2108 charts above are my LATEST updates independent of the date of this given AT40 post. For my latest AT40 post click here.
Be careful out there!
Full disclosure: long UVXY calls, long SLV, long RRGB, long WBA calls, long TLT puts
*Charting notes: FreeStockCharts stock prices are not adjusted for dividends. TradingView.com charts for currencies use Tokyo time as the start of the forex trading day. FreeStockCharts currency charts are based on Eastern U.S. time to define the trading day.