
AT40 = 60.0% of stocks are trading above their respective 40-day moving averages (DMAs)
AT200 = 52.4% of stocks are trading above their respective 200DMAs
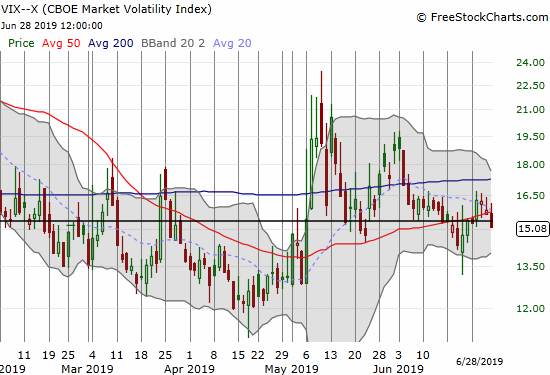
VIX = 15.1
Short-term Trading Call: neutral
Stock Market Commentary
Trade War
The search for news bad enough to convince the Federal Reserve to cut rates continues.
The weekend began with news that, surprise-surprise, U.S. President Donald Trump and China’s President Xi Jinping agreed to a “truce” in their trade war. The truce means yet more “constructive” talks are likely ahead. Also, the U.S. will not add more tariffs to Chinese goods…until Trump gets frustrated again of course. I cannot tell whether this truce news is good or not; did the market rebound into the weekend in anticipation of a truce or something more substantial? The truce is certainly not a game changer for monetary policy: uncertainties still abound and businesses cannot plan well with these kinds of abiding clouds looming in the skies. So the wait continues for news bad enough to officially push the Federal Reserve into an easing cycle.
Stock Market Milestones and Extremes
The second quarter ended with more financial market history and milestones. Per CNBC:
- The S&P 500 (SPY) scored its best first six months of a year since 1997. Year-to-date performance was 17.3%.
- The Semiconductor ETF (SMH) gained 12.2% in June for its largest one-month gain since September, 2010.
- Gold gained over 7% in June which was its largest one-month gain gain since June 2016.
In other words, the stock market is swinging from one extreme to another. The recent all-time highs should be of little comfort because they likely set the stage for the next downside extreme.
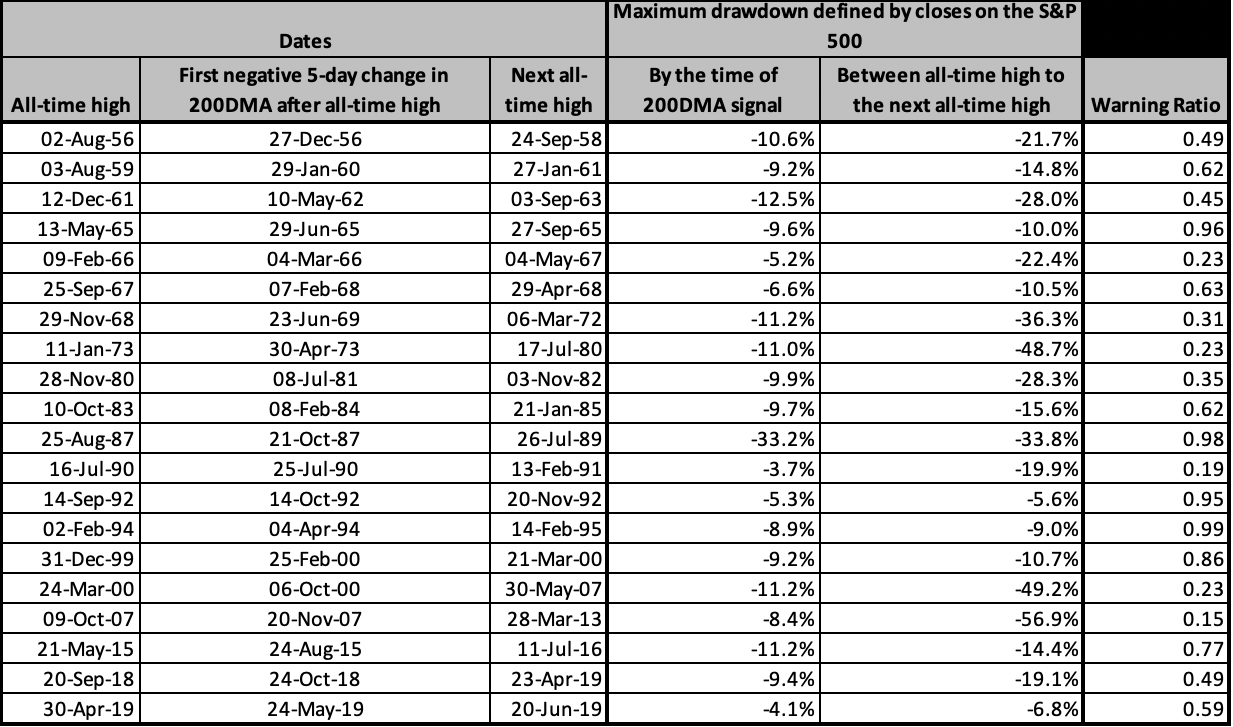
The 200DMA Signal is one measure of market extremes. The 200DMA Signal triggers if the 200-day moving average (DMA) of the S&P 500 (SPY) declines for 5 consecutive days after hitting an all-time high. This threshold sounds low, but since 1955, the index has only suffered 20 such declines; each one was part of a larger sell-off. The index has already suffered three of these extremes in the last 4 years.
The S&P 500 was only down 4.1% when it triggered the 200DMA Signal on May 24th. I braced for a significant drawdown to come, but the index quickly bottomed out with a maximum drawdown of 6.8%. The resulting “warning ratio” of 0.6 (4.1/6.8) was unremarkable, and the absolute losses were the second mildest of this series. Of course the prospects of easy money from the Federal Reserve were likely a big saving grace. If ever the market takes a negative spin on the Fed’s action or inaction, I fully expect the “pent-up” selling from May to resume with a quickness.
Small-Caps Come Alive
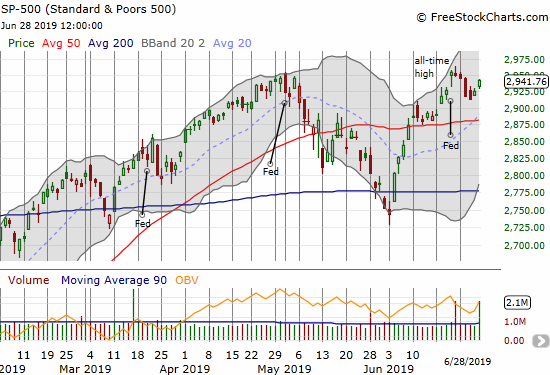
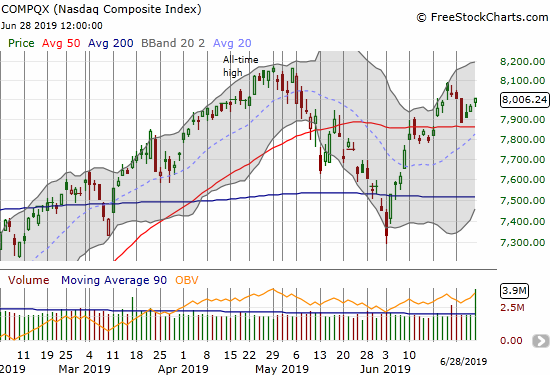
Last week, the S&P 500 (SPY) finished reversing its post-Fed gains, but started to bounce back the last two days. The NASDAQ (COMPQX) is three days into its rebound.
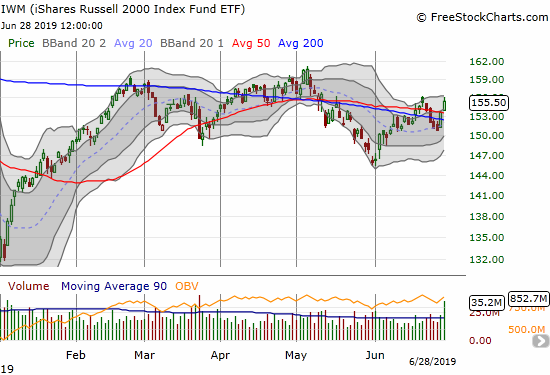
The iShares Russell 2000 ETF (IWM) was the most interesting story to end the week. IWM was a clear sign of weakness with its 50 and 200DMA breakdown to start the week. IWM’s rebound in the past two days put the index right back into bullish territory. While IWM pulled back slightly on Friday from the previous peak, the index finally looks awakened and ready to continue higher. IWM could become a key pivot point in the coming week or more.
AT40 (T2108), the percentage of stocks trading above their respective 40DMAs, benefited greatly from the reawakening of small-caps as well as a 1.4% surge on Friday in the SPDRs Select Sector Financial ETF (XLF). AT40 closed the week at 60.0%, a near 2-month high. Finally, there is more broad participation in the market push higher.
The volatility index (VIX) quickly flipped out of warning position as it closed below its 15.35 pivot once again. My last tranche of Ultra VIX Short-Term Futures ETF (UVXY) calls expired harmless. I refreshed with a new tranche expiring in 2 weeks only because of the G20 catalyst. Otherwise, I would have left it alone. The hedge is near useless in an environment where bad news could be good news (for rate cuts). For example, there was only a brief moment in the last mild pullback where I could have taken profits on my last tranche of UVXY call options.
Stock Chart Reviews – Bearish
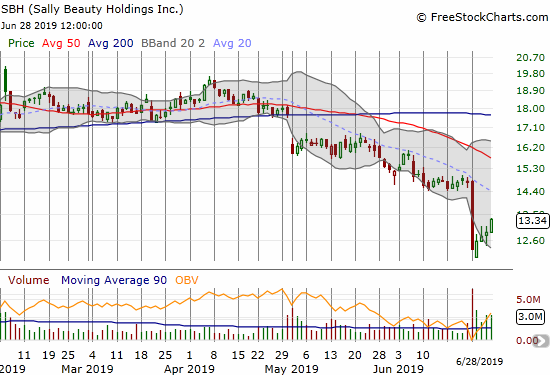
Sally Beauty Holdings (SBH)
Another Amazon Panic hit the market last week. This time the beauty retail segment was trampled. As usual, the Amazon Panic turned into a short-term buying opportunity. Sally Beauty Holdings plunged 16.8% to start the week. After a gap down open the following day, buyers took over. While I think the rebound will continue, it should end at the downtrending 20DMA. This trendline defined the on-going bearish condition for SBH going into the Amazon Panic.
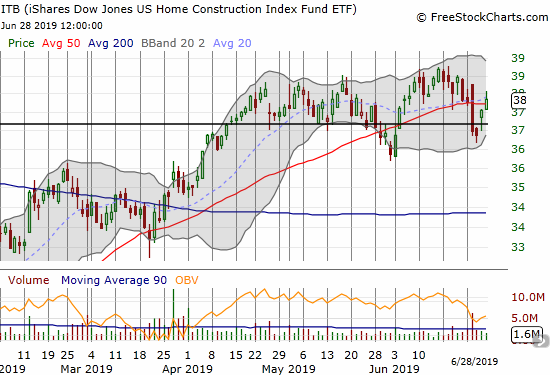
The iShares Dow Jones Home Construction ETF (ITB)
The iShares Dow Jones Home Construction ETF (ITB) continues to put up a fight against the seasonal top. While ITB managed to squeak a close above its 50DMA and recover the loss from the big down day on Tuesday, the churn still looks bearish. This bearishness is of course not confirmed until ITB breaks to a lower low (below the May low). I am currently thinking of a trade to take advantage of the churn in the meantime. A trade that prepares me for the start of the buying season for home builder stocks will likely look something like a July/December of August/December vertical spread initiated with ITB closer to the top of its trade range.
Stock Chart Reviews – Bullish
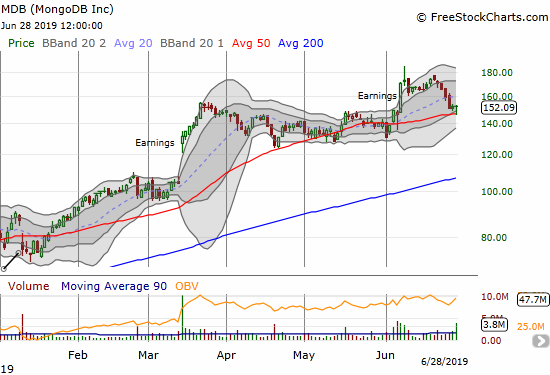
MongoDB (MDB)
For months I carried a short on MDB while flipping calls against that short. I finally tired of trying to make money on both sides of the coin and covered the short. I am now focused on the long side. MDB ended the week completing a reversal of its post-earnings gains while successfully retesting 50DMA support twice. MDB looks poised for a rebound.
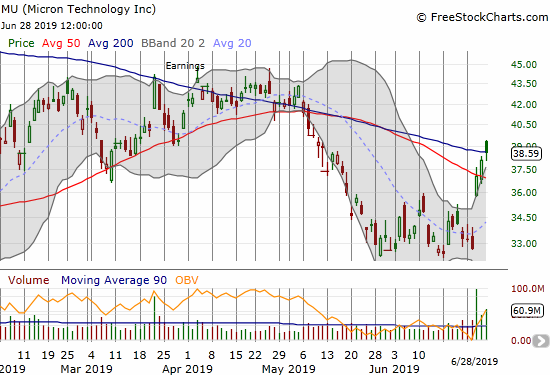
Micron (MU)
Micron (MU) made an impressive post-earning move that broke the stock away from a month of wide consolidation. The stock next managed to break through 50 and 200DMA resistance before settling right on top of its 200DMA all while closing above its upper Bollinger Band (BB) for three straight days. This move represents significant buying power and makes me think the stock has put in a major bottom.
I bought shares and sold calls against them thinking that the move needs a rest soon given the stretch above the upper-BBs. I also sold puts which I plan to cover in the coming week: I am aware of the bearish case looming over the stock given the poor quality of (headline) earnings results and an analyst $30 price target on the stock.
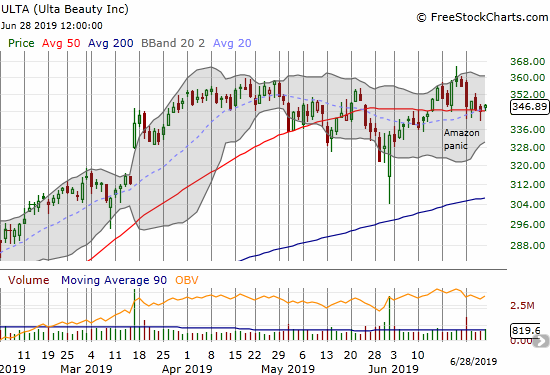
Ulta Beauty (ULTA)
Ulta Beauty (ULTA) suffered through the latest Amazon Panic in much better shape than SBH; ULTA only lost 2.6% on the day. While buyers have yet to start the classic panic reversal, ULTA is holding firm to 50DMA support. To play a rebound, I like opening a weekly vertical call spread at the $360 strike.
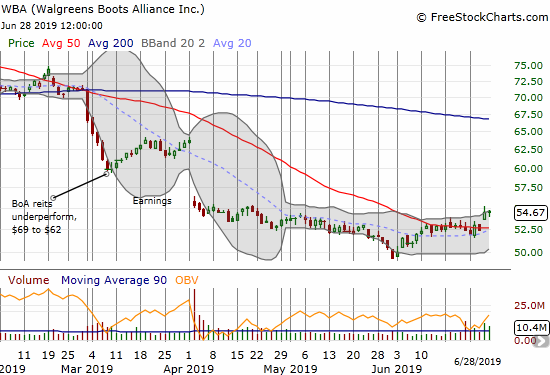
Walgreens Boots Alliance (WBA)
I am still bearish on the pharmacy stocks, but the technicals have me taking a step back. Trading activity in Walgreens Boots Alliance (WBA) slowed after the April post-earnings gap down. This month, WBA drifted into 50DMA resistance and ended June with a confirmed 50DMA breakout. The trade here is for further upside with a clear stop below the 50DMA. I am not sure yet where I would like to re-initiate a short, probably at 200DMA resistance if the stock can make it that far.
Valuation is another reason to avoid shorting and perhaps even a reason to make a contrary bet with a target at 200DMA resistance. WBA now sells at a 10.7 trailing and 9.1 forward P/E, a 0.4 price/sales ratio, and a juicy 3.2% dividend yield.
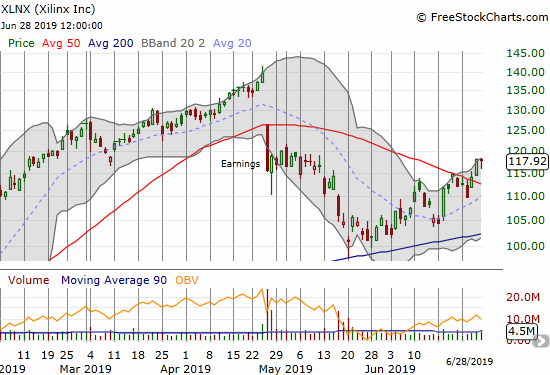
Xilinx (XLNX)
The turn-around in Xilinx (XLNX) continued last week with a 50DMA breakout. I used the move into 50DMA resistance to sell another call option short to recreate a covered call position. I selected a July $120 strike, and I will be quite satisfied with the stock getting called away. If I get to keep the stock, I will look to sell it before earnings the week after options expiration.
— – —
FOLLOW Dr. Duru’s commentary on financial markets via email, StockTwits, Twitter, and even Instagram!
“Above the 40” uses the percentage of stocks trading above their respective 40-day moving averages (DMAs) to assess the technical health of the stock market and to identify extremes in market sentiment that are likely to reverse. Abbreviated as AT40, Above the 40 is an alternative label for “T2108” which was created by Worden. Learn more about T2108 on my T2108 Resource Page. AT200, or T2107, measures the percentage of stocks trading above their respective 200DMAs.
Active AT40 (T2108) periods: Day #119 over 20%, Day #19 over 30%, Day #12 over 40%, Day #2 over 50% (overperiod), Day #38 under 60% (underperiod), Day #81 under 70%
Daily AT40 (T2108)
")
Black line: AT40 (T2108) (% measured on the right)
Red line: Overbought threshold (70%); Blue line: Oversold threshold (20%)
Weekly AT40 (T2108)

*All charts created using FreeStockCharts unless otherwise stated
The T2108 charts above are my LATEST updates independent of the date of this given AT40 post. For my latest AT40 post click here.
Related links:
The AT40 (T2108) Resource Page
You can follow real-time T2108 commentary on twitter using the #T2108 or #AT40 hashtags. T2108-related trades and other trades are occasionally posted on twitter using the #120trade hashtag.
Be careful out there!
Full disclosure: long MDB calls, long MU shares and short mU puts and calls, long UVXY calls, long GLD
*Charting notes: FreeStockCharts stock prices are not adjusted for dividends. TradingView.com charts for currencies use Tokyo time as the start of the forex trading day. FreeStockCharts currency charts are based on Eastern U.S. time to define the trading day.