
AT40 = 53.7% of stocks are trading above their respective 40-day moving averages (DMAs)
AT200 = 50.3% of stocks are trading above their respective 200DMAs
VIX = 15.4
Short-term Trading Call: neutral
Stock Market Commentary
The stock market is officially in bizarro world. The stock market is breathlessly rallying in anticipation of rate cuts that will come once the Federal Reserve sees sufficiently bad economic news. That combination of bad news and rate cuts can help speculators pour easy money into stocks, but it is FAR from clear those cuts will help individual workers and consumers who will find themselves on the short-end of the bad economic news.
On Wednesday the Federal Reserve bowed down to the market (as usual) with a decision on monetary policy that essentially promised the rate cuts that the stock market demands. The opening statement from Fed chair Jerome Powell was quite clever. The statement promised rate cuts from the Fed assuming bond yields stay extremely low while at the same time it staked a claim to on-going strength in the economy given employment conditions.
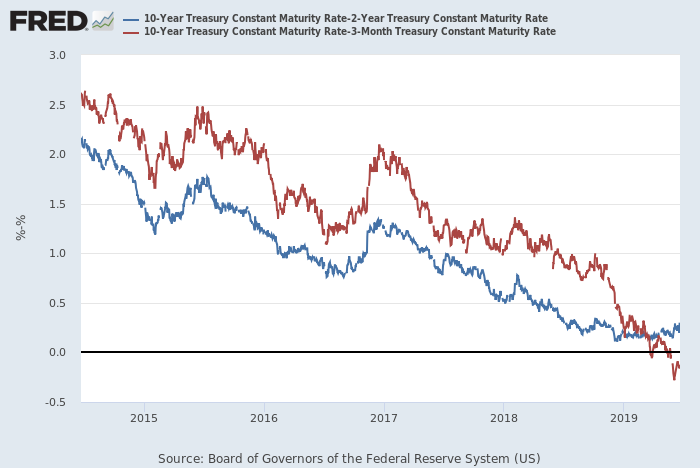
Source: Board of Governors of the Federal Reserve System (US), 10-Year Treasury Constant Maturity Rate [DGS10], retrieved from FRED, Federal Reserve Bank of St. Louis; June 23, 2019.
The Fed’s operative phrase is “higher uncertainties.” The Fed essentially associates the yield curve inversion with deflationary pressures in the economy without using the “R” word of recession (and it never will until a recession is a foregone conclusion). When the time comes for rate cuts, the Fed will claim it is taking out an insurance policy against a downside miss on its 2% inflation target.
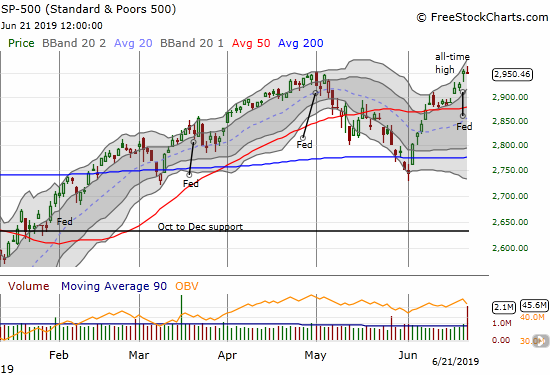
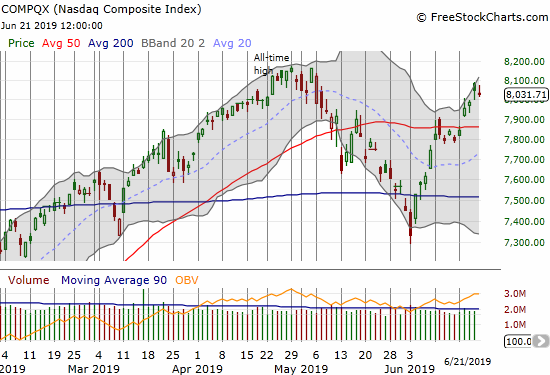
The stock market reaction was muted on Wednesday. After some overnight thinking and the collection of spare nickels and dimes ahead of the delivery of easier money, the stock market took off on Thursday. The S&P 500 (SPY) gapped higher to a new all-time high. The NADSAQ (COMPQX) also gapped higher but still has a few more rallies to get to an all-time high. These excitable buyers went right back to sleep on Friday.
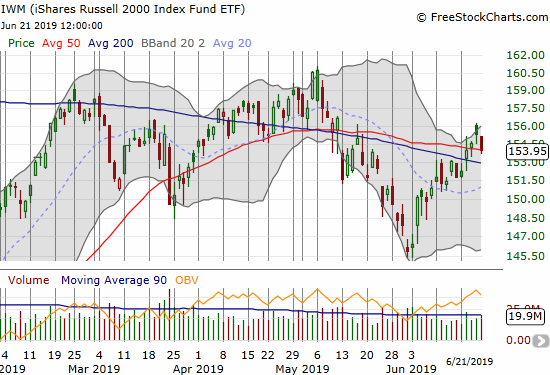
The iShares Russell 2000 ETF (IWM) is still a laggard, but at least it finally broke out above resistance at its 200 and 50-day moving averages (DMAs). Just to keep us on edge, IWM reversed all its Thursday gains and closed the week right on top of its 50DMA.
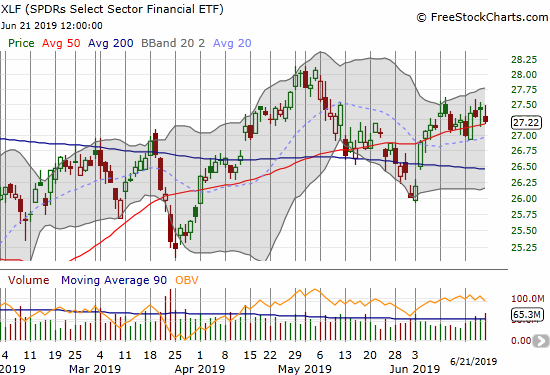
With rates going lower, financials are no longer reliable as a sign of economic and market strength. The Financial Select Sector SPDR ETF (XLF) lagged the S&P 500 on Thursday and closed on top of its 50DMA to end the week. XLF has no upward momentum right now. The June $28 XLF call options I bought months ago as a play on a potential extended market rally expired harmless on Friday.
AT40 (T2108), the percentage of stocks trading above their respective 40DMAs, has experienced just three down days in June, all minor and the last one on Friday. At 53.7%, AT40 is still in no-man’s land, but it has almost erased all its losses from May. Still, my favorite technical indicator is severely lagging an S&P 500 at all-time highs given the lackluster participation of indices like IWM and XLF. This kind of divergence is not yet bearish because AT40 is trending higher, but the lag gives me firm cause to stay neutral on the stock market.
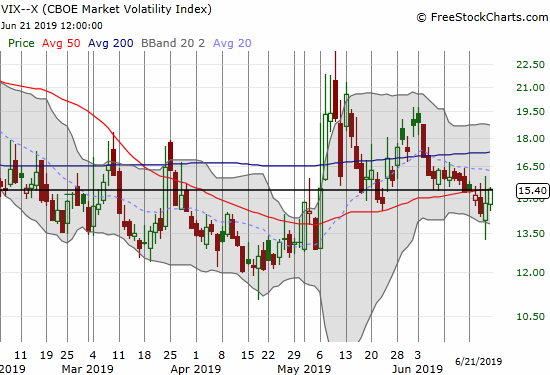
The volatility index (VIX) provided another reason to press pause on the euphoria. Even as the market soared on Thursday, the VIX managed to recover enough from its lows to register a gain. The volatility faders failed again on Friday to keep the VIX down. My latest tranche of call options in Ultra VIX Short-Term Futures ETF (UVXY) actually went nicely positive on Thursday but faltered on Friday. With the G20 meeting coming up this week, volatility should have an upward bias.
Stock Chart Reviews – Bearish
Broadcom (AVGO)
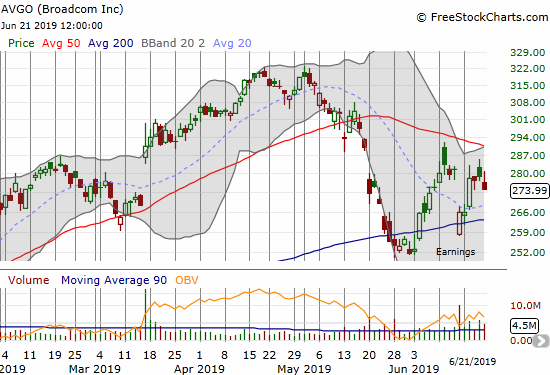
In my last Above the 40 post, I expressed surprised at the ability of Broadcom (AVGO) to bounce back from its 200DMA breakdown. I also did not expect a relief rally strong enough to fill the post-earnings gap down. Yet, AVGO pulled off both feats. I promptly faded the move as planned. I used a put spread in deference to the strange resurgence of buyer interest. I am looking for at least a retest of 200DMA support on a pullback.
Advanced Micro Devices (AMD)
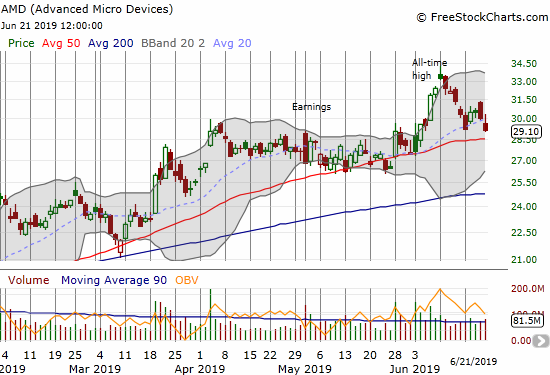
It was a comedy of errors: my bearish call on Advanced Micro Devices (AMD) proved correct, but I lost money on my trade anyway. As planned, I bought put options ($30 strike, expiring on Friday of the same week) at the beginning of the week almost right at the open. Instead of taking the fortuitous profits at the close, I waited for what I thought would surely be a gap down to 50DMA support. Instead, AMD gapped UP the next day. The stock barely responded to the dovish Fed, so I held on.
On Friday, AMD gapped down only to rally right to $30. Assuming a pin at $30 was in play, I took the loss and salvaged what I could. AMD ended the day with sellers back in control. If I had somehow stayed in the game, I would have recovered most of the profits I let vaporize after Monday. I believe I played this one correctly wihtout the benefit of hindsight, but perhaps one mistake was in choosing expiration just 4 days away with a dovish Fed decision potentially planted right in the middle of the trade.
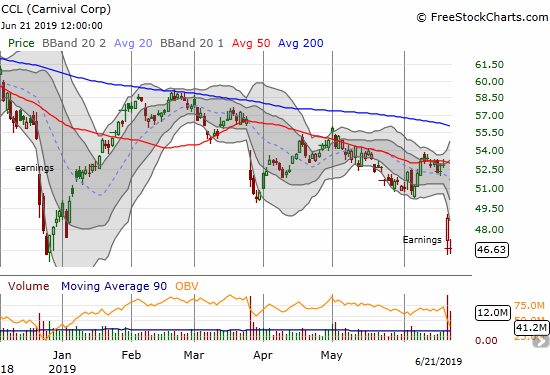
Carnival Corp (CCL)
Carnival Corp (CCL) is an obviously bearish chart given its post-earnings collapse that confirmed on-going resistance at its 50DMA. However, the stock held support at the December lows pretty well. Moreover, stubborn buyers keep buying the steady dose of bad news coming from CCL: see the bounces from the December and March post-earnings gaps down. As a result, I am inclined to speculate on some kind of rebound before the stock heads lower once again. An easy money Fed permits such speculation; as eager buyers look for merchandise, stocks like CCL can look like bargains compared to the rest of the stock market.
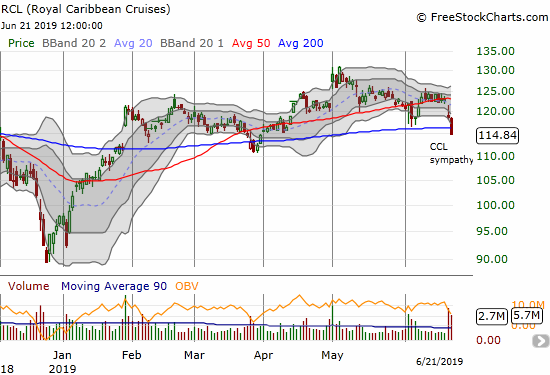
Royal Caribbean Cruises (RCL)
Royal Caribbean Cruises (RCL) gapped down and broke down in sympathy with CCL. The stock becomes a perfect complement to hedge bullish speculation in CCL. I like a pairs trade with RCL puts and CCL calls. RCL likely reports earnings in early August so I will target July strikes as a first swing at this trade.
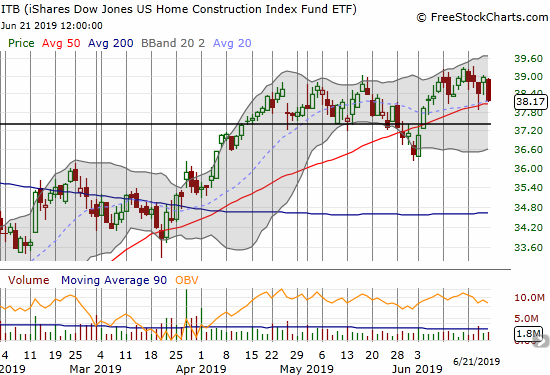
The iShares Dow Jones Home Construction ETF (ITB)
I am on permanent housing watch.
Nothing speaks louder about the bizarre conundrum of the trading environment than home builders. The overall housing data continues to wobble, and the prospect of a slowing economy means that housing will likely take a big hit (see the last 3 months of 2018!). While the prospect of lower rates gets speculators piling into stocks in the face of economic weakness, individual consumers are less likely to take the risk of purchasing homes in the face of heightened economic uncertainty.
The iShares Dow Jones Home Construction ETF (ITB) has put up a great fight against the seasonal top, but individual home builder stocks may finally be running out of gas. ITB fell on Friday by 2.0% as analyst downgrades took their toll. I am not waiting for a fresh 50DMA breakdown or a drop below the june lows to put ITB in the bearish column.
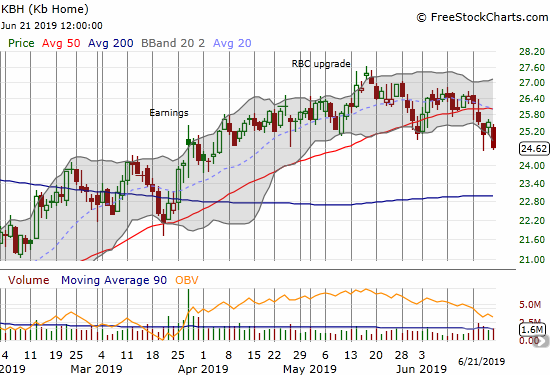
KB Home (KBH)
KB Home (KBH) is one of the stocks pulling down on ITB. Raymond James joined the consistently bearish chorus of analysts covering KBH by downgrading the stock from market perform to underperform. That change of heart helped KBH break down below 50DMA support. KBH closed Friday at a 2+ month low.
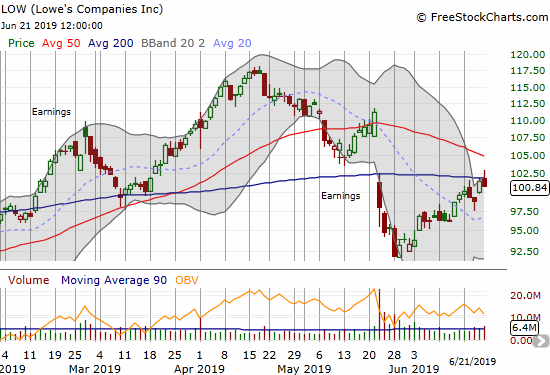
Lowe’s Companies (LOW)
Lowe’s Companies (LOW) is struggling to keep up with competitor Home Depot (HD). After a bearish post-earnings 50 and 200DMA breakdown, LOW spent the month of June in recovery mode. Last week, the stock rallied to and then through 200DMA resistance only to have sellers push it backward. With overhead resistance from its 50DMA looming overhead, LOW looks like it has hit a dead-end. Obliviously a confirmed 50DMA breakout would flip LOW to a very bullish position.
Stock Chart Reviews – Bullish
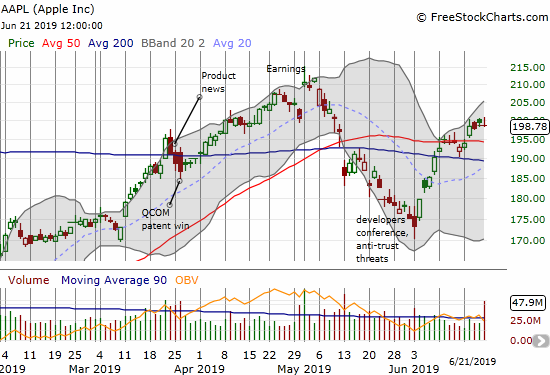
Apple (AAPL)
Apple (AAPL) traders cannot make up their minds. I flipped the bias on AAPL once again, this time to bullish because of last week’s 50DMA breakout and (marginal) follow-through. I expect upward momentum to stay tentative.
I had a calendar call spread that hit its profit target on Friday, and I decided to hold on making a fresh trade. I am starting to like the calendar call spread as a way to trade AAPL week-to-week rather than outright call options. My put spread backstop expired worthless on Friday as well. I will re-initiate a backstop sometime in the coming week hopefully ahead of G20 news.
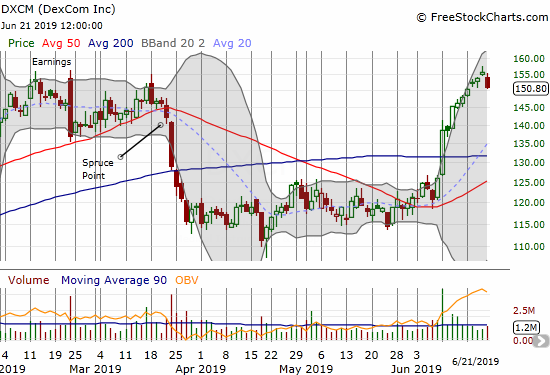
DexCom (DXCM)
I could not find any news to explain the sudden resurgence in DexCom (DXCM). DXCM reported earnings on May 1st, and the company presented at a growth conference on June 5th; that is the extent of the news I could find. Whatever happened to wake up the buyers was enough to overcome the damaging downgrade in March.
I was not paying enough attention to buy the 200DMA breakout. Now that I am paying attention again, I am buying into whatever dip is unfolding here. “Something” is up, and I want to be a part of it. I will likely open up a call spread with expiration ahead of the (unconfirmed) July 31st earnings date.
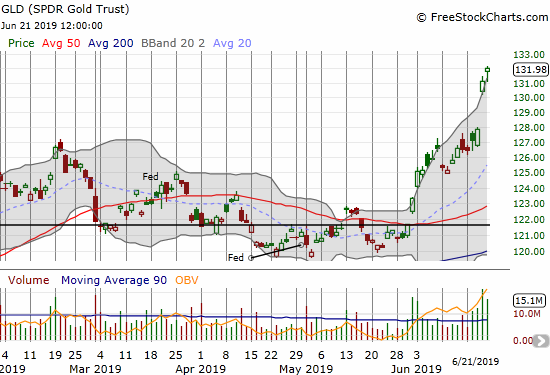
SPDR Gold Trust (GLD)
I was unhappy about missing the easy money breakout on SPDR Gold Trust (GLD) that started the month of June. So I eagerly added to my core GLD position when GLD experienced a shallow pullback. The calls I bought pretty much made my week. Thank you Jerome Powell and company! I of course continue to hold my core position. With 5+ year highs, gold bugs everywhere are starting to hear the echoes of validation. Needless to say the surge in gold is yet one more reason not to fall for the euphoria of all-time highs in the S&P 500 just yet.
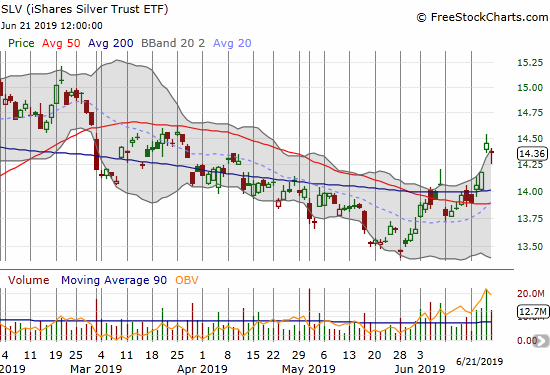
iShares Silver Trust ETF (SLV)
Silver is the poor cousin to gold. The iShares Silver Trust ETF (SLV) is severely lagging GLD, and the silver/gold ratio is at something like a 26-year low. As a result, I have not purchased SLV call options to enhance my core SLV shares in a long time. With SLV confirming a 200DMA breakout, I am looking to try again this week as a cheap easy money Fed play. Note well how SLV LOST 0.6% on Friday despite GLD following through on Thursday’s breakout.
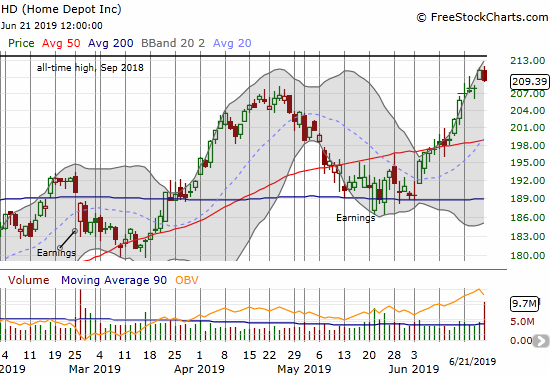
Home Depot (HD)
Incredibly, Home Depot (HD) on Friday fell for just the second time this month. The stock came up short against its all-time high. This is a stock I should have bought on the 50DMA breakout, or even when I included it on the list of bullish stocks a week ago.
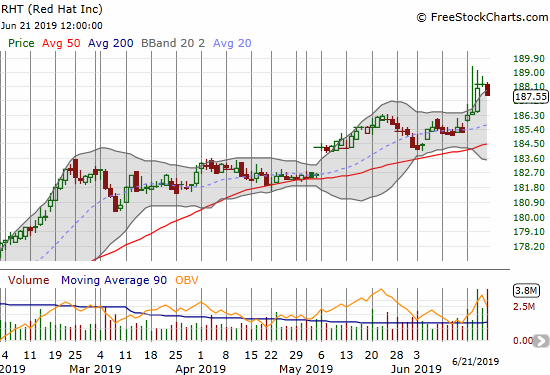
Red Hat (RHT)
My trade in Red Hat (RHT) qualifies as an “oldie but goody” given my emphasis on short-term trades in this blog. After being fortunate enough to own shares in RHT when IBM offered to buy the company for $190/share, I decided to buy a call spread to take advantage of the market’s discounting of the risk of a failed deal. I picked a June call 180/190 spread given the end of June, 2019 target for a deal close.
I did not think the market would drag this out so long. As late as April the stock was still languishing in the low $180s. RHT traded between $170 and $180 shortly after the deal’s announcement. Last week, European regulators signaled their approval of the deal, and the stock finally jumped toward $190. With expiration last Friday, I had to take the profits the market was willing to provide. I still had to settle for less than the full value of the call spread.
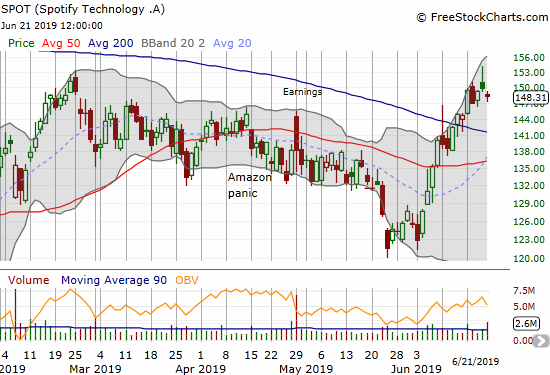
Spotify (SPOT)
Last month, I thought Spotify was well-positioned to retest its December lows. Instead, the stock is now following through on a 200DMA breakout.
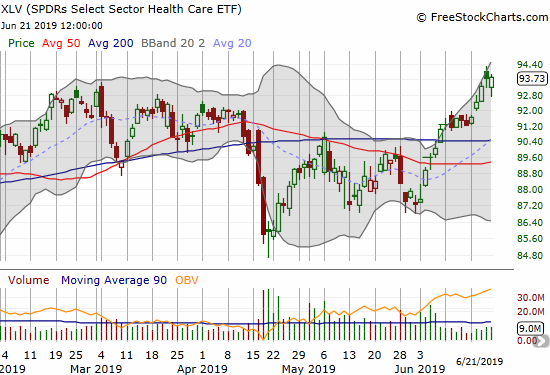
Health Care Select Sector SPDR ETF (XLV)
The Health Care Select Sector SPDR ETF (XLV) has rallied alongside the market in June. My earlier skepticism about the short-term negative impact of the “Medicare for all” or Universal Health Care movement was well-rewarded, but XLV has yet to deliver new dips to buy since then. The mid-May and early June pullbacks were far too shallow to catch my renewed interest. The 200DMA breakout this month forces me to change my strategy. I will look to buy calendar or vertical call spreads with expirations in the late summer or early Fall.
— – —
FOLLOW Dr. Duru’s commentary on financial markets via email, StockTwits, Twitter, and even Instagram!
“Above the 40” uses the percentage of stocks trading above their respective 40-day moving averages (DMAs) to assess the technical health of the stock market and to identify extremes in market sentiment that are likely to reverse. Abbreviated as AT40, Above the 40 is an alternative label for “T2108” which was created by Worden. Learn more about T2108 on my T2108 Resource Page. AT200, or T2107, measures the percentage of stocks trading above their respective 200DMAs.
Active AT40 (T2108) periods: Day #114 over 20%, Day #14 over 30%, Day #7 over 40%, Day #3 over 50% (overperiod), Day #33 under 60% (underperiod), Day #76 under 70%
Daily AT40 (T2108)
")
Black line: AT40 (T2108) (% measured on the right)
Red line: Overbought threshold (70%); Blue line: Oversold threshold (20%)
Weekly AT40 (T2108)

*All charts created using FreeStockCharts unless otherwise stated
The T2108 charts above are my LATEST updates independent of the date of this given AT40 post. For my latest AT40 post click here.
Related links:
The AT40 (T2108) Resource Page
You can follow real-time T2108 commentary on twitter using the #T2108 or #AT40 hashtags. T2108-related trades and other trades are occasionally posted on twitter using the #120trade hashtag.
Be careful out there!
Full disclosure: long AVGO put spread, long GLD, long SPOT put spread, long UVXY calls, long SLV
*Charting notes: FreeStockCharts stock prices are not adjusted for dividends. TradingView.com charts for currencies use Tokyo time as the start of the forex trading day. FreeStockCharts currency charts are based on Eastern U.S. time to define the trading day.