
AT40 = 58.9% of stocks are trading above their respective 40-day moving averages (DMAs)
AT200 = 52.5% of stocks are trading above their respective 200DMAs
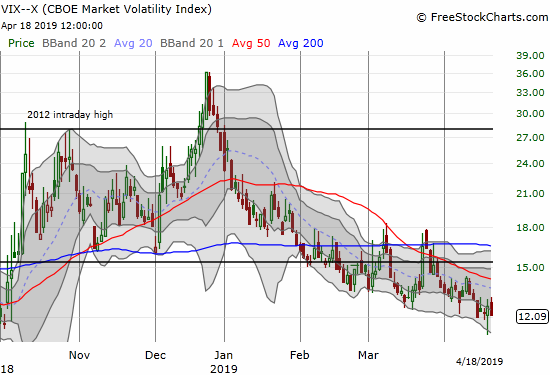
VIX = 12.1
Short-term Trading Call: bearish
Stock Market Commentary
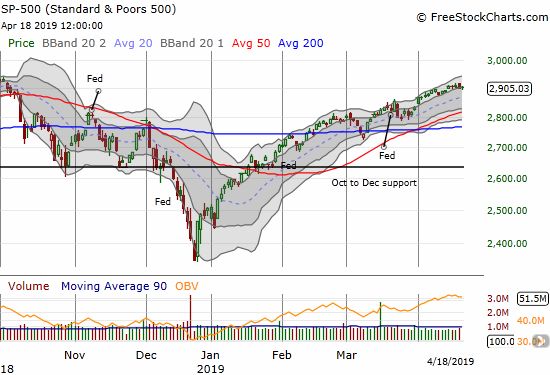
The S&P 500 (SPY) ended the previous week looking ready to lunge for its all-time high. Surprisingly, buyers decided to take a rest, and the index went absolutely nowhere during the holiday-shortened week. Now the index looks just as likely to resume its rise through the upper Bollinger Band (BB) trading channel or to drop out of the channel. This rally off the December bottom has motored along with just the briefest of pauses; so while buyers are showing some signs of exhaustion, they are still getting a pass from clearly reluctant sellers.
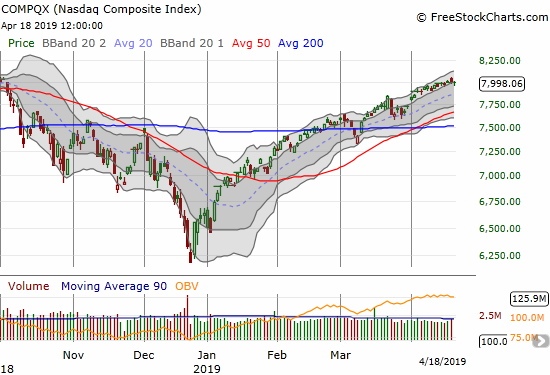
The NASDAQ (NDX) also has the slightest look of exhaustion.
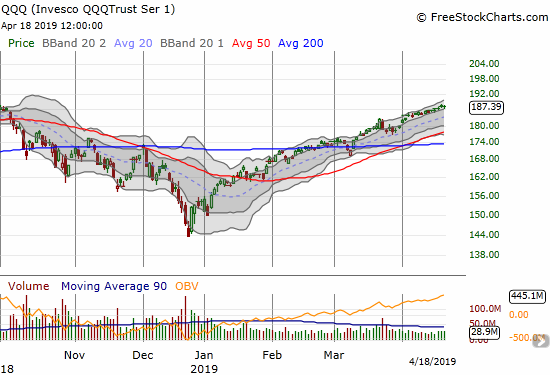
Big cap tech was a “headliner” as the Invesco QQQ Trust (QQQ) trickled its way to an all-time high. QQQ reached this milestone in a very subdued way, but it was the key index signalling that the buyers might still be ready to push through their exhaustion in the coming week. Indeed, TalkMarkets contributor Andres Cardenal found that a new 2-year high for QQQ in the last 6 months tends to bode well for the S&P 500 (since 1989).
AT40 (T2108), the percentage of stocks trading above their respective 40-day moving averages (DMAs), is showing some of the market’s overall buying exhaustion. While the S&P 500 went nowhere for the week, AT40 dripped lower each day of the week. AT40 closed the prior week at 65.3% and ended last week at 58.9%. This pullback from the overbought threshold of 70% is technically a bearish setup, especially with the bearish divergence from the S&P 500. This setup is yet one more confirmation of my short-term bearish trading call. Yet, as has been clear for weeks now, this bearishness is still not the dominant theme of the market given the general reluctance of sellers to establish strong setups.
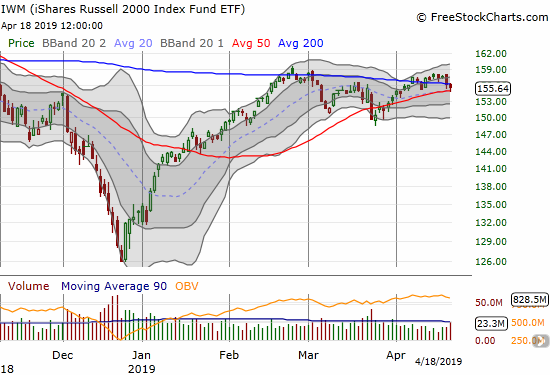
When I last loaded up on call options as a hedge on a quick market comeback, I picked the iShares Russell 2000 ETF (IWM). That move worked out as a 200DMA breakdown turned immediately into a fresh breakout. Another hint of exhaustion showed up on this index of small caps as IWM closed the week below its 200DMA again. The low of the day on Thursday was right at 50DMA support. On Monday, I will be targeting another fistful of call options as a hedge against buyers working through the current exhaustion.
The volatility index, the VIX, jumped on Wednesday, but faders went right back to work on Thursday. The VIX is showing hints of bottoming consistent with buyer exhaustion. A close below Wednesday’s intraday low will invalidate the setup. My last tranche of call options on the Ultra VIX Short-Term Futures ETF (UVXY) expired harmless, but I still rolled into a fresh tranche expiring in two weeks. Long volatility is very cheap right now, so the risk/reward is good given my on-going bearish short-term trading call. I will end this latest long volatility routine if AT40 flips overbought.
Given the stock market supplies a steady stream of individual bearish and bullish stock plays no matter the short-term technical setups, I am clarifying my section on stock chart reviews by dividing them into bearish and bullish setups. This division will also help me see more clearly whether I am more attracted to bearish or bullish setups. Today’s edition features a LOT more bullish setups!
Stock Chart Reviews – Bearish
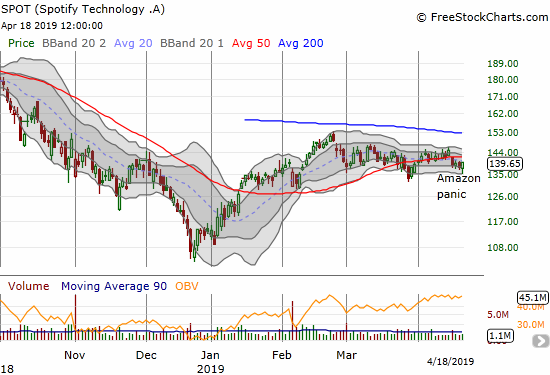
Spotify (SPOT)
Spotify (SPOT) is the latest victim of “Amazon panic.” Amazon (AMZN) launched a free music-streaming service, and the news sent SPOT down about 5% on the day. I am still as bearish on SPOT as I was on Pandora during its hype days as a publicly-traded company. Still, I did not chase SPOT on this news because I fully recognize episodes of Amazon panic quickly exhaust sellers. I am going to continue to wait for a better entry for a fresh short (like a test of 200DMA resistance).
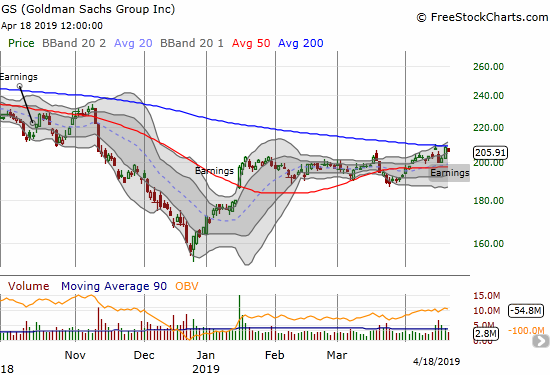
Goldman Sachs (GS)
I held my short in Goldman Sachs (GS) through earnings and felt vindicated when the stock gapped away from 200DMA resistance. Buyers stepped in after that and took the stock right back to 200DMA resistance. If even GS finally breaks out above 200DMA resistance, I will have to assume the general stock market will drive higher to overbought conditions.
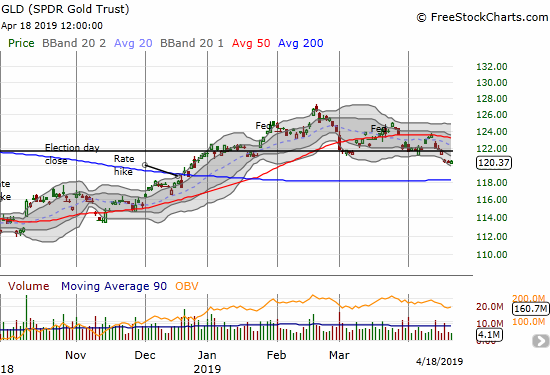
SPDR Gold Trust (GLD)
SPDR Gold Trust (GLD) has been a surprising disappointment given the dovish Federal Reserve. GLD has bearishly printed lower highs and lower lows since the February high; the presumed support from the 2016 election day close even gave way. A test of 200DMA support is in play. I will load up on a fresh set of call options if GLD somehow survives that test.
Stock Chart Reviews – Bullish
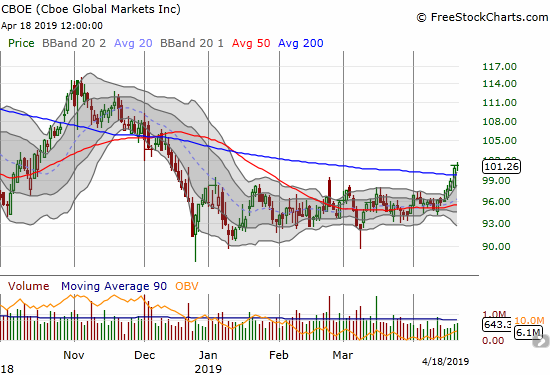
Cboe Global Markets (CBOE)
Cboe Global Markets (CBOE) is a longer-term position that has managed to stay in the red for most of my time holding it. The stock held a tight consolidation range since the December bottom. Last week’s 200DMA breakout is a bit stretched but Thursday’s confirmation gives me the green light to add to my position. Given CBOE is supposed to be a play on increased market volatility, I have no hesitation in building a larger position here.
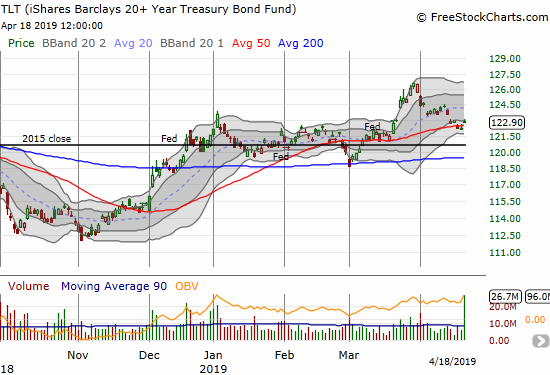
iShares 20+ Year Treasury Bond ETF (TLT)
The iShares 20+ Year Treasury Bond ETF (TLT) dipped briefly below 50DMA support last week. I bought the small breakout on Thursday. Given the main reason for the market’s recovery this year is a reliance on a dovish Federal Reserve, going long TLT is now the right hedge for my short-term bearish call. If rates continue upward (TLT downward), the stock market rally should come to an end sooner than later. There is an ironic double-bonus here as TLT should soar if the market follows-through on the bearish signals I am monitoring ahead of a resumption of a rally in rates.
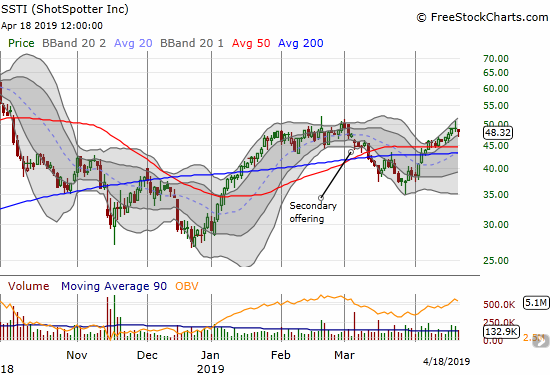
ShotSpotter (SSTI)
ShotSpotter (SSTI) is one of my few long-term bullish positions; it is a core holding I hope to be able to keep for years to come. In mid-March I worried that a secondary would put a lasting dent in the stock’s price trajectory. The stock experienced an initial recovery in the wake of a company presentation at the 31st annual ROTH Conference. (I had planned to do a summary of the presentation, but no new news or guidance was revealed. The slides are easy to review). After a brief resumption of selling, the stock bottomed and even broke out above its 50DMA again. Last week the stock challenged its high for the year.
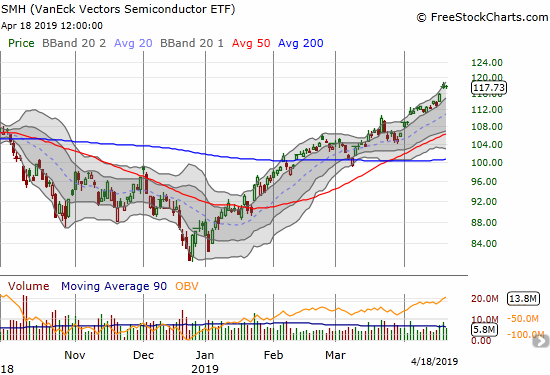
The VanEck Vectors Semiconductor ETF (SMH)
The VanEck Vectors Semiconductor ETF (SMH) is carrying the bullish banner for the market right now. Thanks largely to Qualcomm (QCOM), SMH gapped up on Wednesday to a new all-time high. Notably, SMH is not just dribbling higher like the major indices.
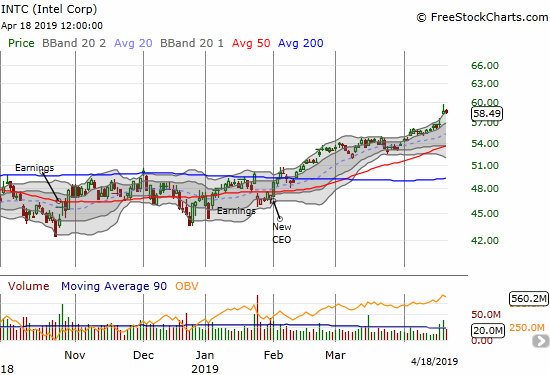
Intel (INTC)
Intel (INTC) is one of those few stocks I keep locked into a recurring bullish trading strategy. I load up on call options on INTC between earnings. I bought the last tranche when INTC dipped to the bottom of its lower Bollinger Band. The stock’s progress was so slow for the first two weeks of April, I thought I would have to take a loss. The breakout on Tuesday gave me a great profit-taking opportunity. While I missed out on Wednesday’s monster move, I have no regrets since I could not foresee this move sympathetic with the QCOM vs Apple (AAPL) settlement. Now I wait for the next earnings report…
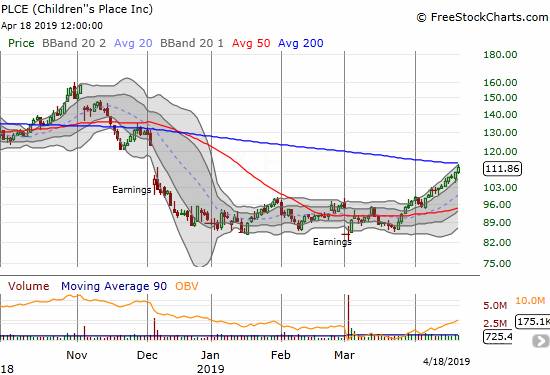
Children’s Place (PLCE)
“Something” is going on with Children’s Place (PLCE). The stock has been one of a select crew of stocks steadily pushing higher through its upper-BB all month. PLCE ended the week challenging 200DMA resistance. Note I took profits on my last PLCE call options well ahead of this moment. Needless to say, I will consider a 200DMA breakout to be one more bullish confirmation for PLCE.
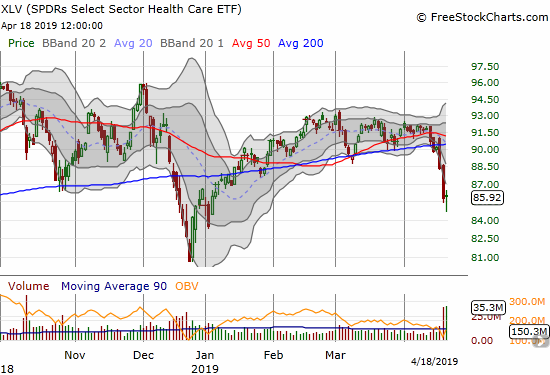
Health Care Select Sector SPDR ETF (XLV)
The Health Care Select Sector SPDR ETF (XLV) was slammed last week on fears of “Medicare for all” or Universal Health Care. While the 200DMA breakdown is convincingly bearish, I think the selling is quite premature and borderline panic. I decided to buy a bunch of May $88 call options as a play on a rebound to 200DMA resistance. Depending on how that trade works out, I will not hesitate to flip to puts if the 200DMA holds as a resistance.
I also bought some shares of Anthem (ANTM) for a longer-term play. I plan to continue building a position at least into the 2020 presidential election.
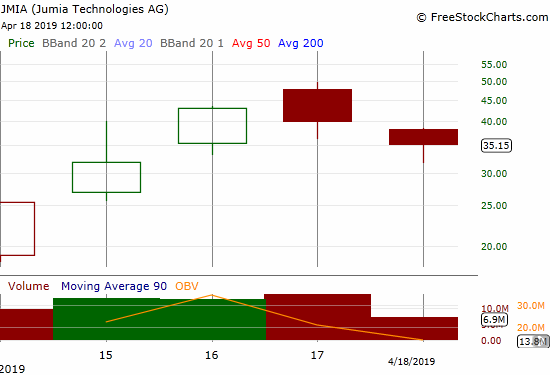
Jumia Technologies (JMIA)
Jumia Technologies (JMIA) is a promising company serving as the “Amazon of Africa.” I had the opportunity to use it in Ghana last summer, and I understand its potential despite its substantial operational challenges. I wanted to try for the IPO but missed the deadline. So instead I just watched in dismay as the stock soared from its open at $18.95 to an intraday high of $49.77 on Wednesday.
With yet more IPOs coming from the likes of Zoom Technologies (ZM) and Pinterest (PINS), I figured the hot money would drain from JMIA and chase its next targets. Before I could even think to act on my short-term trade idea, JMIA was already down 10% from its intraday high. I went right back to watch mode, not wanting to chase a short position downward. With the stock down as much as 17% on Thursday, I held my nose and went back into buying mode. This is one more longer-term play, and I actually hope to get more shares at lower prices (which SHOULD come if the general market ever fully acts on my short-term bearish trading call!).
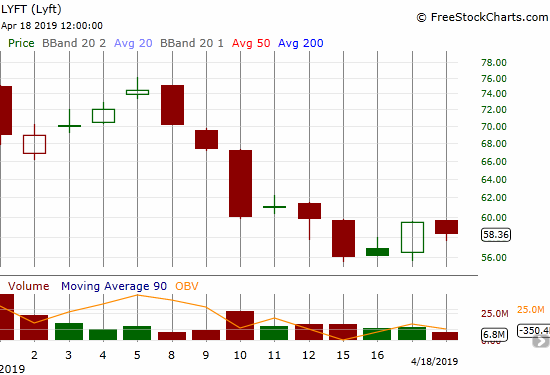
Lyft (LYFT)
Lyft (LYFT) ended the week without setting a new post-IPO low. Buyers were finally able to keep the stock off those lows. It will be interesting to see whether the stock can actually stabilize in the face of the coming onslaught of IPOs including Uber.
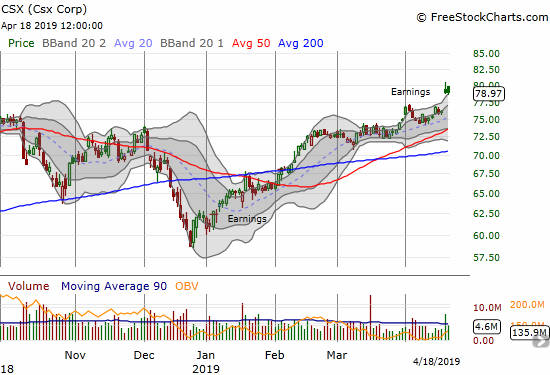
Csx (CSX)
I definitely feel “cognitive dissonance” when I keep seeing stocks like Csx (CSX) as I cling to a short-term bearish outlook. CSX printed an all-time high last week in the wake of a well-received earnings report.
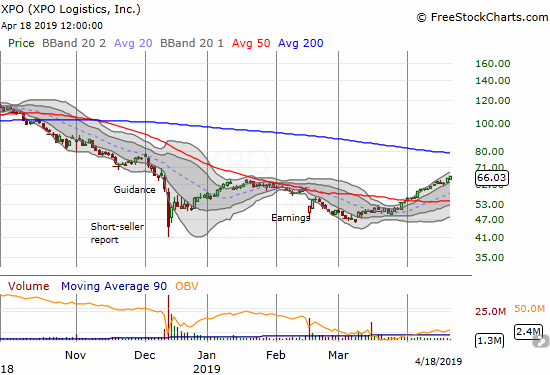
XPO Logisitics (XPO)
XPO Logisitics (XPO) was an irresistible trading opportunity. The first round ended at 50DMA resistance in January. This next round ended porfitably as well, but I left a lot on the table. XPO broke out above its 50DMA and just kept rising through its upper-BB channel. On Thursday the market called away my shares from a covered call position I put on with a $55 strike.
With XPO finally reversing December’s damage from guidance and a short-seller attack, the stock could easily make a run to 200DMA resistance. I am content to wait to see what happens with May 1st earnings. However the call options sure look too cheap to resist. For example, the May 17 $70 call closed at $1.85/$2.00. With the August $70 call option selling for $4.70/$4.90, the stock looks like a good candidate for a calendar call spread…assuming I am correct about an eventual test of 200DMA resistance.
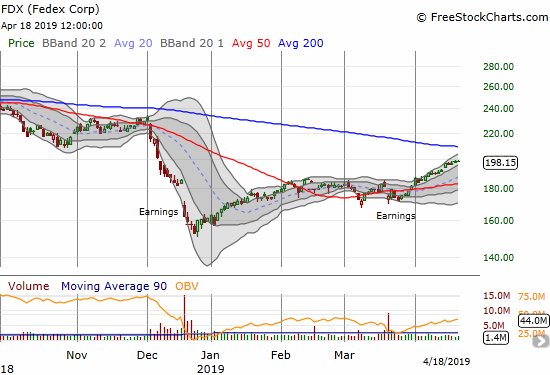
FedEx (FDX)
FedEx (FDX) is also steadily recovering from its own December disaster. A test of 200DMA resistance is in play. Clearly transportation and logistics plays are on the move.
— – —
FOLLOW Dr. Duru’s commentary on financial markets via email, StockTwits, Twitter, and even Instagram!
“Above the 40” uses the percentage of stocks trading above their respective 40-day moving averages (DMAs) to assess the technical health of the stock market and to identify extremes in market sentiment that are likely to reverse. Abbreviated as AT40, Above the 40 is an alternative label for “T2108” which was created by Worden. Learn more about T2108 on my T2108 Resource Page. AT200, or T2107, measures the percentage of stocks trading above their respective 200DMAs.
Active AT40 (T2108) periods: Day #73 over 20%, Day #71 over 30%, Day #70 over 40%, Day #15 over 50% (overperiod), Day #2 under 60% (underperiod), Day #32 under 70%
Daily AT40 (T2108)
")
Black line: AT40 (T2108) (% measured on the right)
Red line: Overbought threshold (70%); Blue line: Oversold threshold (20%)
Weekly AT40 (T2108)

*All charts created using FreeStockCharts unless otherwise stated
The T2108 charts above are my LATEST updates independent of the date of this given AT40 post. For my latest AT40 post click here.
Related links:
The AT40 (T2108) Resource Page
You can follow real-time T2108 commentary on twitter using the #T2108 or #AT40 hashtags. T2108-related trades and other trades are occasionally posted on twitter using the #120trade hashtag.
Be careful out there!
Full disclosure: long UVXY calls, long LYFT calls and short LYFT puts, long XLV calls, long ANTM, long JMIA, long SSTI, long TLT calls, long CBOE, long GLD, short GS
*Charting notes: FreeStockCharts stock prices are not adjusted for dividends. TradingView.com charts for currencies use Tokyo time as the start of the forex trading day. FreeStockCharts currency charts are based on Eastern U.S. time to define the trading day.