

The Market Breadth Summary
- The bears lose momentum as buyers reversed a shallow early-week pullback and pushed major indices back toward all-time highs despite deteriorating market breadth.
- AI-related stocks, semiconductor shares, and cybersecurity leaders regained leadership and made a broadly bearish stance difficult to sustain.
- Still, the S&P 500 and Russell 2000 formed tentative double-top patterns after sharp V-shaped recoveries from 20DMA support zones and market breadth is still in a downtrend.
- Upcoming IPOs from SpaceX and potentially OpenAI remain a major macro overhang because investors may need to rotate capital out of existing equities to fund new positions.
- Yet, the VIX is losing a key support level, signaling that bulls could press stocks through the latest headwinds.
The Stock Market Indices
Early in the week, the market looked ready to confirm a deeper bearish phase as market breadth broke down and selling accelerated. I felt validated in my bearish call for the first two days of the week. However, the bears quickly lost the narrative from there. Buyers broadly stepped in and reversed the tone of the market.
The market’s reactions to headlines from the Iran war were the most intriguing component of the shallow pullback. Stocks seemed to respond positively to every headline suggesting an imminent deal to end the war or an opening of the Strait of Hormuz. In my bearish thesis, I assumed that the market stopped caring about the war and already priced in an end to the war. The positive reaction to the same headlines we have seen since the ceasefire declared on April 8th, and the positive reaction despite few results, suggests that the market could still rally aggressively once the news is real.
While geopolitical fears continue to fade and I am backtracking on my recent bearish call, I still see a major overhang to come in the stock market from trillions of dollars worth of IPOs from SpaceX, OpenAI, and maybe Anthropic. Fully invested investors will have to sell something to make room to chase these new issues, especially after they get added to the NASDAQ due to their size. Thus, the market reaction to the SpaceX IPO in mid-June will be very telling. The prospectus presents a company that is essentially uninvestable. It is a meme stock waiting for its fans. Here are some choice observations from Prof G Markets With Ed Nelson in “SpaceX Just Filed to IPO — The Numbers Are Ugly” interviewing Patrick Boyle:
- Elon Musk will hold 85% of the voting shares
- An IPO for the Musk fan
- A reminder that Musk once claimed he would not take SpaceX public until it developed a colony on Mars.
- SpaceX has lost $37B and venture investors are likely tiring of pouring money into the company
- SpaceX is a money furnace
(See a detailed critique on the SpaceX IPO on YouTube)
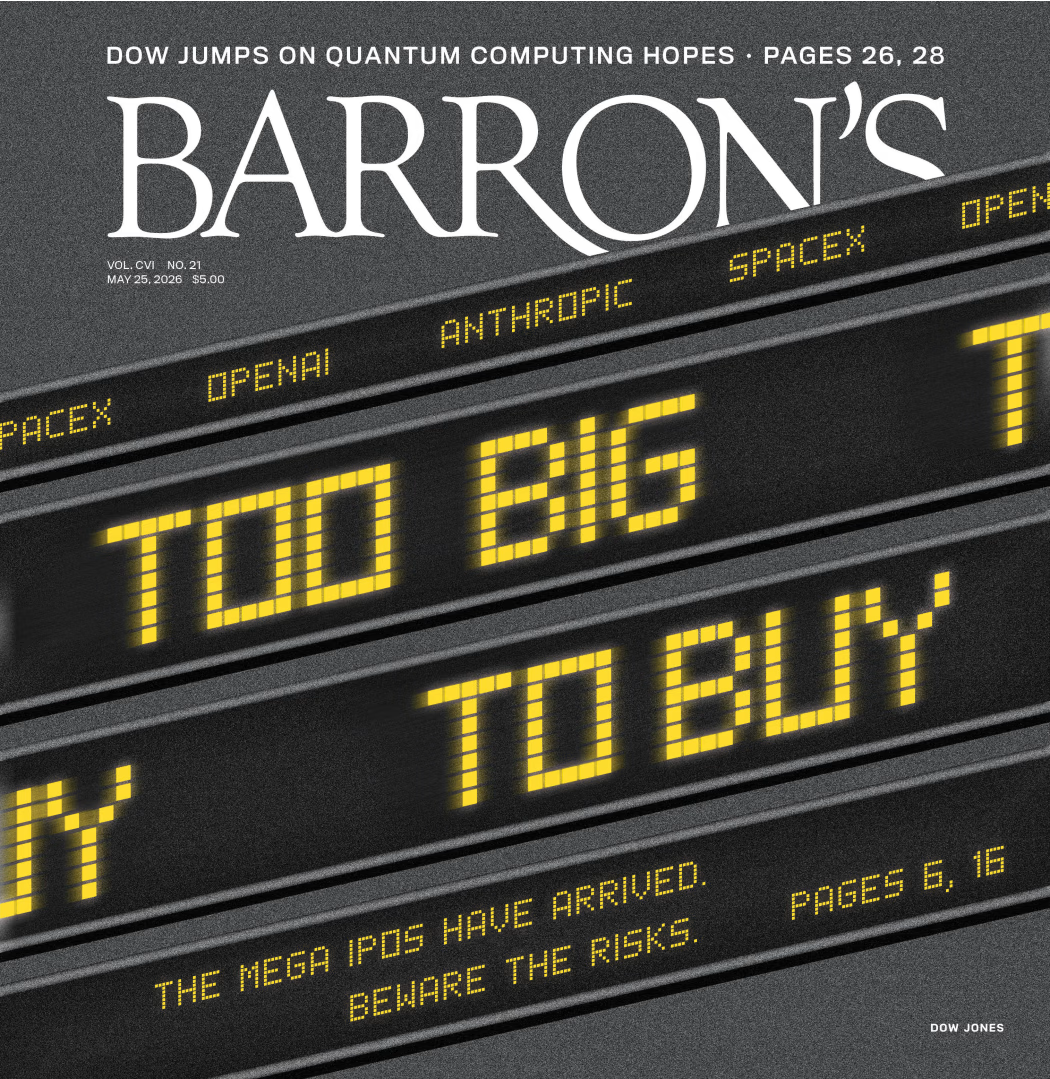
Even if the general market rolls right through the SpaceX IPO, the OpenAI IPO (reportedly coming in September) could be the event that breaks the backs of eager buyers. Thus I will be back on market top watch in mid-June and/or September. The major fade in the Cerebras Systems (CBRS) IPO is an early warning sign. On Friday, I even shorted a small amount of shares at $170.
Anyway, at the index level, the rebounds were impressive. However, the rallies still stopped short of important resistance levels formed by all-time highs. The AI trade led the way again and returned with force. Semiconductor stocks, cybersecurity stocks, and AI-related ETFs all surged. That strength made it increasingly difficult to stay broadly bearish on the market, even while several rallies still looked stretched and vulnerable to sharp reversals.
S&P 500 (SPY)
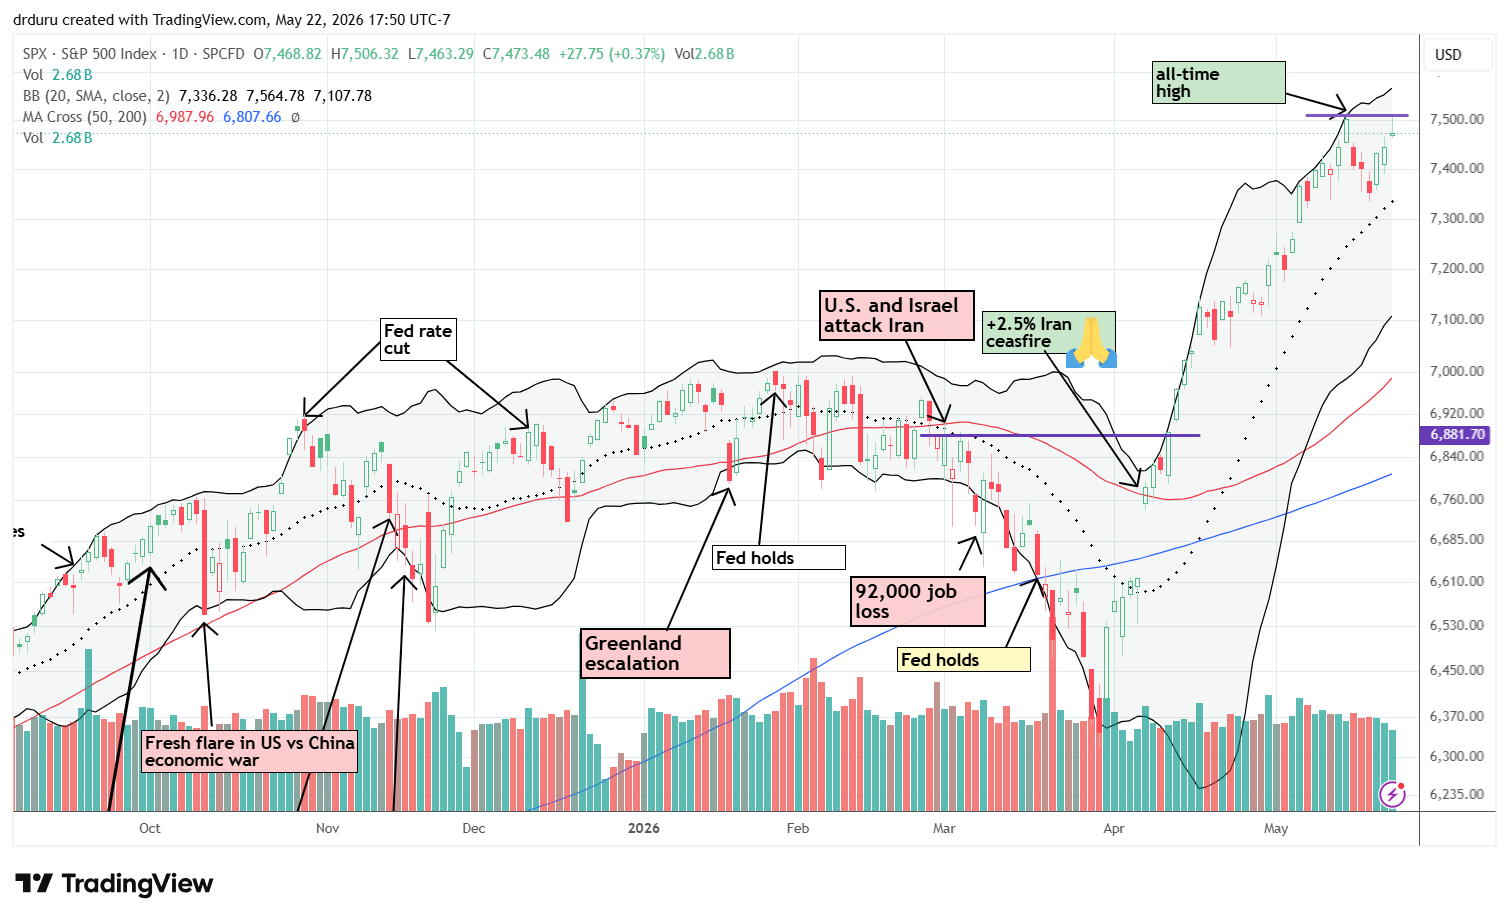
The S&P 500 looked ready to test uptrending support at the 20-day moving average (DMA) (dotted line). After three days of selling pressure, buyers stepped in and pushed the index higher in a shallow V-shape. However, the rally faded directly from the prior intraday all-time high, a move which raised the prospect of a double-top.
NASDAQ (COMPQ)
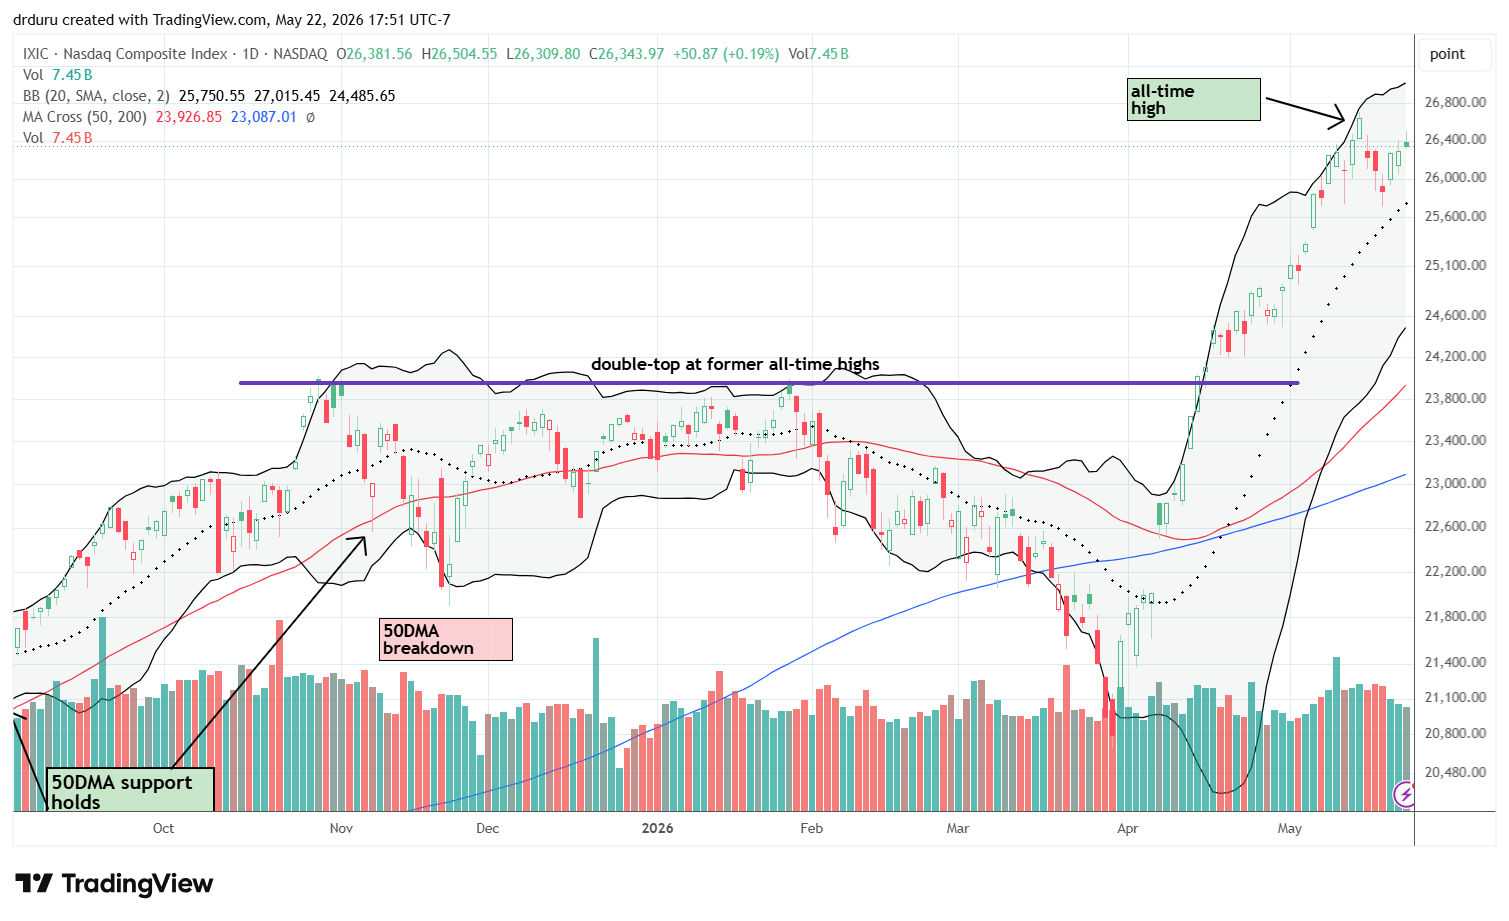
The NASDAQ staged a rebound similar to the S&P 500’s. The tech-laden index also looked ready to test 20DMA support. Yet, the NASDAQ stopped far short of testing its all-time high. I was surprised by the relative underperformance since AI-related trades seemed to reenergize the bulls.
iShares Russell 2000 ETF (IWM)
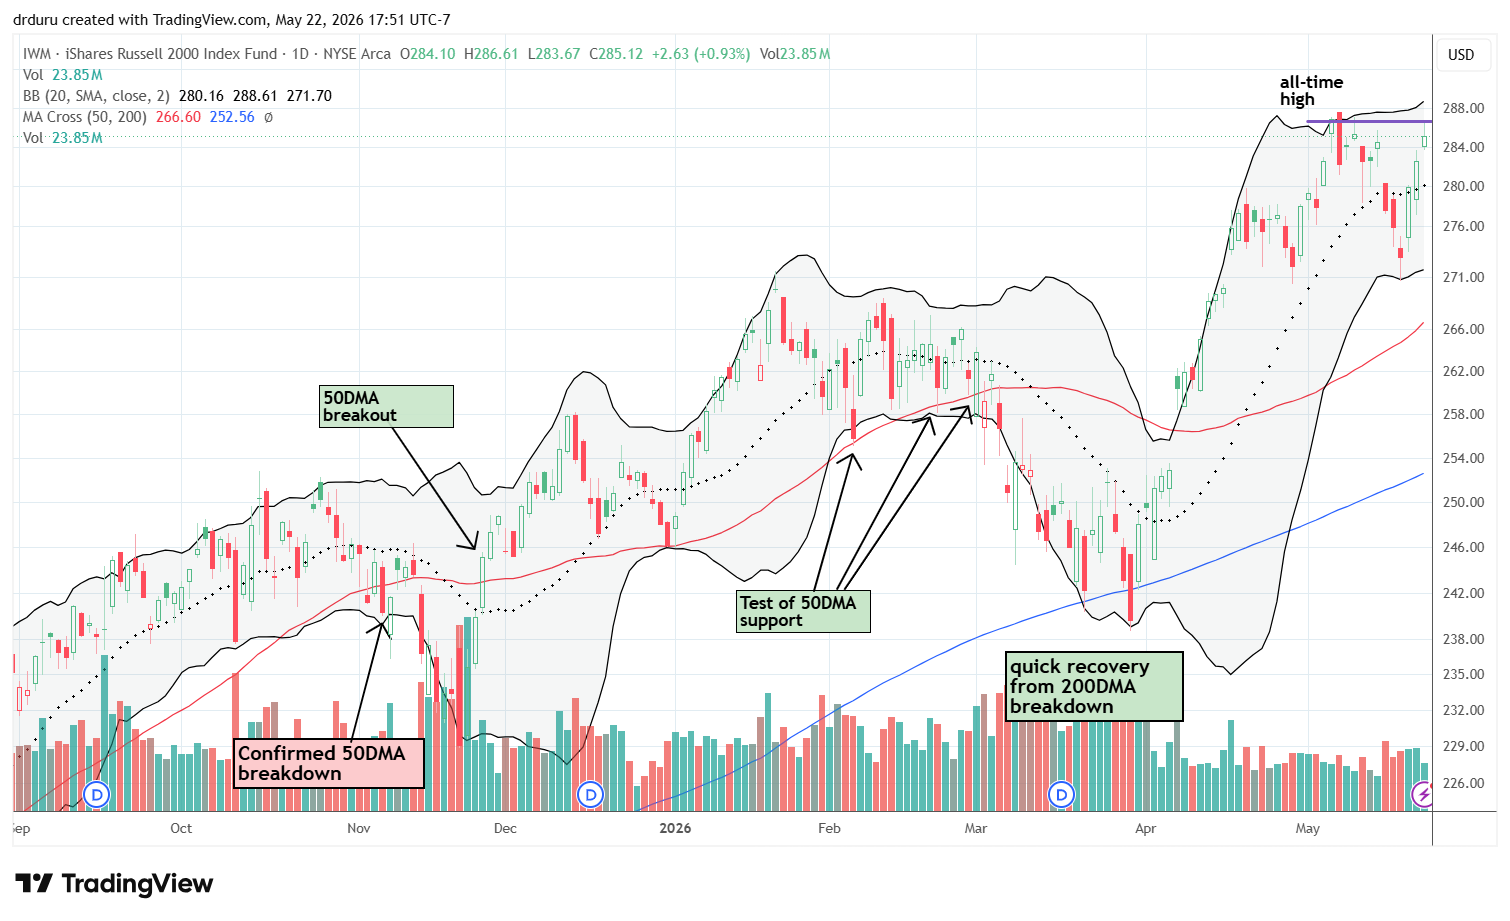
IWM delivered the steepest V-shaped recovery. IWM sliced right through 20DMA support on the way to tapping its lower Bollinger Band (BB). Yet, just like the S&P 500, IWM faded intraday from its all-time high. Buyers now need to invalidate a double-top formation.
My regular IWM trade was one of the several positions I thought would get crushed thanks to what seemed like an untimely buy just ahead of my bearish call on the market. I was surprised that my IWM weekly calendar call spread at the $285 strike was not a complete loss at Tuesday’s low. Sensing the market anticipating higher prices, I took a chance and doubled up on my IWM shares. As a result, I profited on the shares and options on IWM’s sharp rebound. I go into the coming week awaiting IWM’s next moves.
The Short-Term Trading As Bears Lose
- AT50 (MMFI) = 57.2% of stocks are trading above their respective 50-day moving averages
- AT200 (MMTH) = 53.6% of stocks are trading above their respective 200-day moving averages
- Short-term Trading Call: neutral
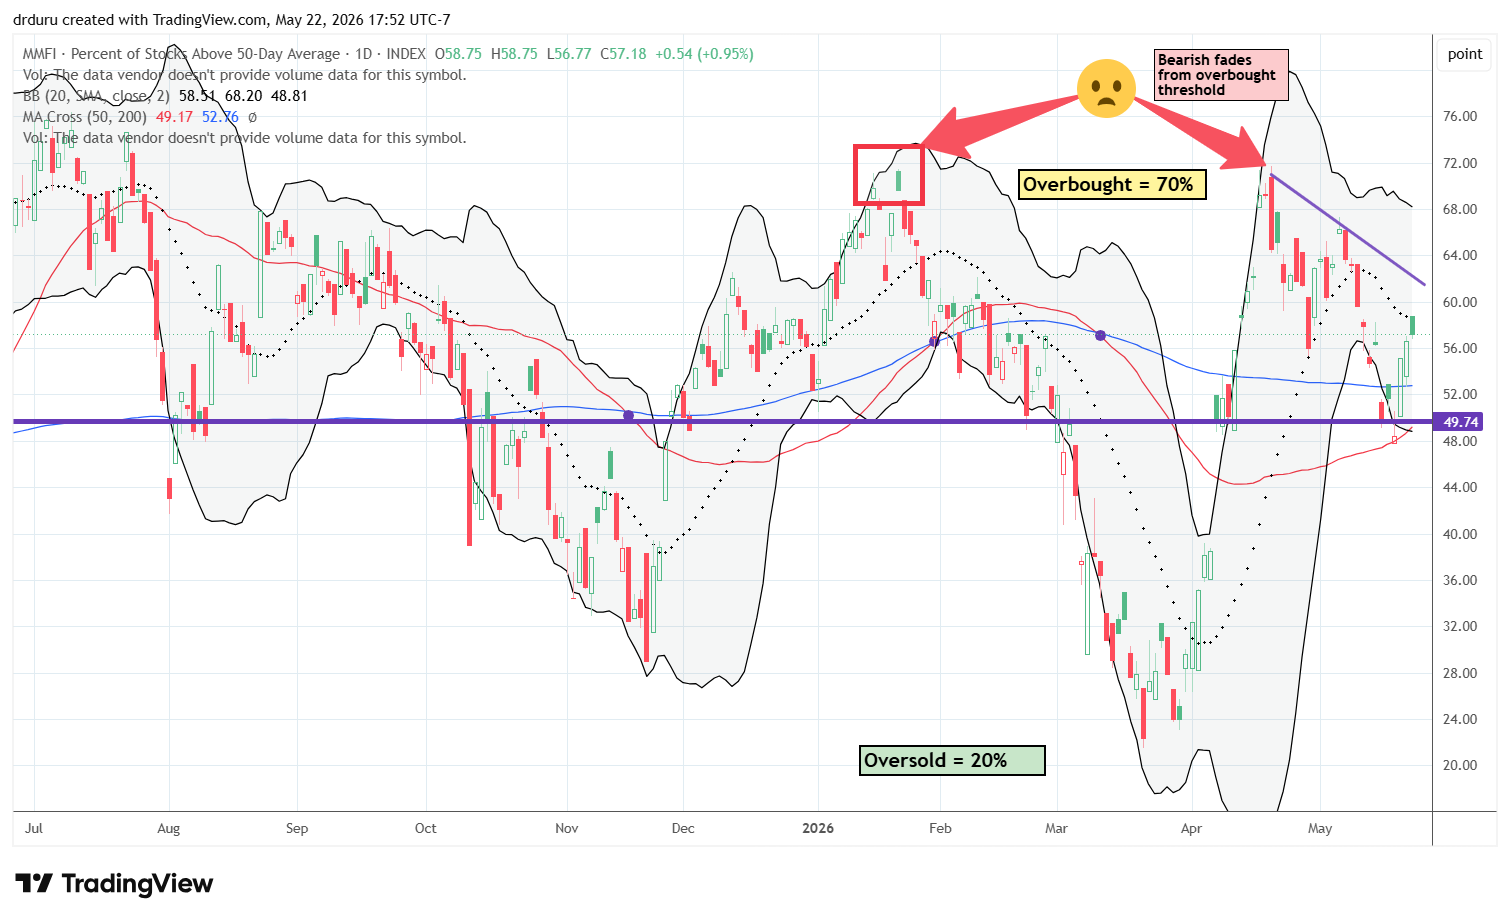
AT50 (MMFI), the percentage of stocks trading above their respective 50DMAs, closed the week at 57.2%. My favorite technical indicator fell to 48.4% on Tuesday. That close below presumed support from the April 8th breakout convinced me that the bears were getting a firmer grip on the trading action. The rebound from there showed broad buyer interest in the market, but the downtrend remains in place (see the purple line in the chart below). Thus, while I am willing to retreat from my short-term cautiously bearish trading call, I am only moving back to a neutral stance. There is no point in revisiting the bearish trading call until the 20DMA breaks as support for the S&P 500.
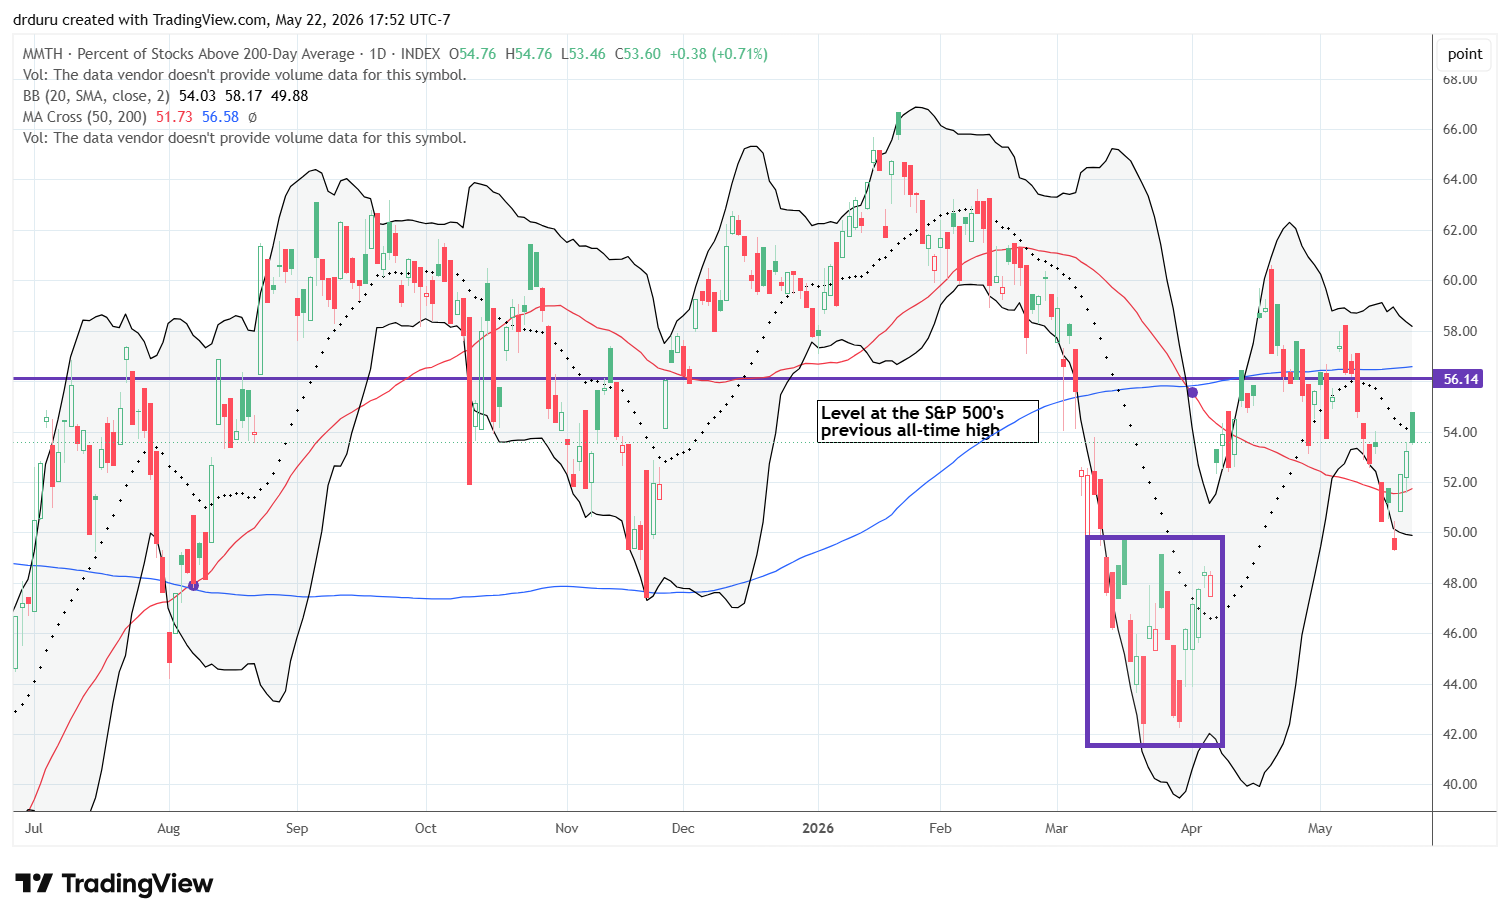
At its lows on Tuesday, AT200, the percentage of stocks trading above their 200DMAs, closed at 49.3%. At that level, this longer-term indicator of the health of market breadth entered the box which I cast as a confirmation of bearishness. The sharp rebound from there symbolized how fast bears lost the market narrative.
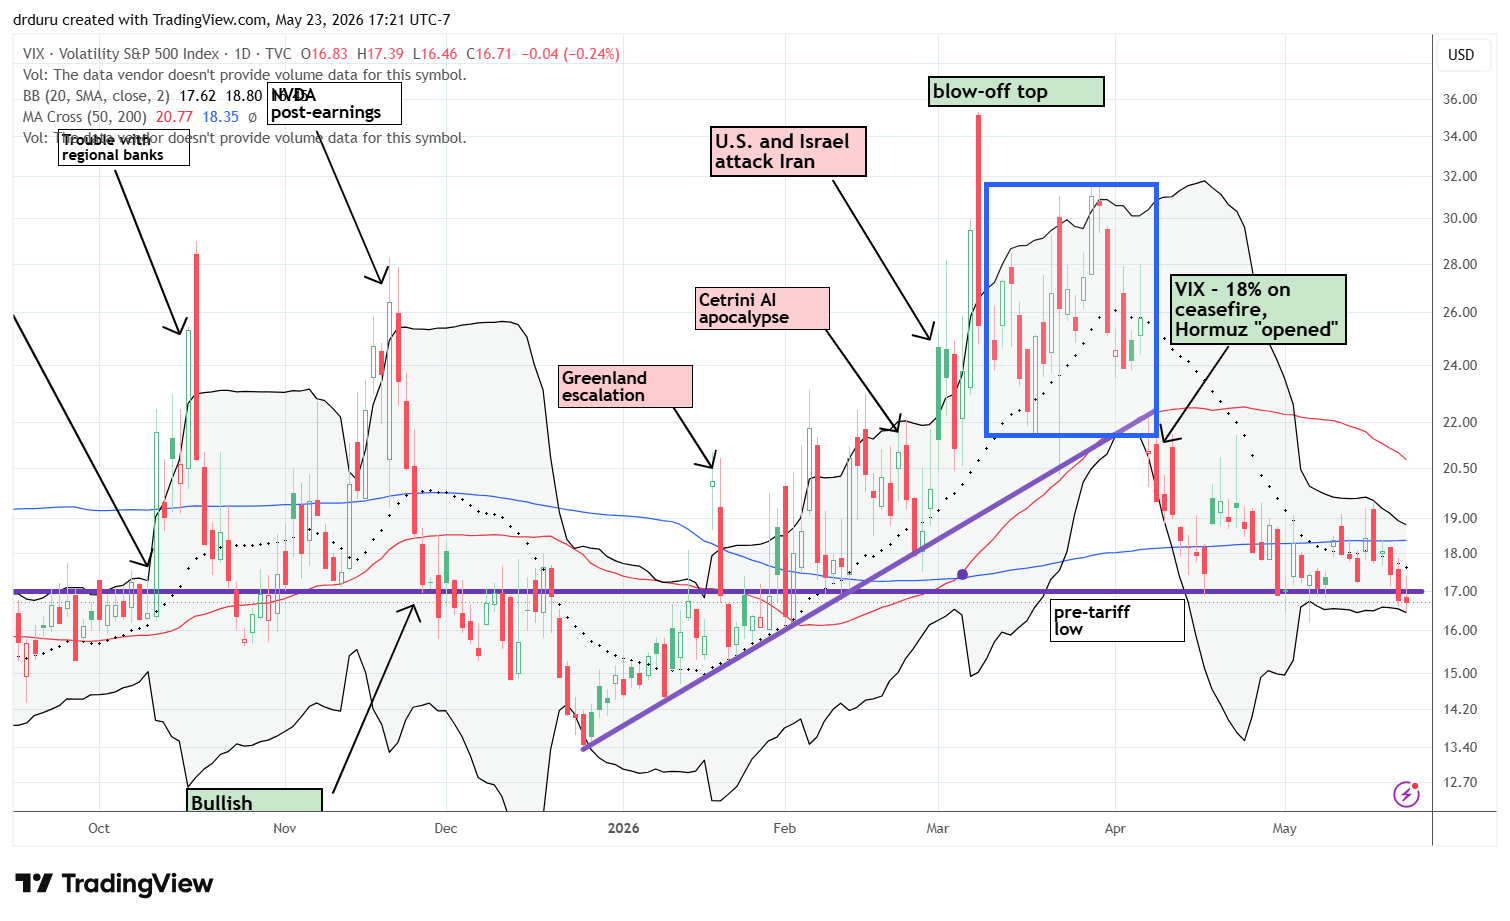
The volatility index (VIX) started the week with a gap higher and a sharp fade. Accordingly, the bears technically started to lose the narrative from the VIX highs on Monday. On Thursday, the VIX closed below its support from the pre-tariff low for the first time since early February. A stronger push to the downside would fully hand the reins of the market back to the bulls.
In case you missed it…
Long-suffering investors in the Figma (FIG) IPO may finally get a bearish to bullish reversal..
The Equities
TJX Companies (TJX)
Description: TJX Companies operates off-price retail stores including T.J. Maxx, Marshalls, and HomeGoods.
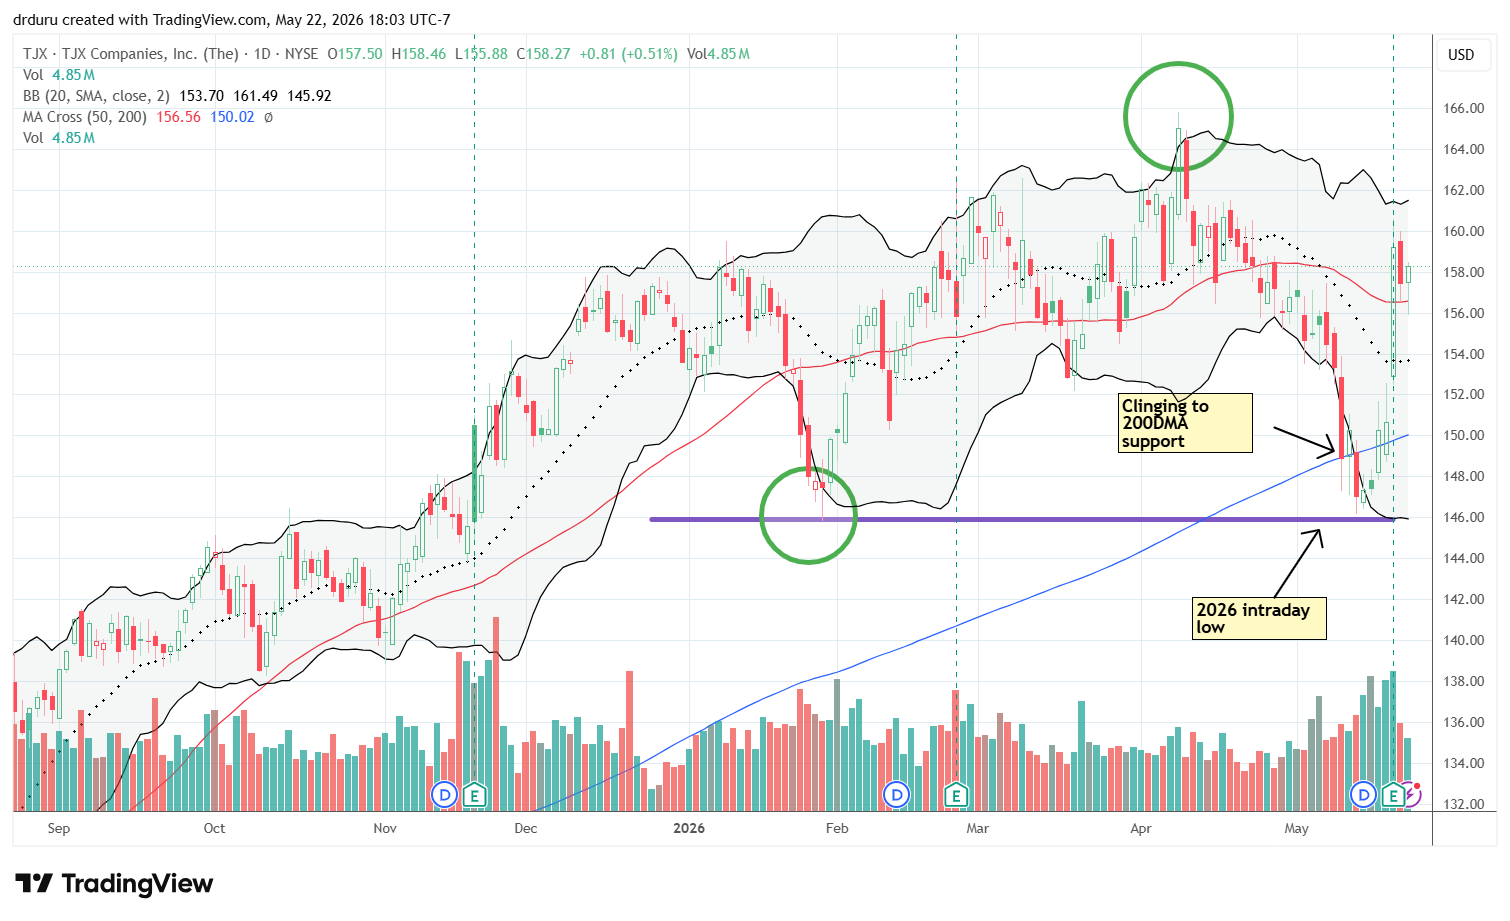
Technical status: TJX Companies Inc (TJX) rapidly broke out above its 200DMA, 20DMA, and 50DMA after a 5.7% post-earnings jump.
Trade commentary: TJX was sitting as the last soldier at the front lines for retail. If you were laser focused on the stock, congratulations because the setup was extremely clean on the test of support at the 2026 intraday low. Buyers stepped in immediately and the earnings reaction added another 5.7%. However, sellers returned the next day, so TJX looks like it will continue its pattern of rangebound churn this year.
Walmart (WMT)
Description: Walmart operates retail stores and e-commerce platforms that sell groceries, consumer goods, and household products.
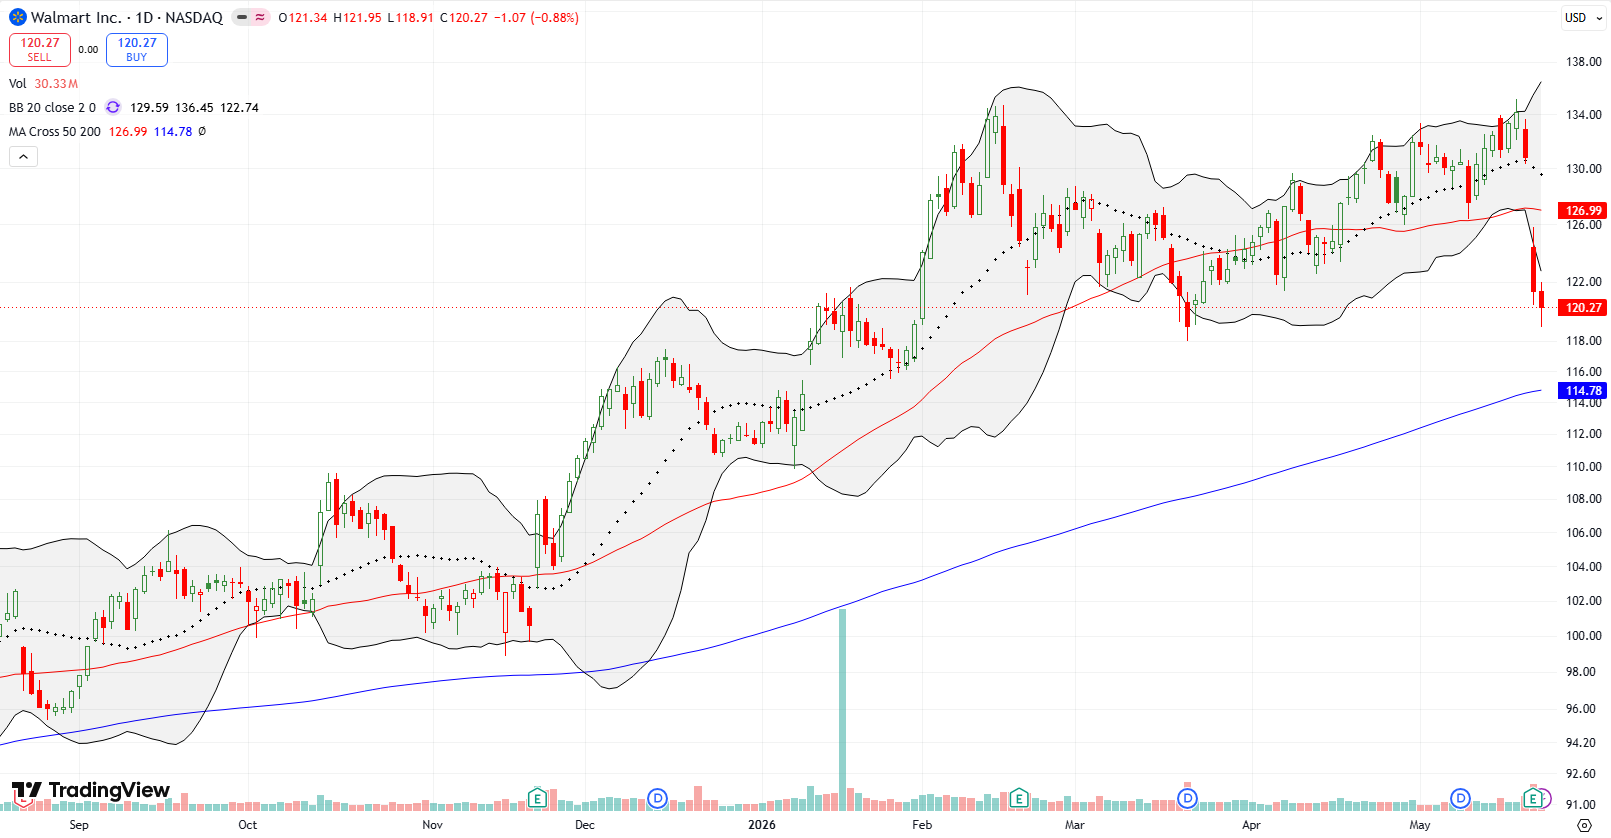
Technical status: Walmart Inc (WMT) broke down below its 50DMA after a 7.3% post-earnings tumble, also falling below its lower Bollinger Band.
Trade commentary: Walmart has behaved like a tech stock since its breakout in early 2024, more than doubling during a period when investors supposedly feared weakness in the consumer economy. Expectations were naturally high going into last week’s earnings, so the news needed to be perfect. The earnings news was not terrible, but it was also not perfect. In particular, Walmart observed:
“We see with our customers that the high income customer is spending with confidence into many categories, while the lower income consumer is more budget conscious and perhaps navigating financial distress. And I’ll give you an example. Like we have a large fuel business and we see that in the most recent period, the number of gallons that customers fill up with when they come to our fuel stations fell below 10 for the first time since 2022. That’s an indication of stress. And so certainly as you look at quarter-over-quarter incremental pressure, that’s one of the areas that I would call out.”
I am not interested in shorting WMT, but the bearish breakdown in one of retail’s strongest leaders is worth watching carefully. Support at the uptrending 200DMA (the blue line) now needs to hold.
Target Corporation (TGT)
Description: Target operates discount retail stores offering consumer goods, groceries, apparel, and household products.
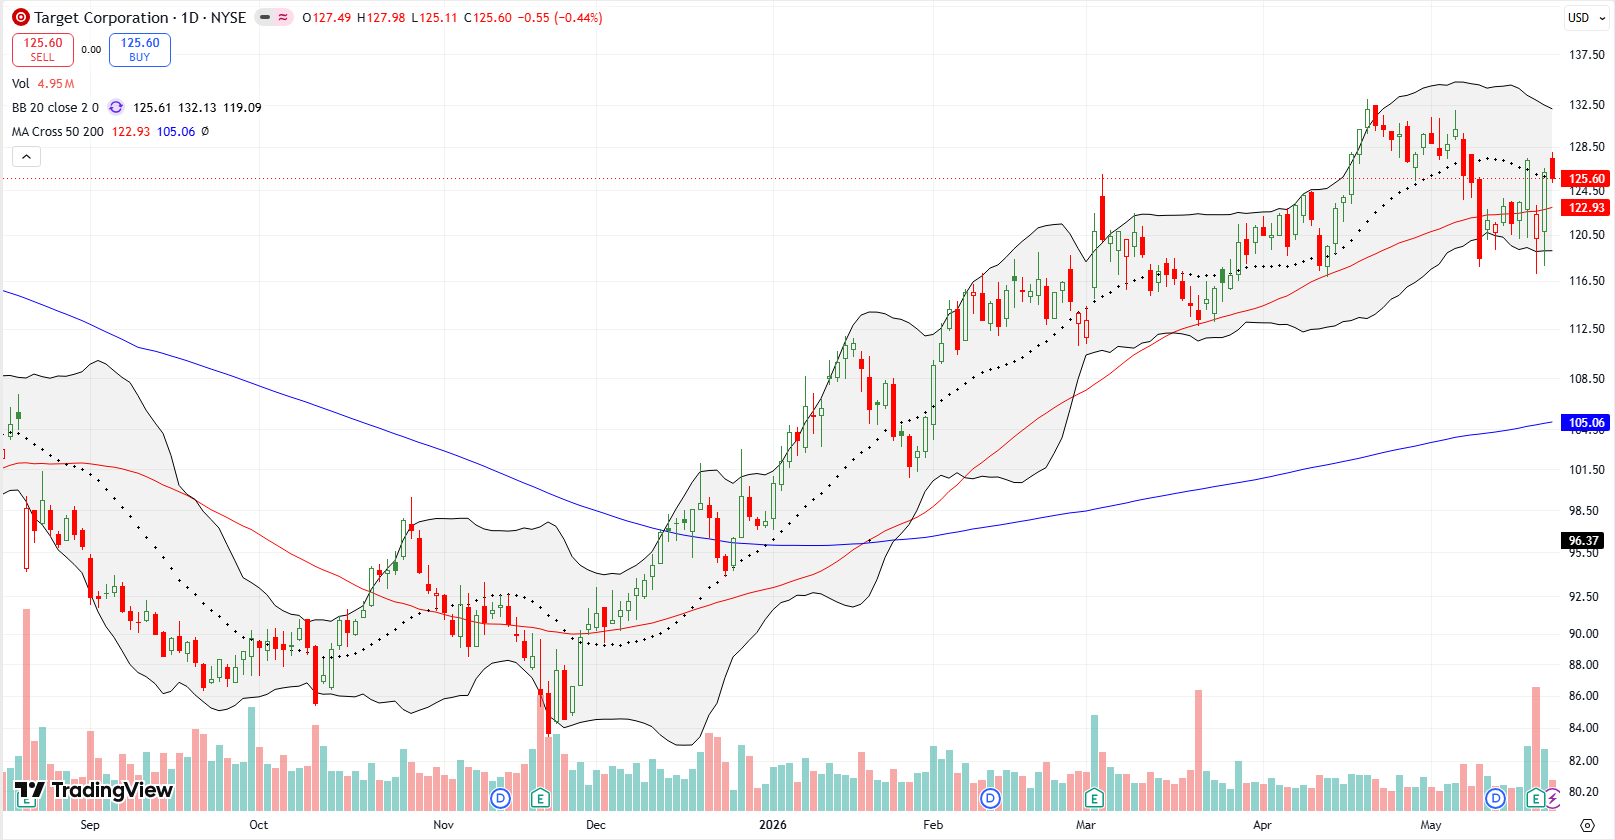
Technical status: Target Corp (TGT) churned around its 50DMA before rising out above its 20DMA on a recovery from a 3.8% post-earnings loss.
Trade commentary: TGT has been in recovery mode since last year. The churn around earnings last week signaled a potential end to that recovery. The stock gapped down below its 50DMA (the red line) with a 3.8% post-earnings loss. Buyers came roaring back the next day with a 3.1% gain, but they faded on Friday from a full recovery of the post earnings loss. With the 20DMA trending downward, TGT may continue to struggle around its 50DMA for a bit. The upshot is a very clear trade on TGT: above $127.50 (breakout) the stock is a buy, below $117 (breakdown) the stock is a short/sell.
Costco Wholesale Corporation (COST)
Description: Costco operates membership warehouse clubs that sell groceries, appliances, electronics, and consumer goods.
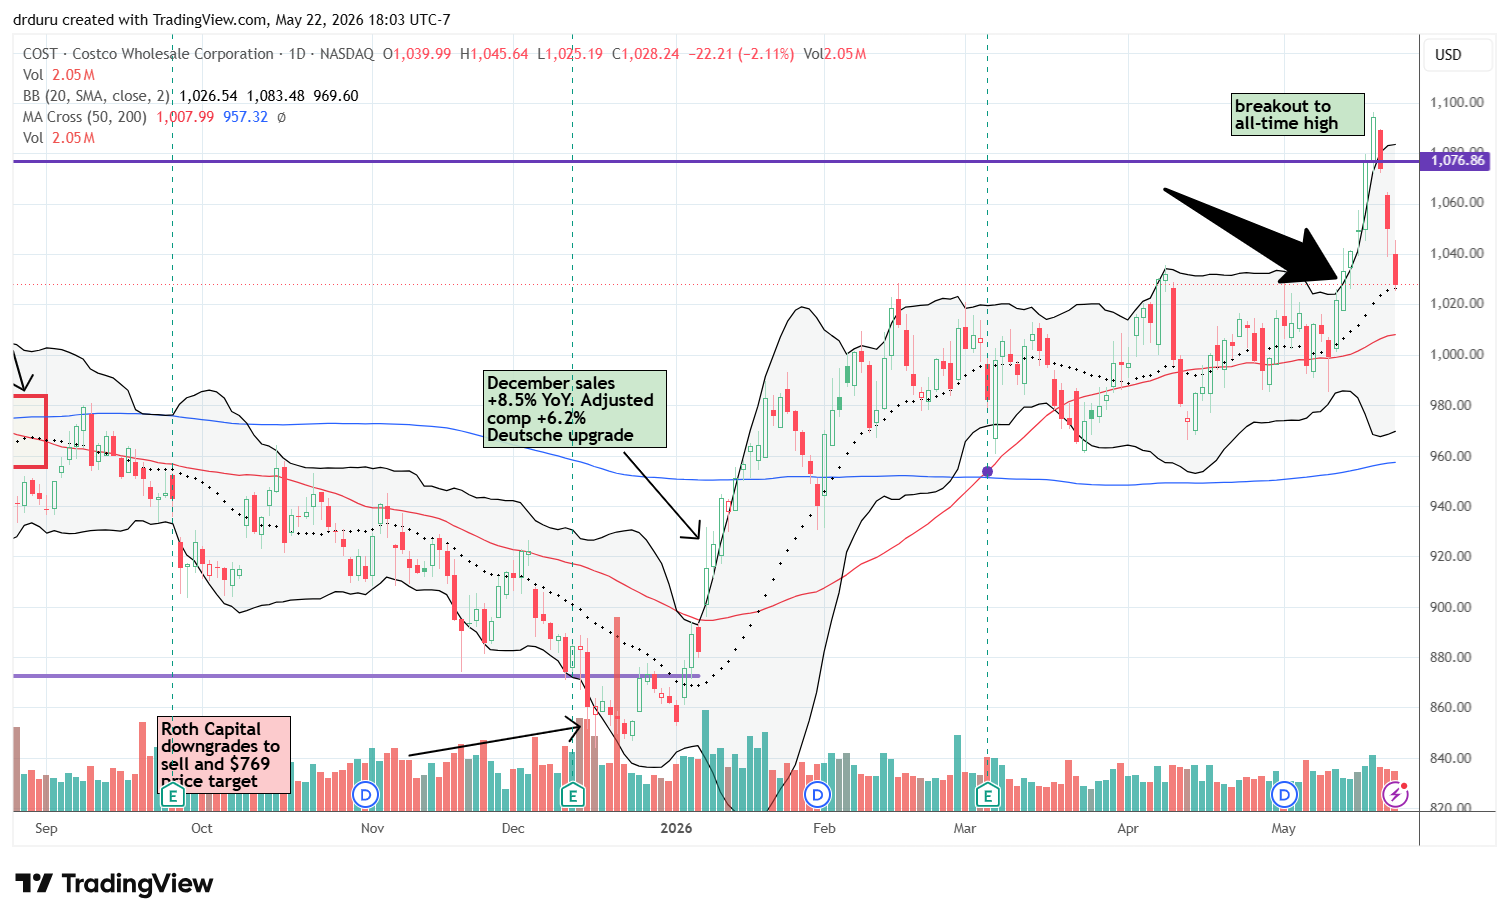
Technical status: Costco Wholesale Corp (COST) rode alongside its upper Bollinger Band to break out to a new all-time high, before quickly crashing down to its 20DMA.
Trade commentary: I thought COST finally confirmed the breakout I had been waiting for all year. The stock churned for months and then exploded higher (the thick black arrow below). Unfortunately, the rally went parabolic. Regular readers should know my caution about parabolic moves: the timing of the end is unpredictable, but the end is abrupt, violent, and steep. COST was no different. In just three days, sellers reversed the entire breakout. The good news is that support held at the 20DMA. I am holding COST as a long-term position. So I am disappointed by the loss but undeterred from the broader bullish thesis.
Birkenstock Holding plc (BIRK)
Description: Birkenstock designs and sells footwear, including sandals, shoes, and related accessories.
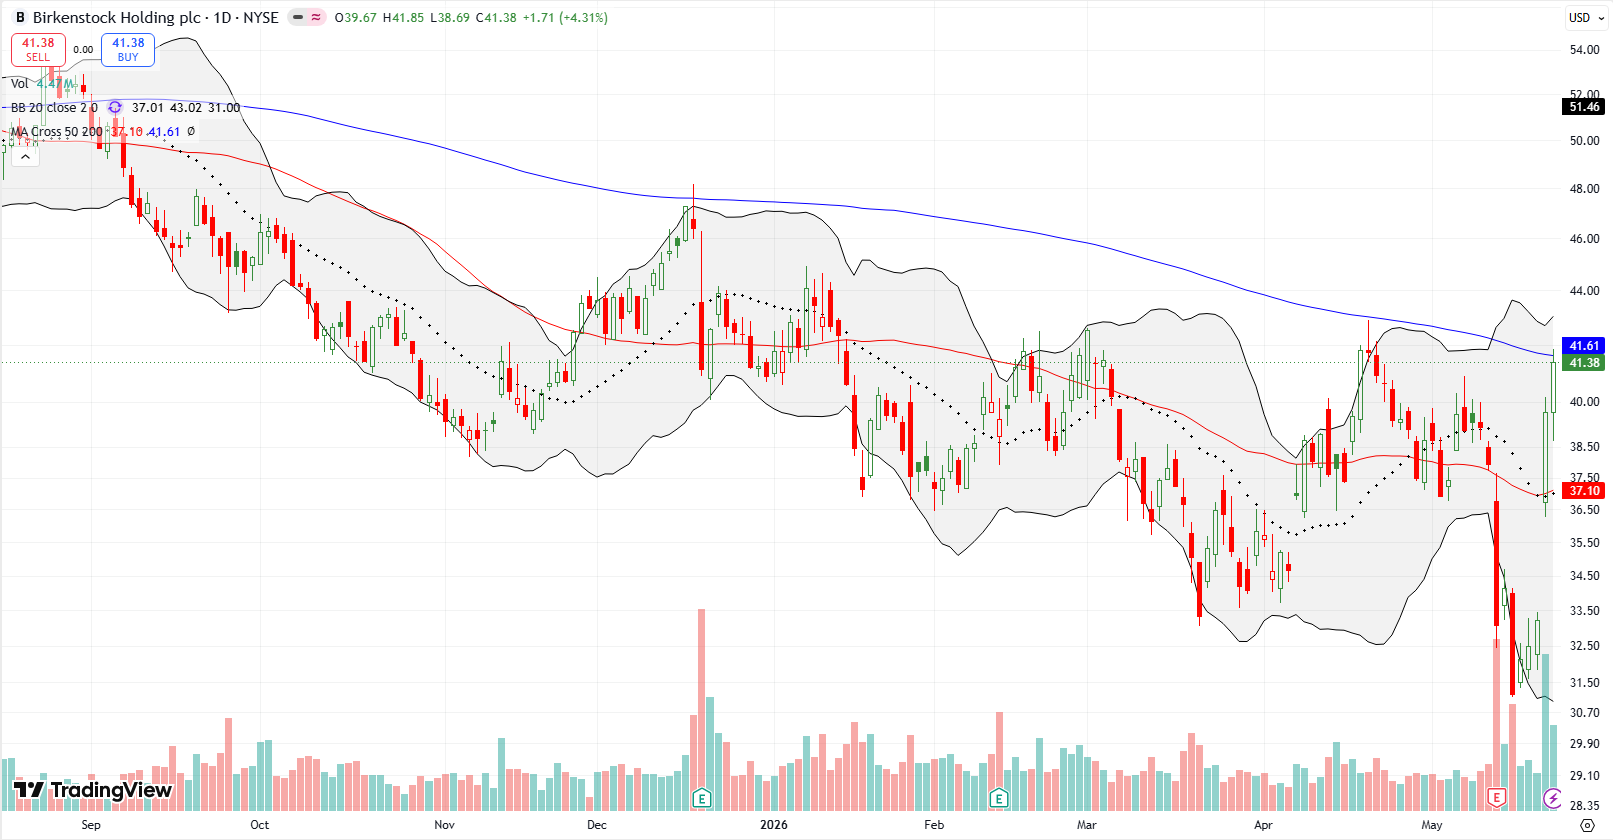
Technical status: Birkenstock Holding PLC (BIRK) broke out above its converged 50DMA and 20DMA resistance on its way to testing 200DMA resistance as investors rushed back into the stock on buyback news.
Trade commentary: BIRK looked completely broken last week while trading at all-time lows, and I used the stock as an example of the trouble with consumer-facing stocks. Then the company announced a buyback program and the stock exploded higher. The title of the press release speaks for itself: “Birkenstock to Execute $250 Million Accelerated Share Repurchase to Take Advantage of Disconnect Between Share Price and Fundamental Performance.” I suspect a lot of shorts rushed to cover rather than fight against company-sponsored buying. Even with the two-day 24.6% rebound, the stock only returned to downtrending 200DMA resistance. A close above the prior intraday high ($42.91) will get me interested in speculating on a lasting rally.
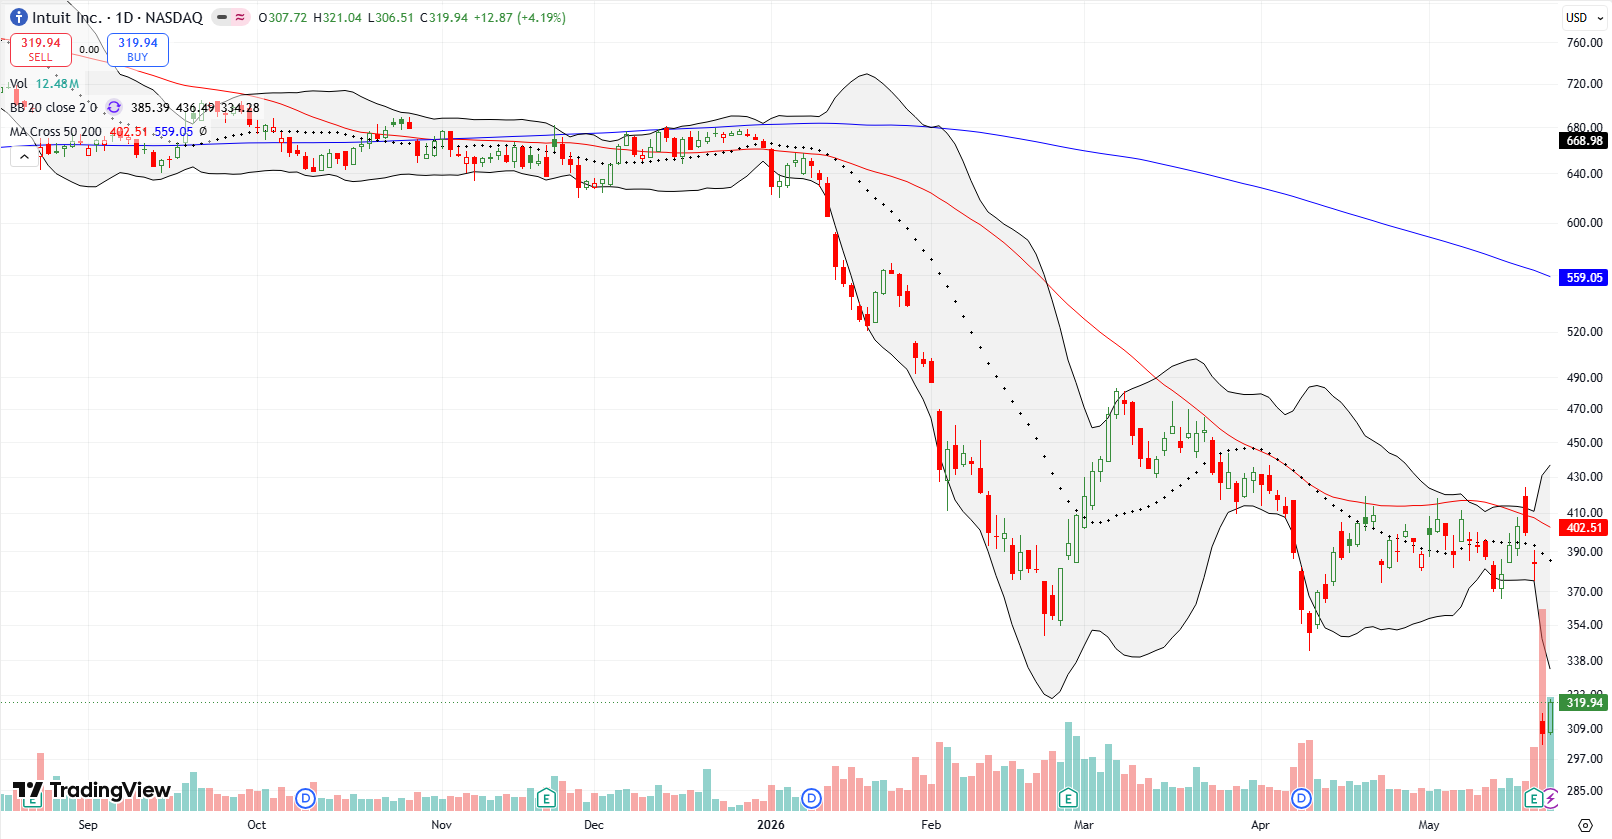
Intuit Inc. (INTU)
Description: Intuit develops financial software products including TurboTax, QuickBooks, and Credit Karma.
Technical status: Intuit Inc (INTU) crashed on a 20% post-earnings loss, dropping down to pandemic-era levels.
Trade commentary: The post-earnings selloff in INTU was severe. The stock reached all-time highs last year, and now it is approaching levels not seen since 2020. I considered buying the stock for the long term, but I still need to complete my PAIROS analysis to determine how resilient Intuit may be against AI disruption fears.
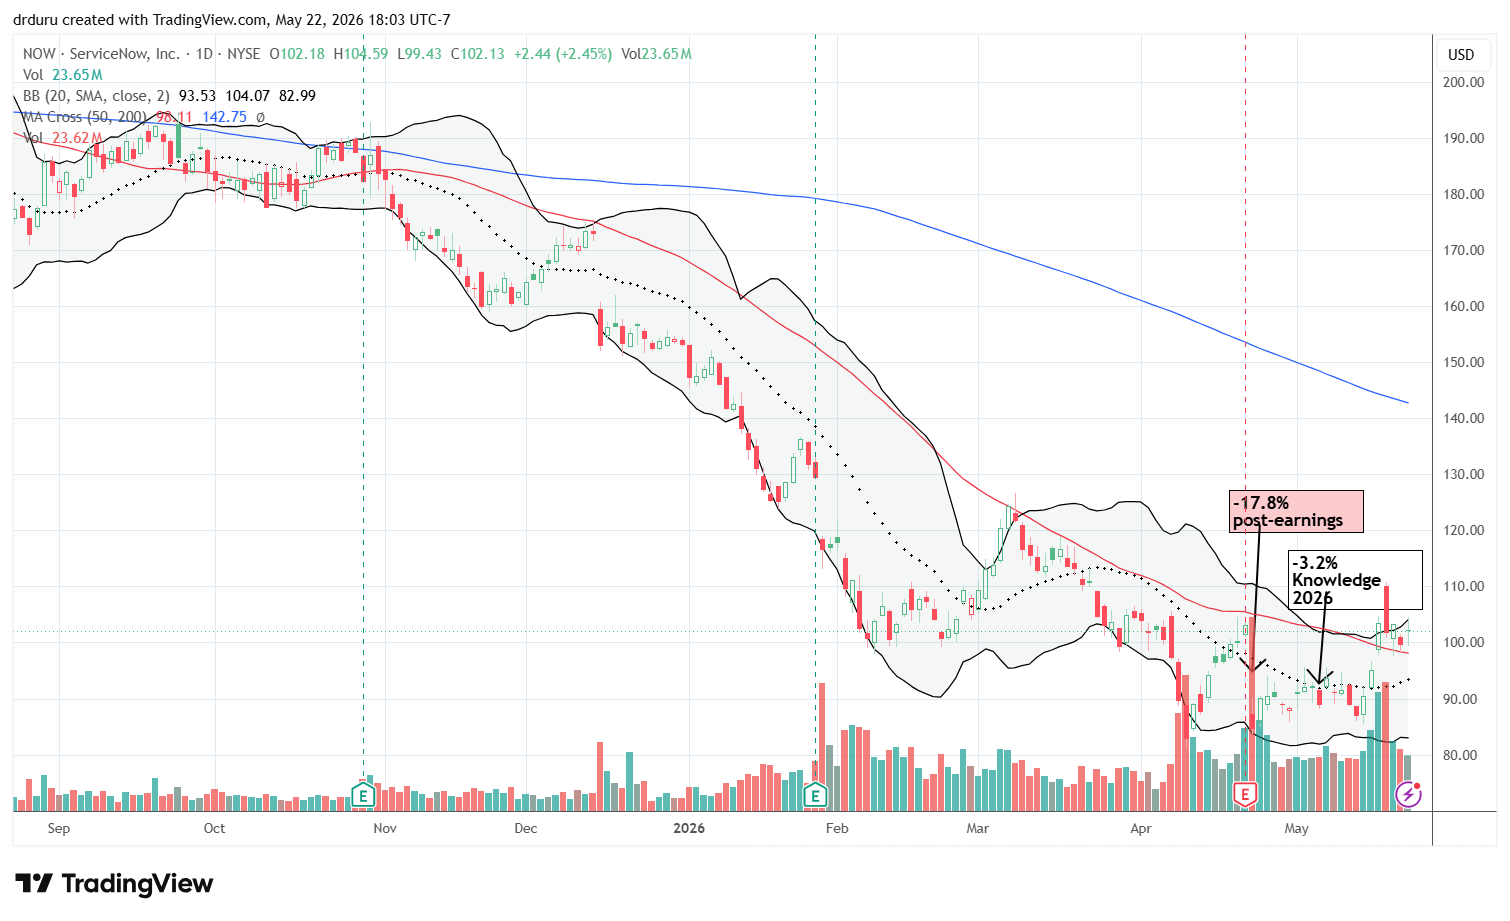
ServiceNow (NOW)
Description: ServiceNow provides cloud-based software platforms for digital workflows and enterprise automation.
Technical status: ServiceNow Inc (NOW) broke out above its 50DMA, rising away from its multi-year lows and maintaining support through most of the week.
Trade commentary: I received great validation on my bullish stance toward ServiceNow bolstered by a PAIROS analysis. The stock held its 50DMA breakout despite choppy trading conditions throughout the week. If NOW confirms with another higher close, I expect the rally to continue toward 200DMA resistance. I remain long shares and hold a June call spread.
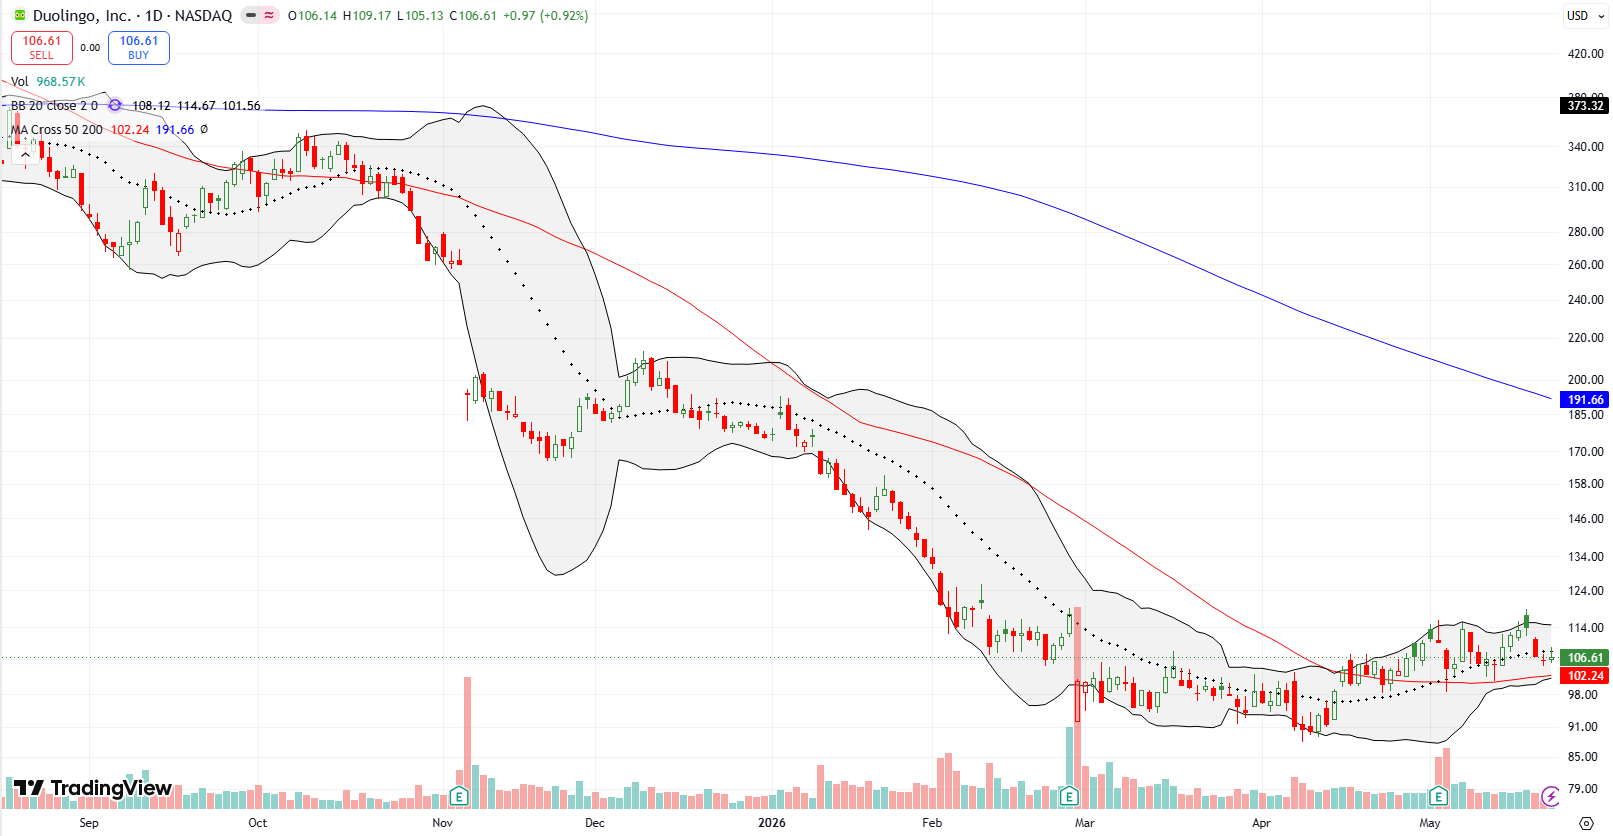
Duolingo (DUOL)
Description: Duolingo develops language-learning software applications and educational technology platforms.
Technical status: Duolingo Inc (DUOL) is pivoting around its 20DMA as it tentatively holds 50DMA support. This price consolidation could launch a rally.
Trade commentary: DUOL impressed me after buyers quickly stepped in after the post-earnings pullback. The stock failed to sustain a breakdown below its 50DMA, and that resilience convinced me to buy some shares. The position is speculative, but I liked management’s discussion about integrating AI into the platform.
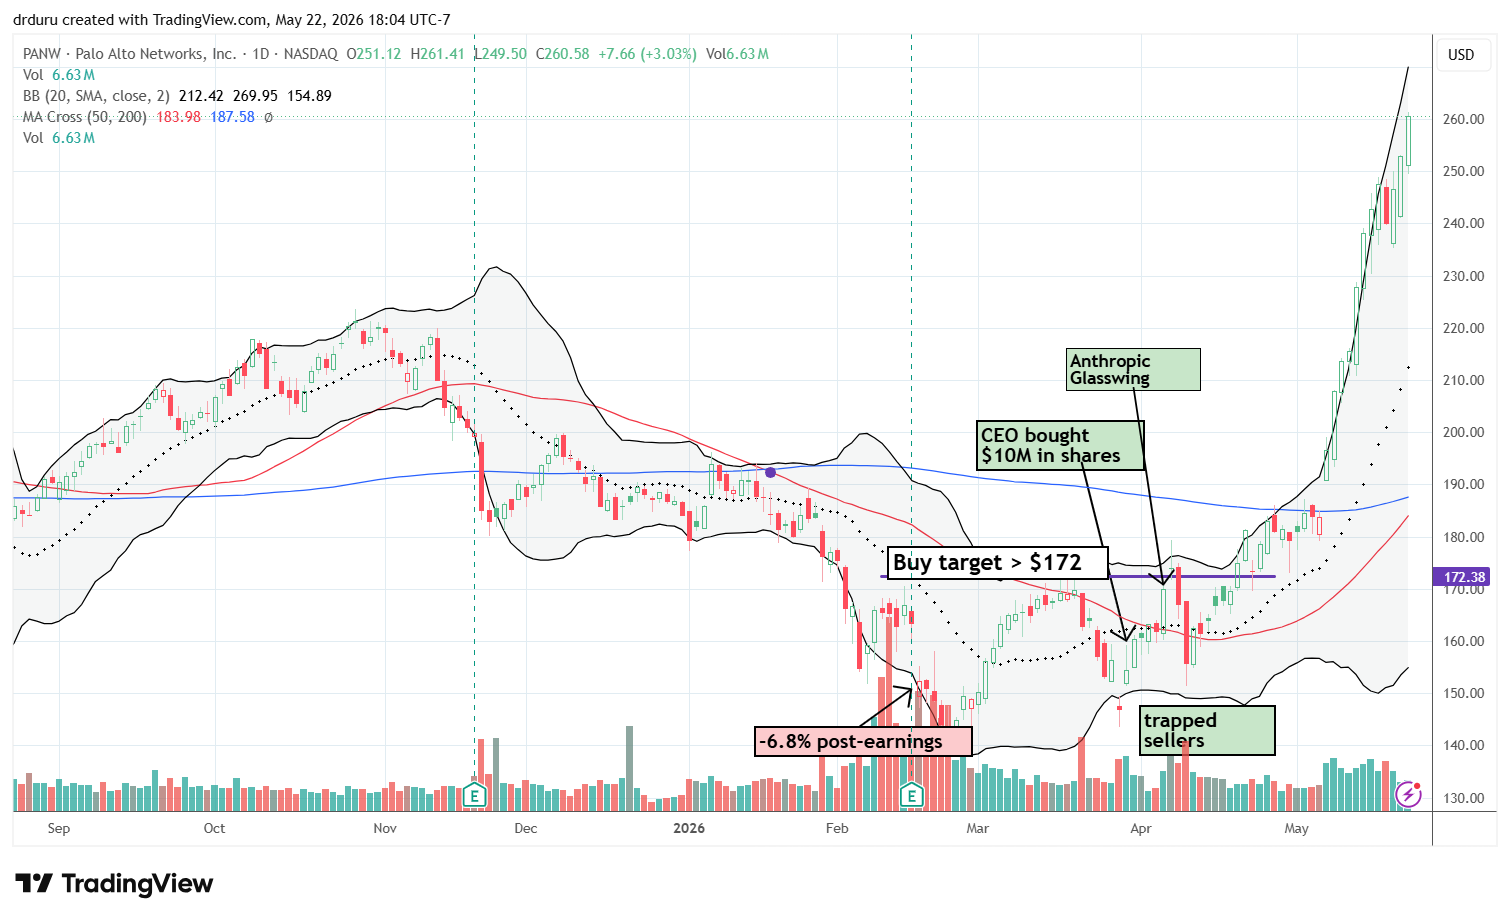
Palo Alto Networks (PANW)
Description: Palo Alto Networks provides cybersecurity platforms and cloud-based security services.
Technical status: Palo Alto Networks Inc (PANW) skyrocketed upwards, rising alongside its upper Bollinger Band and reaching a new all-time high.
Trade commentary: PANW completely exceeded my expectations. I expected a breakout above 200DMA resistance but not a subsequent surge of 41.8% to multiple all-time highs in two weeks of trading. Because I was bearish on the overall market, I sold this parabolic position on Monday. I did not think much about the potential for a continued run-up because I held two other cybersecurity positions in CrowdStrike (CRWD) and Okta (OKTA). Taking profits on PANW was risk management. Meanwhile I brace for the eventual end of CRWD’s parabolic runup and upcoming earnings for OKTA.
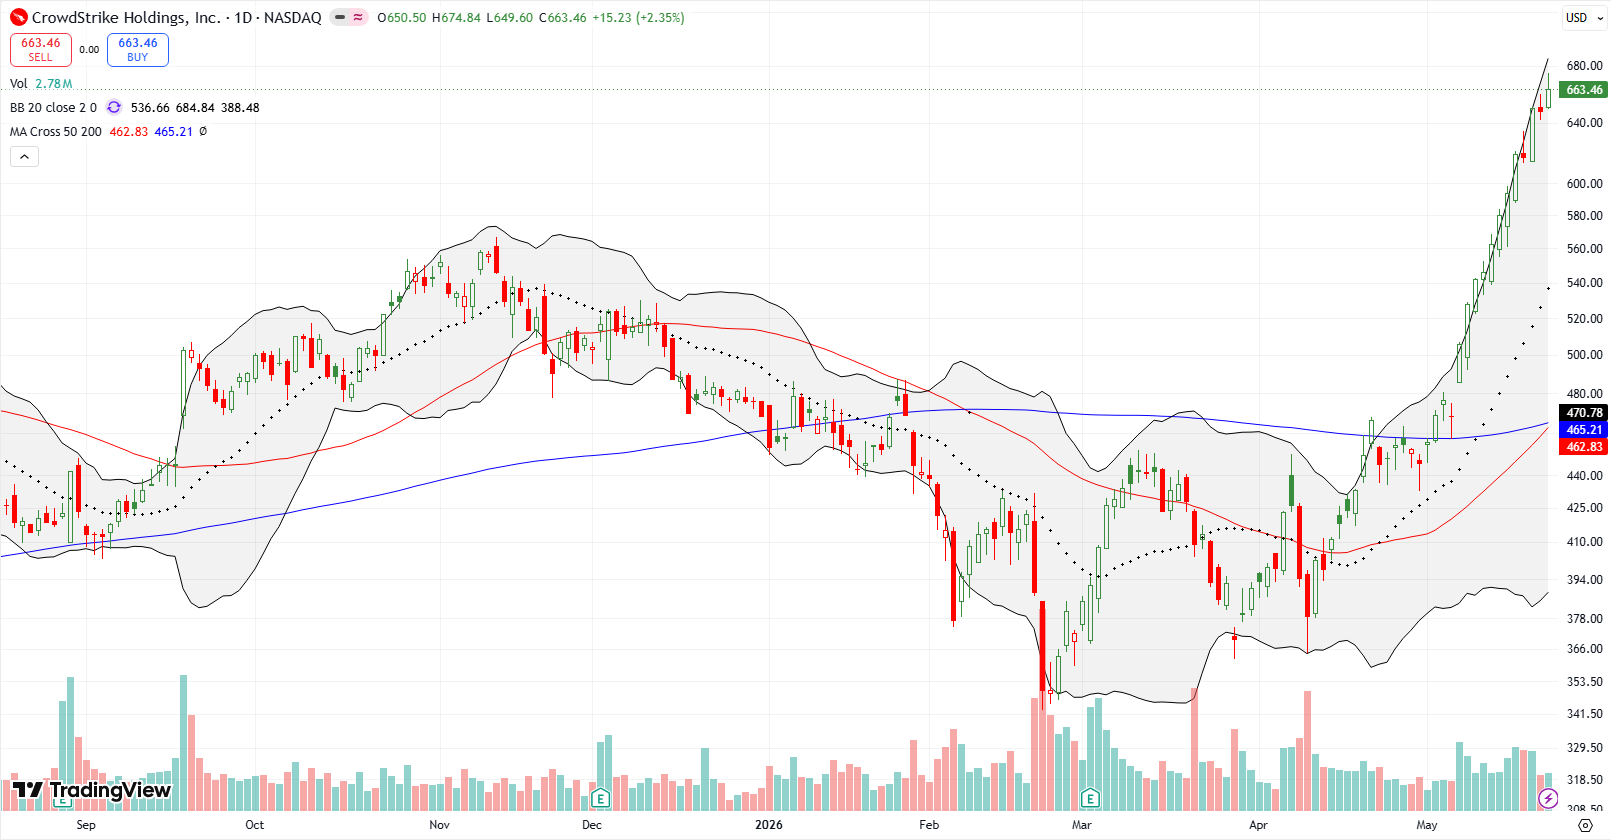
CrowdStrike Holdings Inc (CRWD)
Description: CrowdStrike Holdings Inc (CRWD) provides enterprise technology services, cloud computing solutions, and hardware products.
Technical status: Similarly to PANW, CrowdStrike Holdings Inc (CRWD) rose linearly directly alongside its upper Bollinger Band, reaching a new all-time high.
Trade commentary: I was skeptical when CrowdStrike Holdings Inc (CRWD) collapsed during the AI panic earlier this year, so I dutifully increased my position by 50%. The stock churned for over two more months before breaking out above its 200DMA resistance. Like PANW, I did not anticipate such a reversal in sentiment causing a nonstop runup. As mentioned above, I am now bracing for a sharp pullback at some point.
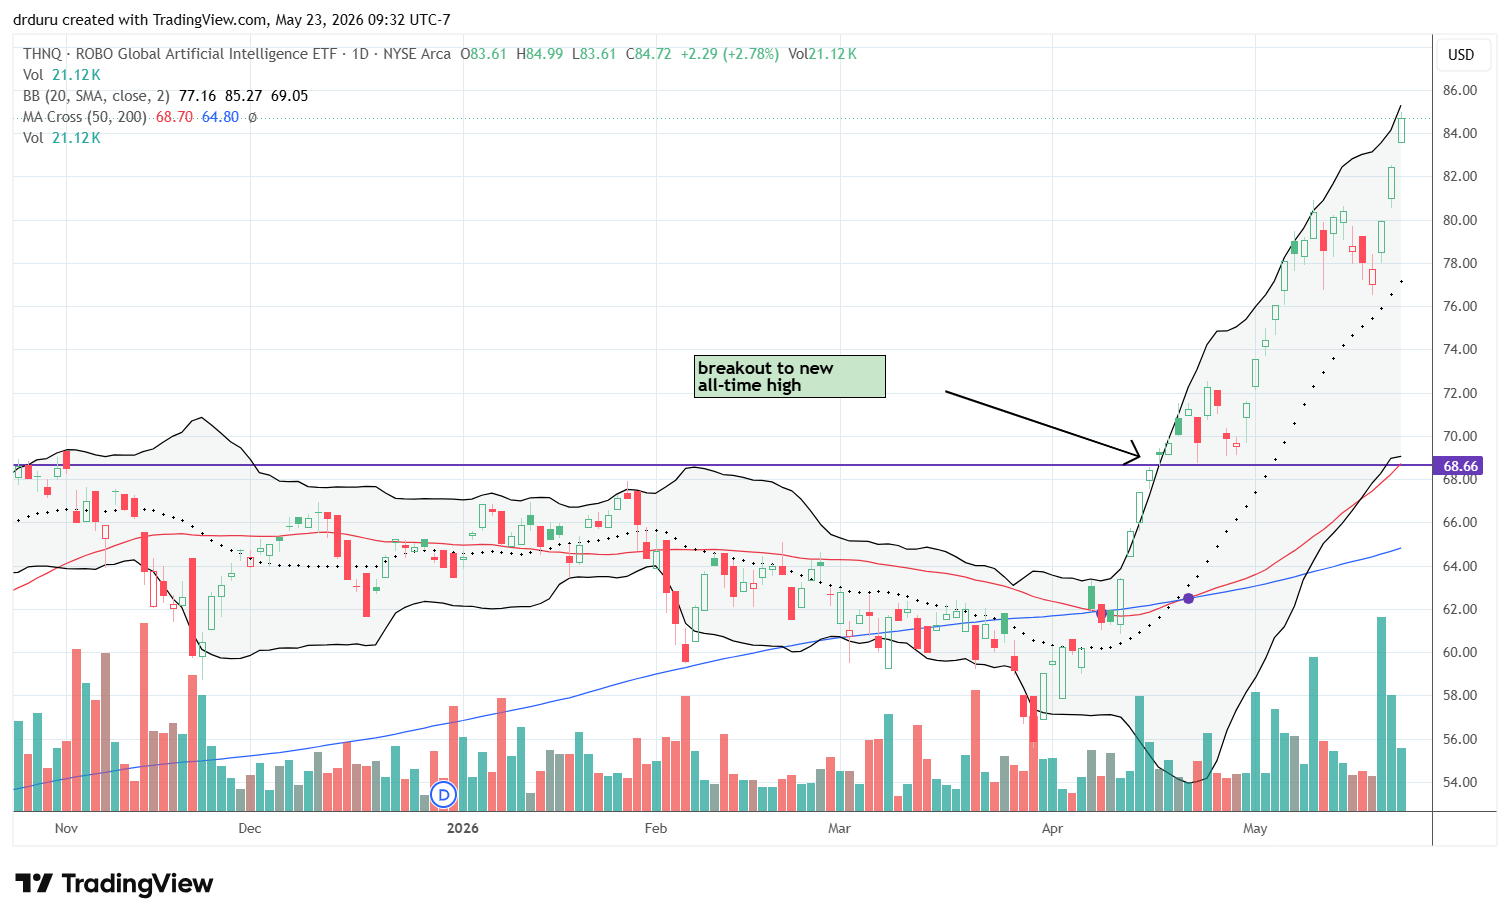
Robo Global Artificial Intelligence ETF (THNQ)
Description: THNQ is an exchange-traded fund focused on companies involved in artificial intelligence technologies and applications.
Technical status: THNQ rallied sharply as the AI trade regained momentum across the market.
Trade commentary: The AI trade came roaring back last week. The fresh momentum drove my holding in THNQ to an overall double. Per my risk management rules, I sold half of my position. With my cost basis covered, I am now riding the house’s money and will think much less about how the ETF is doing from moment to moment. Note that even after the trimming, THNQ remains my core AI-related holding.
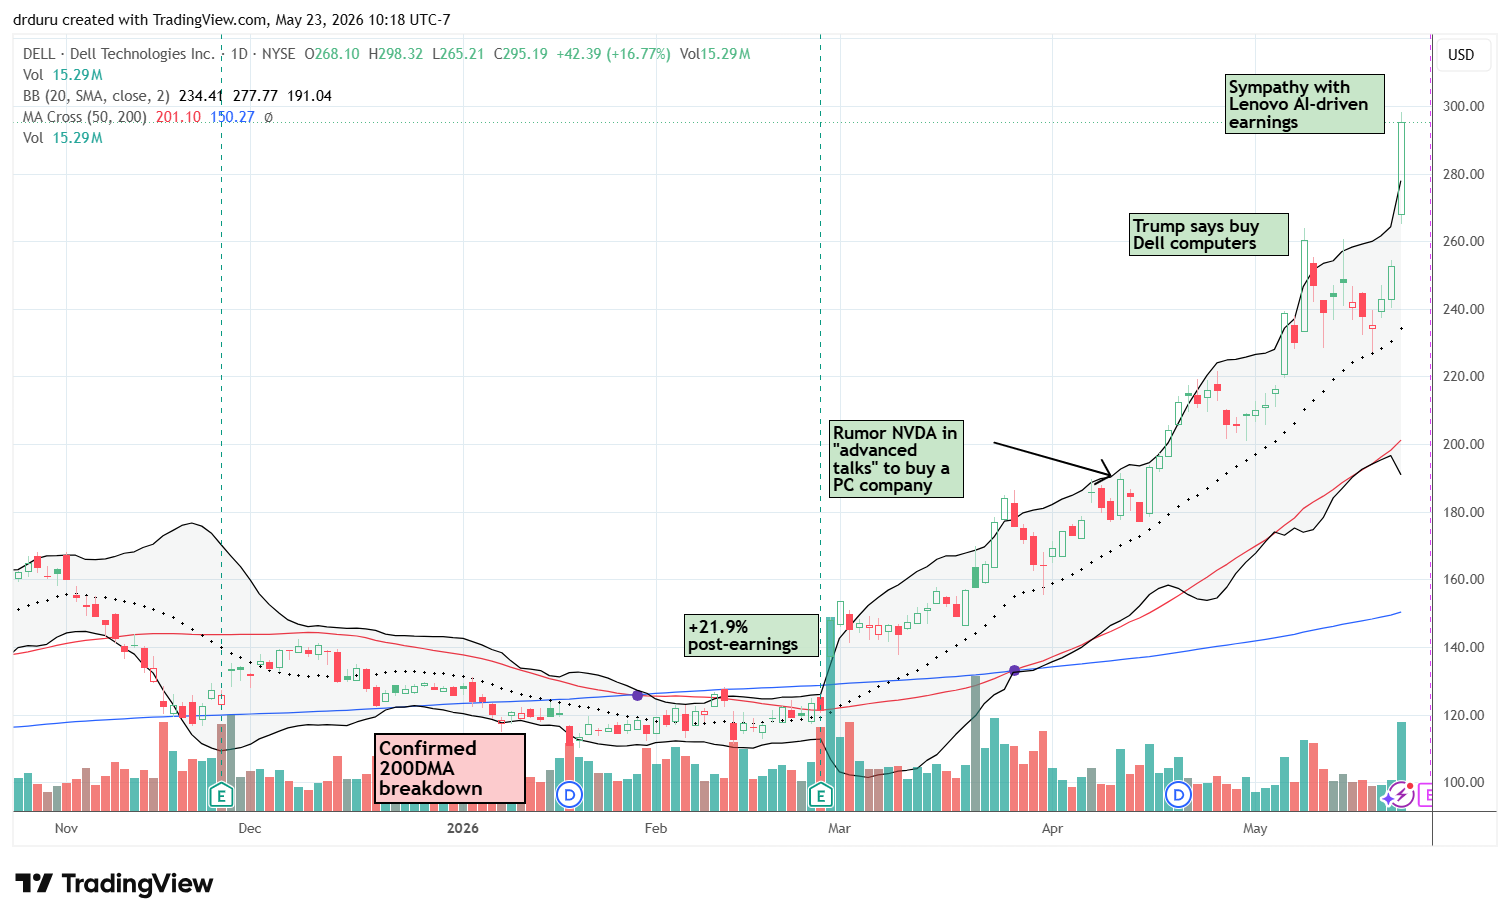
Dell Technologies (DELL)
Description: Dell Technologies develops and sells computers, servers, storage systems, and IT infrastructure solutions.
Technical status: DELL surged to fresh all-time highs after another explosive rally in sympathy with Lenovo’s bullish AI-related earnings report.
Trade commentary: DELL has been on an incredible run since earnings earlier this year. I last participated through a put sale after rumors that Nvidia wanted to buy a PC company. The latest breakout came after Lenovo discussed strong AI-related demand for computers, and investors immediately extrapolated that enthusiasm toward Dell and other PC-related companies. Earnings this week should be a make or break moment for this run-up.
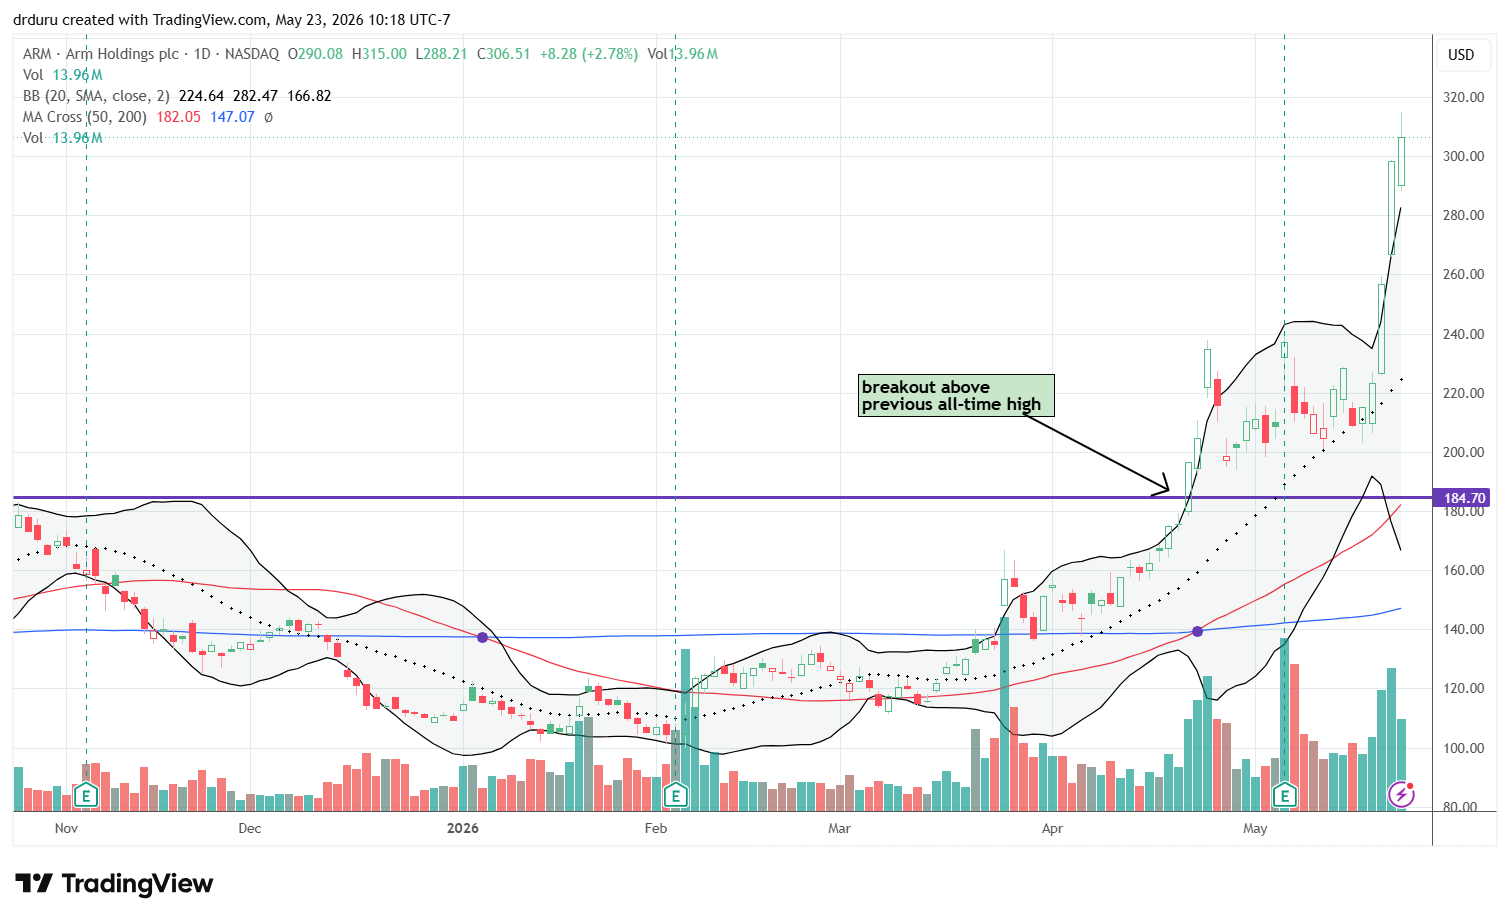
Arm Holdings plc (ARM)
Description: Arm Holdings designs semiconductor architectures and licenses chip technology for computing devices.
Technical status: ARM rebounded from 20DMA support and broke out to new all-time highs after a short consolidation period.
Trade commentary: ARM turned into one of my best trades in a very short period of time. I bought near 20DMA support before turning bearish on the market. As I braced for the damage, the stock instead exploded higher. The position now has a trailing stop in place so that I can preserve some of the profits once volatility strikes to the downside of this parabolic move.
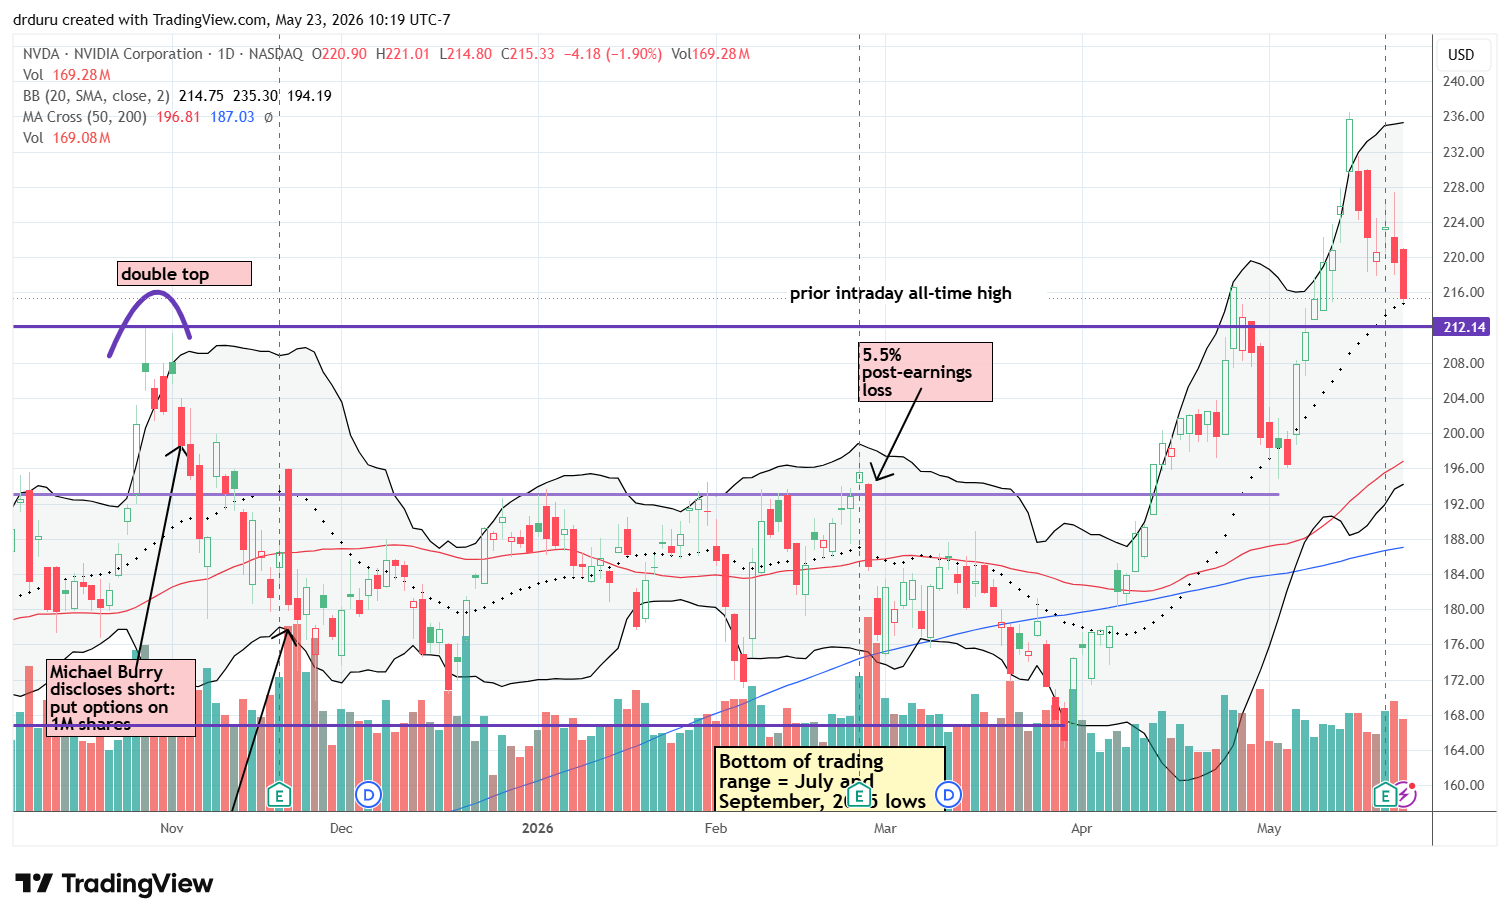
NVIDIA Corporation (NVDA)
Description: NVIDIA develops graphics processors, artificial intelligence hardware, and accelerated computing platforms.
Technical status: NVDA underperformed despite strong anticipation surrounding earnings. The stock faded to a 1.8% post-earnings loss and lost another 1.9% on the way to testing 20DMA support on Friday.
Trade commentary: NVDA was a cornerstone stock for the market last week because of earnings. The stock initially rallied after earnings and then reversed lower into Friday’s test of 20DMA support. That underperformance stood out because the broader market kept rallying. I expected the market to pivot with NVDA, so this underperformance takes on extra significance. Are other parts of the AI trade becoming more important? NVIDIA announced an $85B stock buyback and hiked its dividend from a penny to 25 cents. So perhaps NVDA is transitioning into a “mature” company.
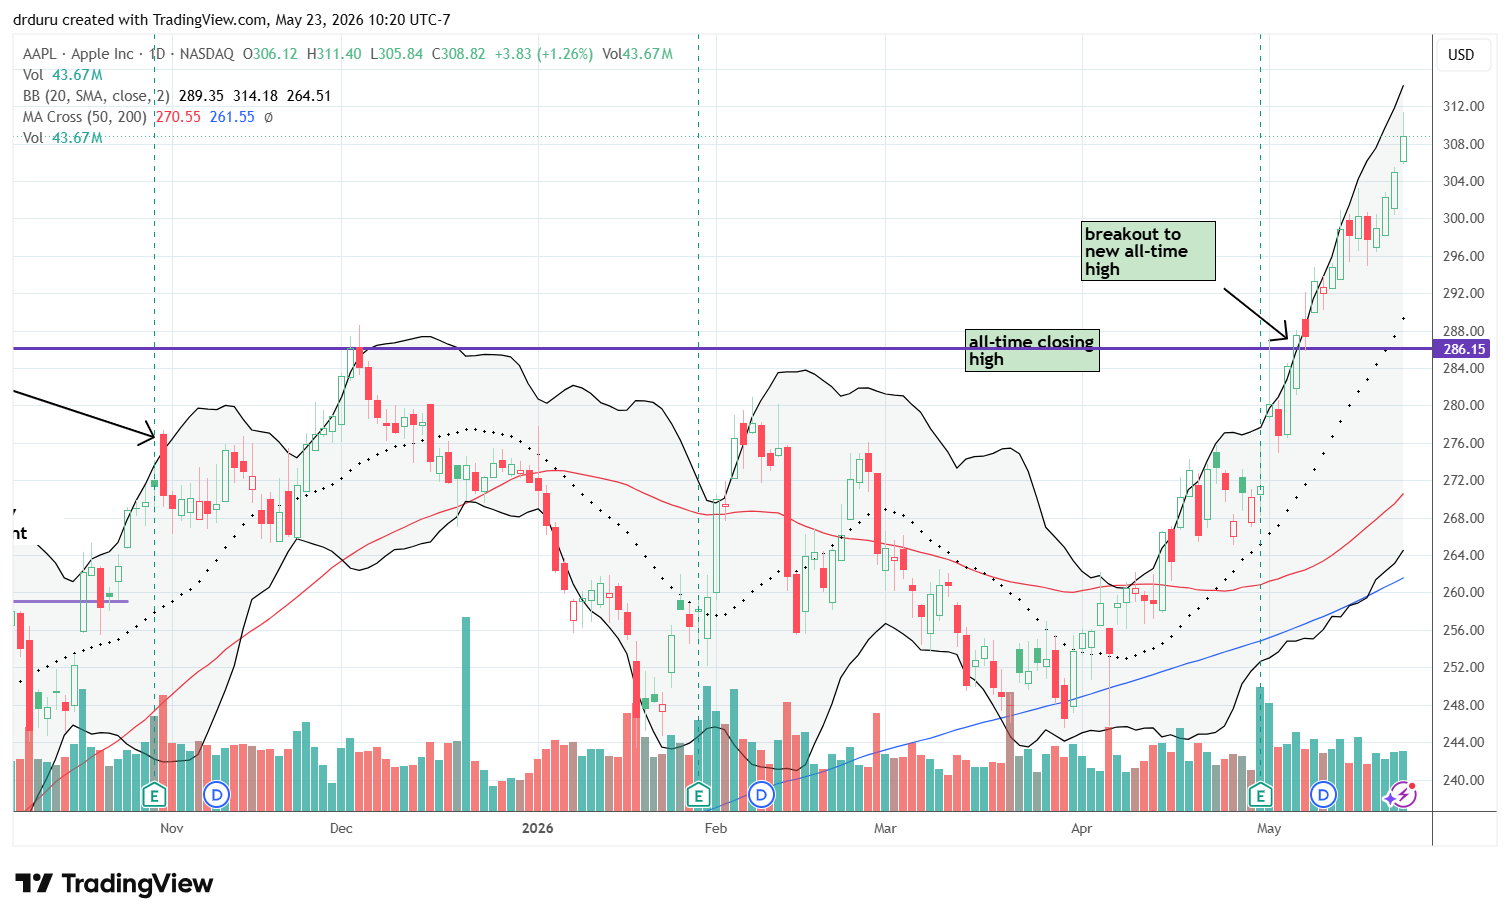
Apple Inc. (AAPL)
Description: Apple designs and sells consumer electronics, software, and digital services including the iPhone, Mac, and iCloud.
Technical status: Apple (AAPL) rallied to fresh all-time highs for three straight trading days. The stock confirmed bullishness after previously appearing vulnerable to a potential topping pattern.
Trade commentary: Apple helped undermine the bearish narrative for the market. When AAPL is bullish, I cannot be bearish on the stock market. AAPL’s near vertical move is quite impressive, but I would only buy on a dip to uptrending 20DMA support.
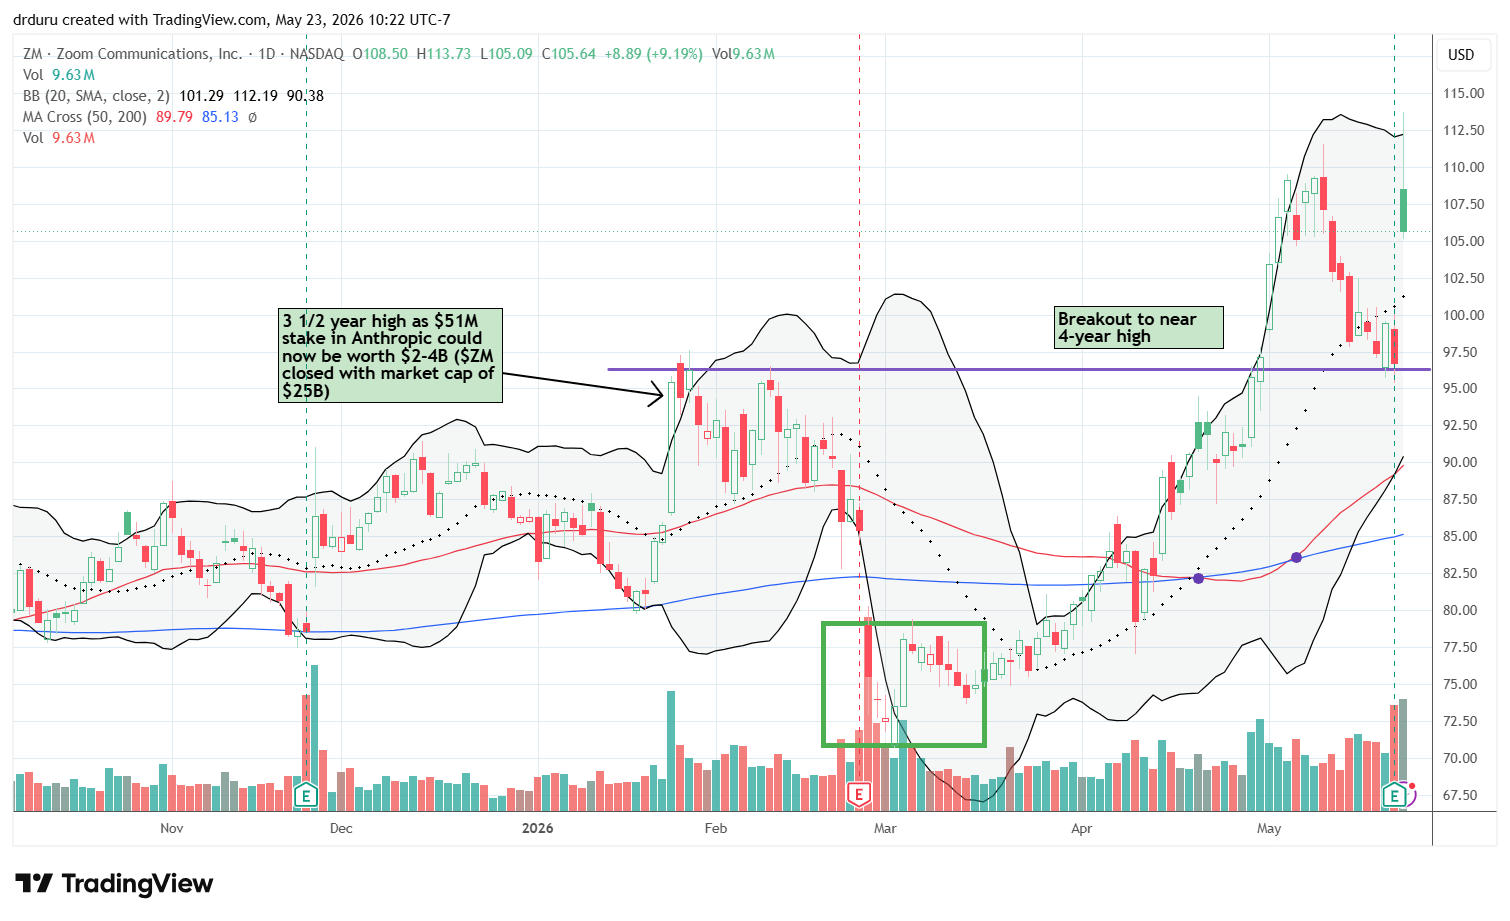
Zoom Communications, Inc (ZM)
Description: Zoom Communications provides video communications, collaboration, and cloud-based conferencing services.
Technical status: ZM gained as much as 17.6% post-earnings before fading to a 9.2% gain. The brief breakout to a fresh 4-year high is the latest choppy push higher for ZM.
Trade commentary: At this point, ZM looks determined to “sneak” its way higher as subsequent breakouts get faded only to setup the next run. I bought a weekly 100/110 call spread as ZM tested 20DMA support in the previous week and prior to my bearish flip. I took a chance on holding the call spread through earnings. That trade worked out as I took profits soon after the post-earnings open. Despite the ominous fade from a fresh breakout, I like how the last breakout point held as support. So I am looking to get back to accumulating shares.
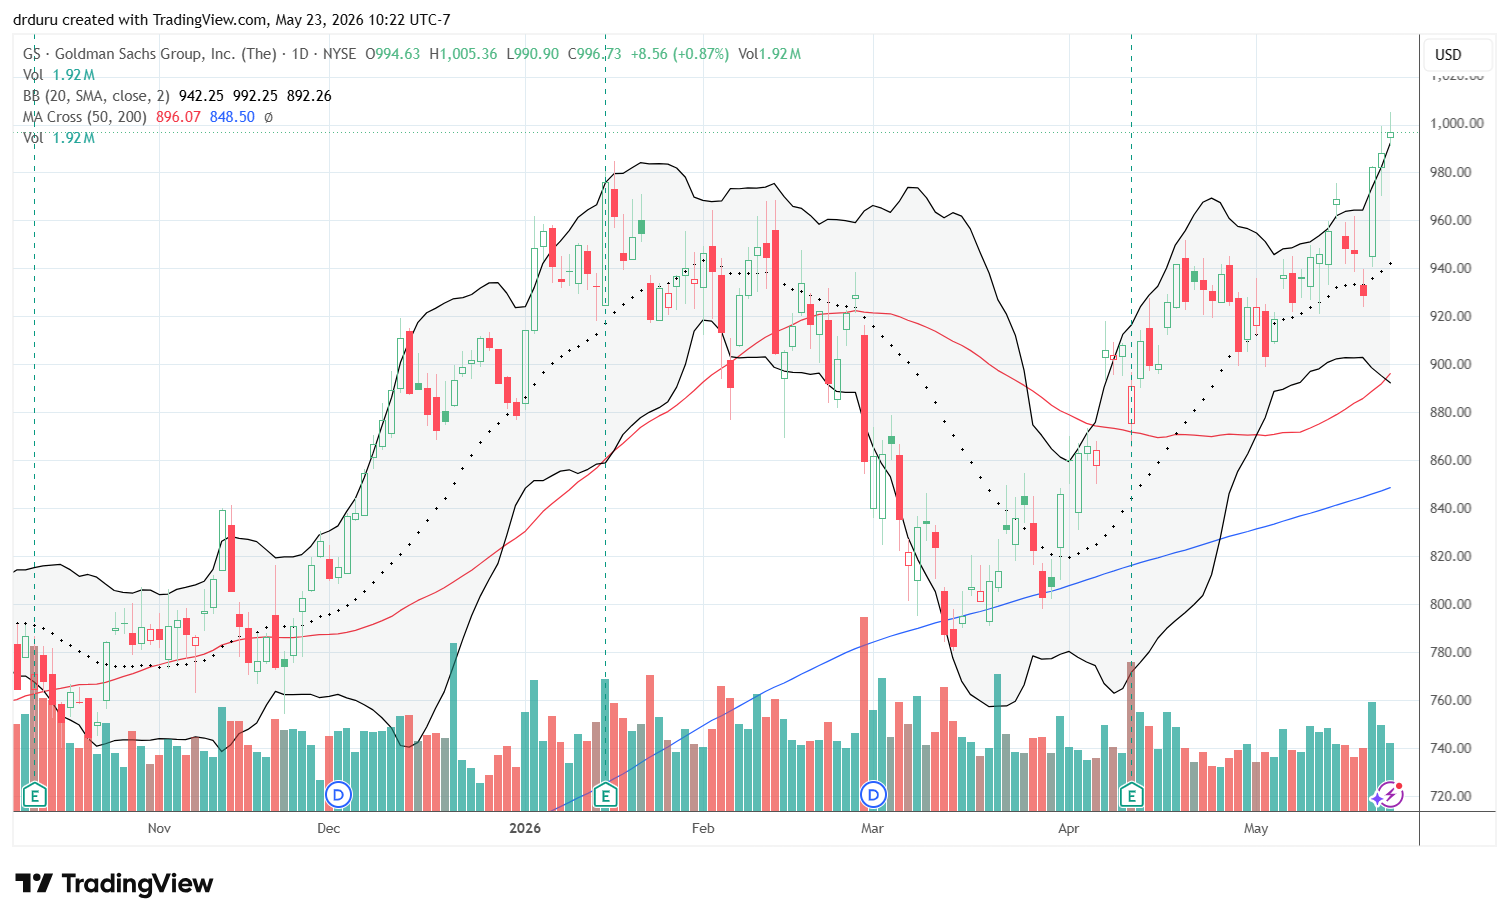
Goldman Sachs Group, Inc. (GS)
Description: Goldman Sachs provides investment banking, securities, asset management, and financial advisory services.
Technical status: Goldman Sachs (GS) broke out to another all-time high despite a weak start to the week.
Trade commentary: Like AAPL, when GS is bullish, I cannot be bearish on the stock market. GS tentatively broke down below 20DMA support on Tuesday only to surge 5.8% the next day and firmly reestablish its bullishness. Investors are likely positioning for Goldman Sachs to benefit from its participation in the SpaceX IPO.
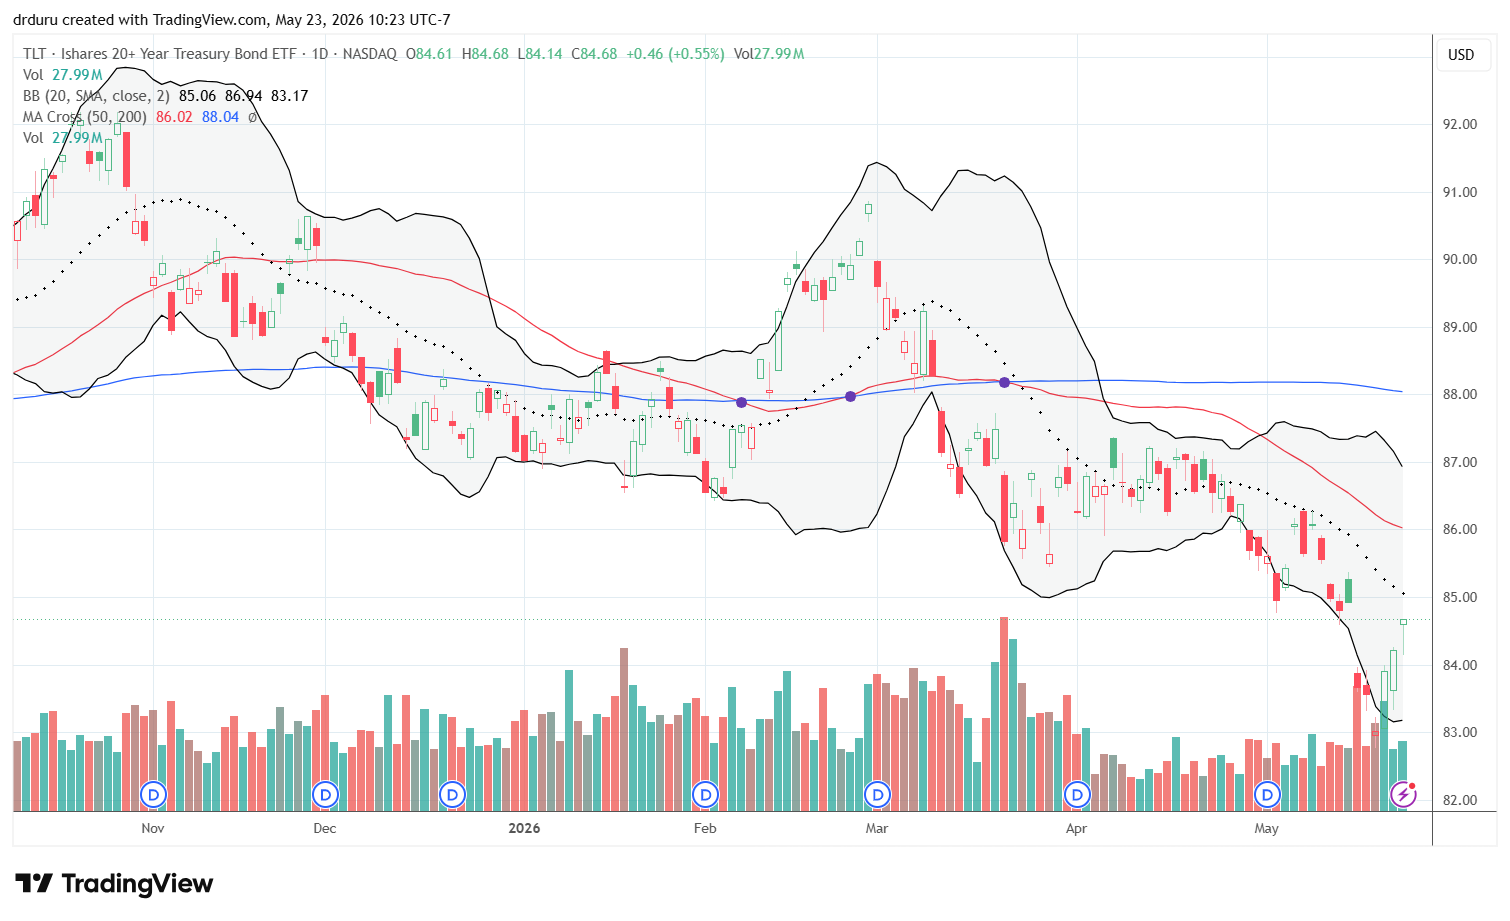
iShares 20+ Year Treasury Bond ETF (TLT)
Description: The iShares 20+ Year Treasury Bond ETF is an exchange-traded fund designed to track long-duration U.S. Treasury bonds.
Technical status: The iShares 20+ Year Treasury Bond ETF (TLT) gapped down on Tuesday to a 2 1/2 year low before rebounding sharply toward 20DMA resistance.
Trade commentary: TLT helped support the bullish reversal in equities. The week started with a continuation of the bond selling that supported my bearish thesis for the broader market. With oil dropping off its highs, buyers aggressively stepped into TLT, and the rebound quickly became a tailwind for stocks. Right now, the correlation between bonds and equities has tightened again, so I will continue monitoring whether higher bond prices continue supporting higher stock prices.
I added to my shares in TLT on Monday as I continue to make a contrarian longer-term bet that eventually the Treasury and Fed will goose long-term yields lower. In the meantime, I realized that selling puts could offer an even more attractive yield. Stay tuned for this analysis.
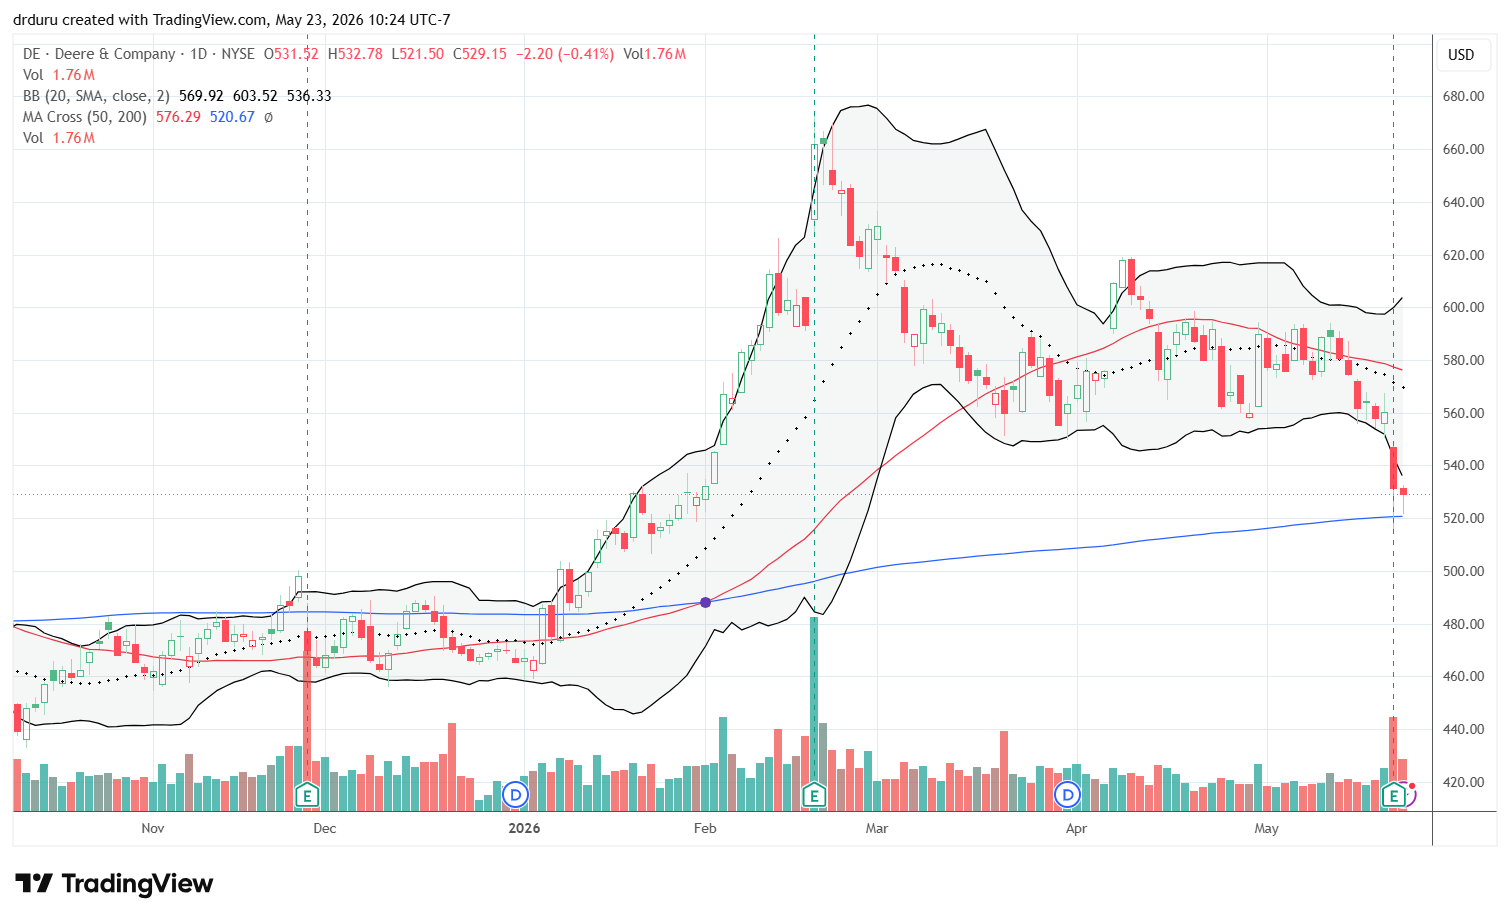
Deere & Company (DE)
Description: Deere & Company manufactures agricultural, construction, and forestry equipment.
Technical status: Deere & Company (DE) briefly broke below 200DMA support before losing 5.2% post-earnings. Sellers tested support the next day and placed the stock at a critical technical juncture.
Trade commentary: DE is on my watch list because the post-earnings setup created a potentially explosive breakdown/rebound technical trade. The stock lost 5.2% after earnings and intraday tested 200DMA support. Buyers were forced to defend support a second time on Friday. DE below $520 becomes a short candidate. DE above $548 sets up a rebound toward 50DMA resistance.
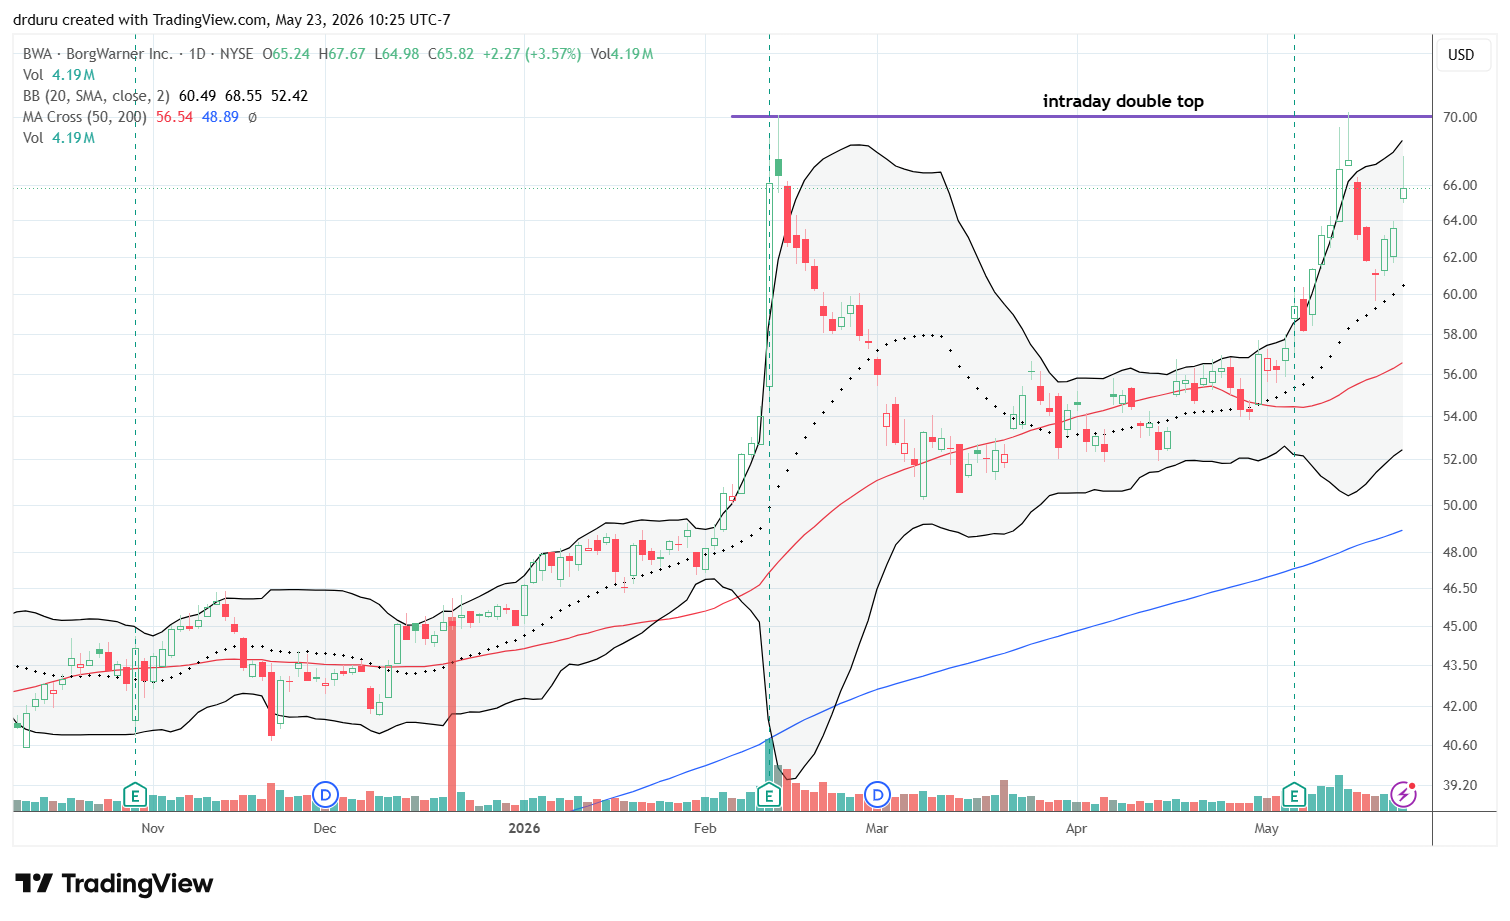
BorgWarner Inc. (BWA)
Description: BorgWarner, Inc manufactures automotive components and propulsion systems for combustion, hybrid, and electric vehicles.
Technical status: BorgWarner, Inc (BWA) successfully held 20DMA support after fading from an ominous double top. Can the stock break out to invalidate the double top?
Trade commentary: BWA originally appeared on my radar two months ago during a scan of stocks that printed bullish engulfing patterns. That scan turned into a seminal moment for technical trades this year with almost every single stock in that scan soaring to large gains thanks to a heavy dose of semiconductor plays. I held BWA until it faded from its intraday all-time high on May 14. The continued selling validated my decision, but the stock flipped right back to bullish with an impressive rebound off 20DMA support. The question now is whether BWA can invalidate its double-top and resume the post-earnings momentum.
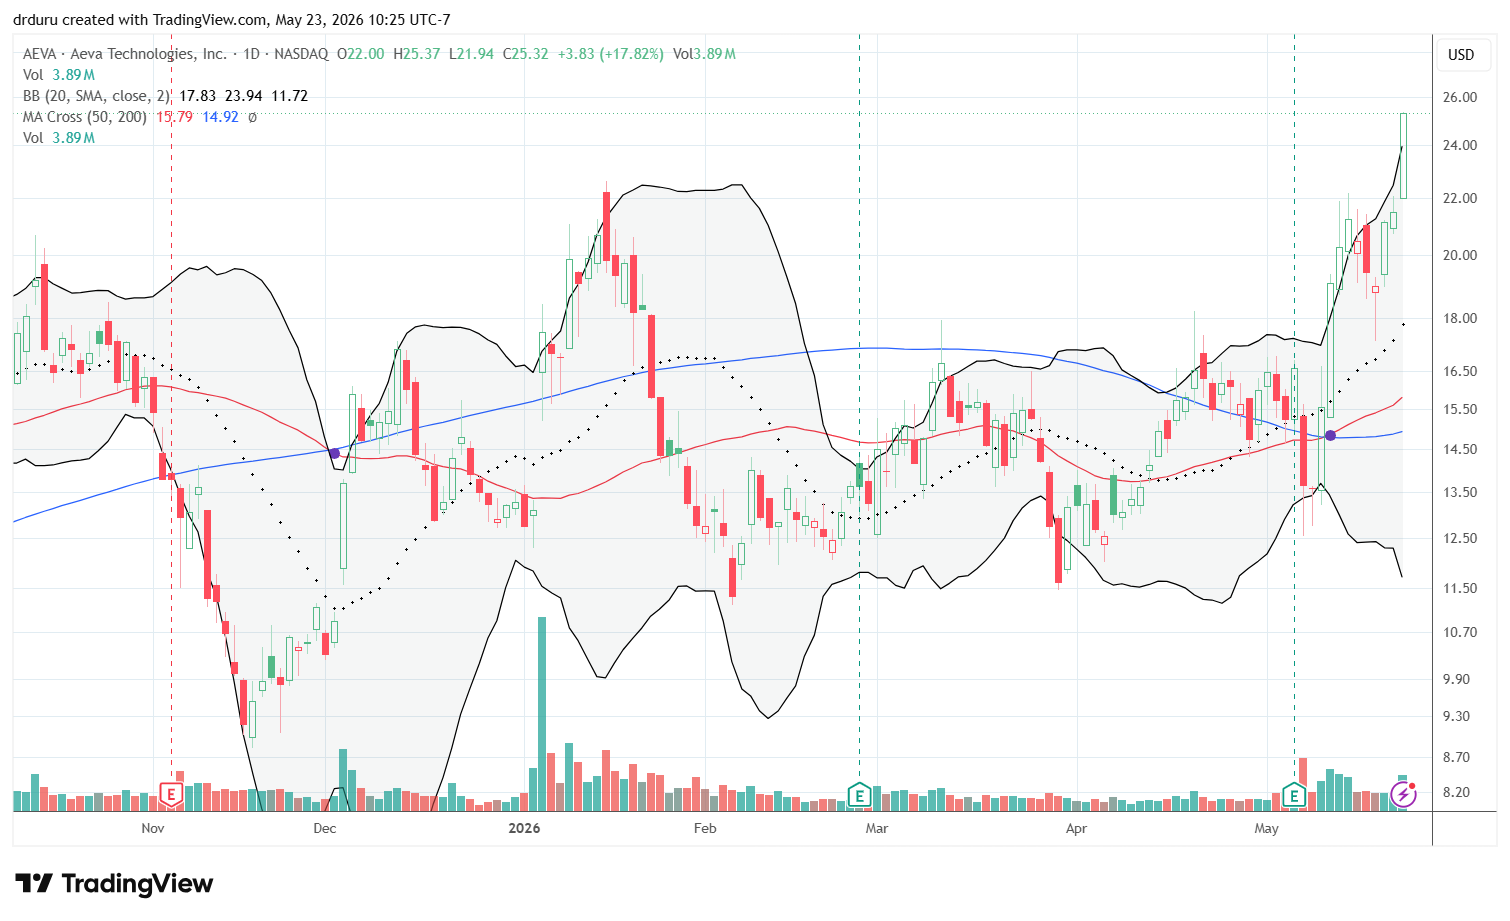
Aeva Technologies, Inc. (AEVA)
Description: Aeva Technologies develops lidar sensing systems for autonomous driving and industrial automation applications.
Technical status: Aeva Technologies (AEVA) broke out to a 10-month high with a 17.8% gain.
Trade commentary: AEVA immediately caught my attention after its breakout. I was tempted to chase the move, but I decided to remain disciplined and wait for a pullback setup. Ideally, I would like to see the stock retrace toward prior resistance around the low-to-mid $20 range. The longer-term upside potential remains substantial given the stock’s previous highs near $38.
Footnotes
Subscribe for free to get email notifications of future posts!
“Above the 50” (AT50) uses the percentage of stocks trading above their respective 50-day moving averages (DMAs) to measure breadth in the stock market. Breadth defines the distribution of participation in a rally or sell-off. As a result, AT50 identifies extremes in market sentiment that are likely to reverse. Above the 50 is my alternative name for “MMFI” which is a symbol TradingView.com and other chart vendors use for this breadth indicator. Learn more about AT50 on my Market Breadth Resource Page. AT200, or MMTH, measures the percentage of stocks trading above their respective 200DMAs.
Active AT50 (MMFI) periods: Day #210 over 20%, Day #37 over 30%, Day #33 over 40%, Day #3 over 50% (overperiod), Day #10 under 60% (underperiod), Day #183 under 70%
Source for charts unless otherwise noted: TradingView.com
Full disclosure: long SPY put spread, long QQQ put spread, long COST, long NOW shares and call spread, long DUOL, long CRWD, long THNQ, long ARM, long TLT, long FIG
FOLLOW Dr. Duru’s commentary on financial markets via StockTwits, BlueSky, and even Instagram!
*Charting notes: Stock prices are not adjusted for dividends. Candlestick charts use hollow bodies: open candles indicate a close higher than the open, filled candles indicate an open higher than the close.
* Blog notes: this blog was partially written based on the heavily edited transcript of the following video that includes a live review of the stock charts featured in this post. I used ChatGPT to process the transcript.