
Identify Parabolic Trading
I often warn about the dangers of chasing parabolic trading action in stocks and currencies. Since parabolic trading tends to end with steep price reversals, traders need to know how to identify trouble. A parabolic price run-up is an extreme uptrend. It is usually brief and features frequent, often consecutive, trading days with closing prices at or above the upper Bollinger Band (BB). Bollinger Bands define the range of price action two standard deviations above and below a moving average. For my charts, I use a 20-day moving average (DMA) (dotted lines) with the BBs marked by black lines and shading in between to help the range stand out. This range covers 95% of the price action. Thus, being close to or above a Bollinger Band is extreme. The higher the price goes above the upper BB, the more extreme the trading action, and the more fragile the parabolic trading becomes.
Automatically Scan for A Parabolic Rise
SwingTradeBot has a scan for a parabolic rise. The site defines a parabolic rise in stocks as follows: “Stocks which are in the midst of an extremely sharp rally. They are very extended and may be ripe for a pullback.” The extreme refers to the upper BB. “Extended” references the persistence of the trading action and the distance above the upper BB. “Ripe for a pullback” characterizes the fragility of the price action.
The charts below come from using the related scan for the month of December, 2021 to find representative candidates of stocks in parabolic price runs. The reddish/orangish shading covers the range of the extreme price action. In the first two cases, the extreme trading ended with a sharp pullback. The last case shows extreme trading as a part of a recurring pattern. In each case, sharp pullbacks did not permanently impair the stock.
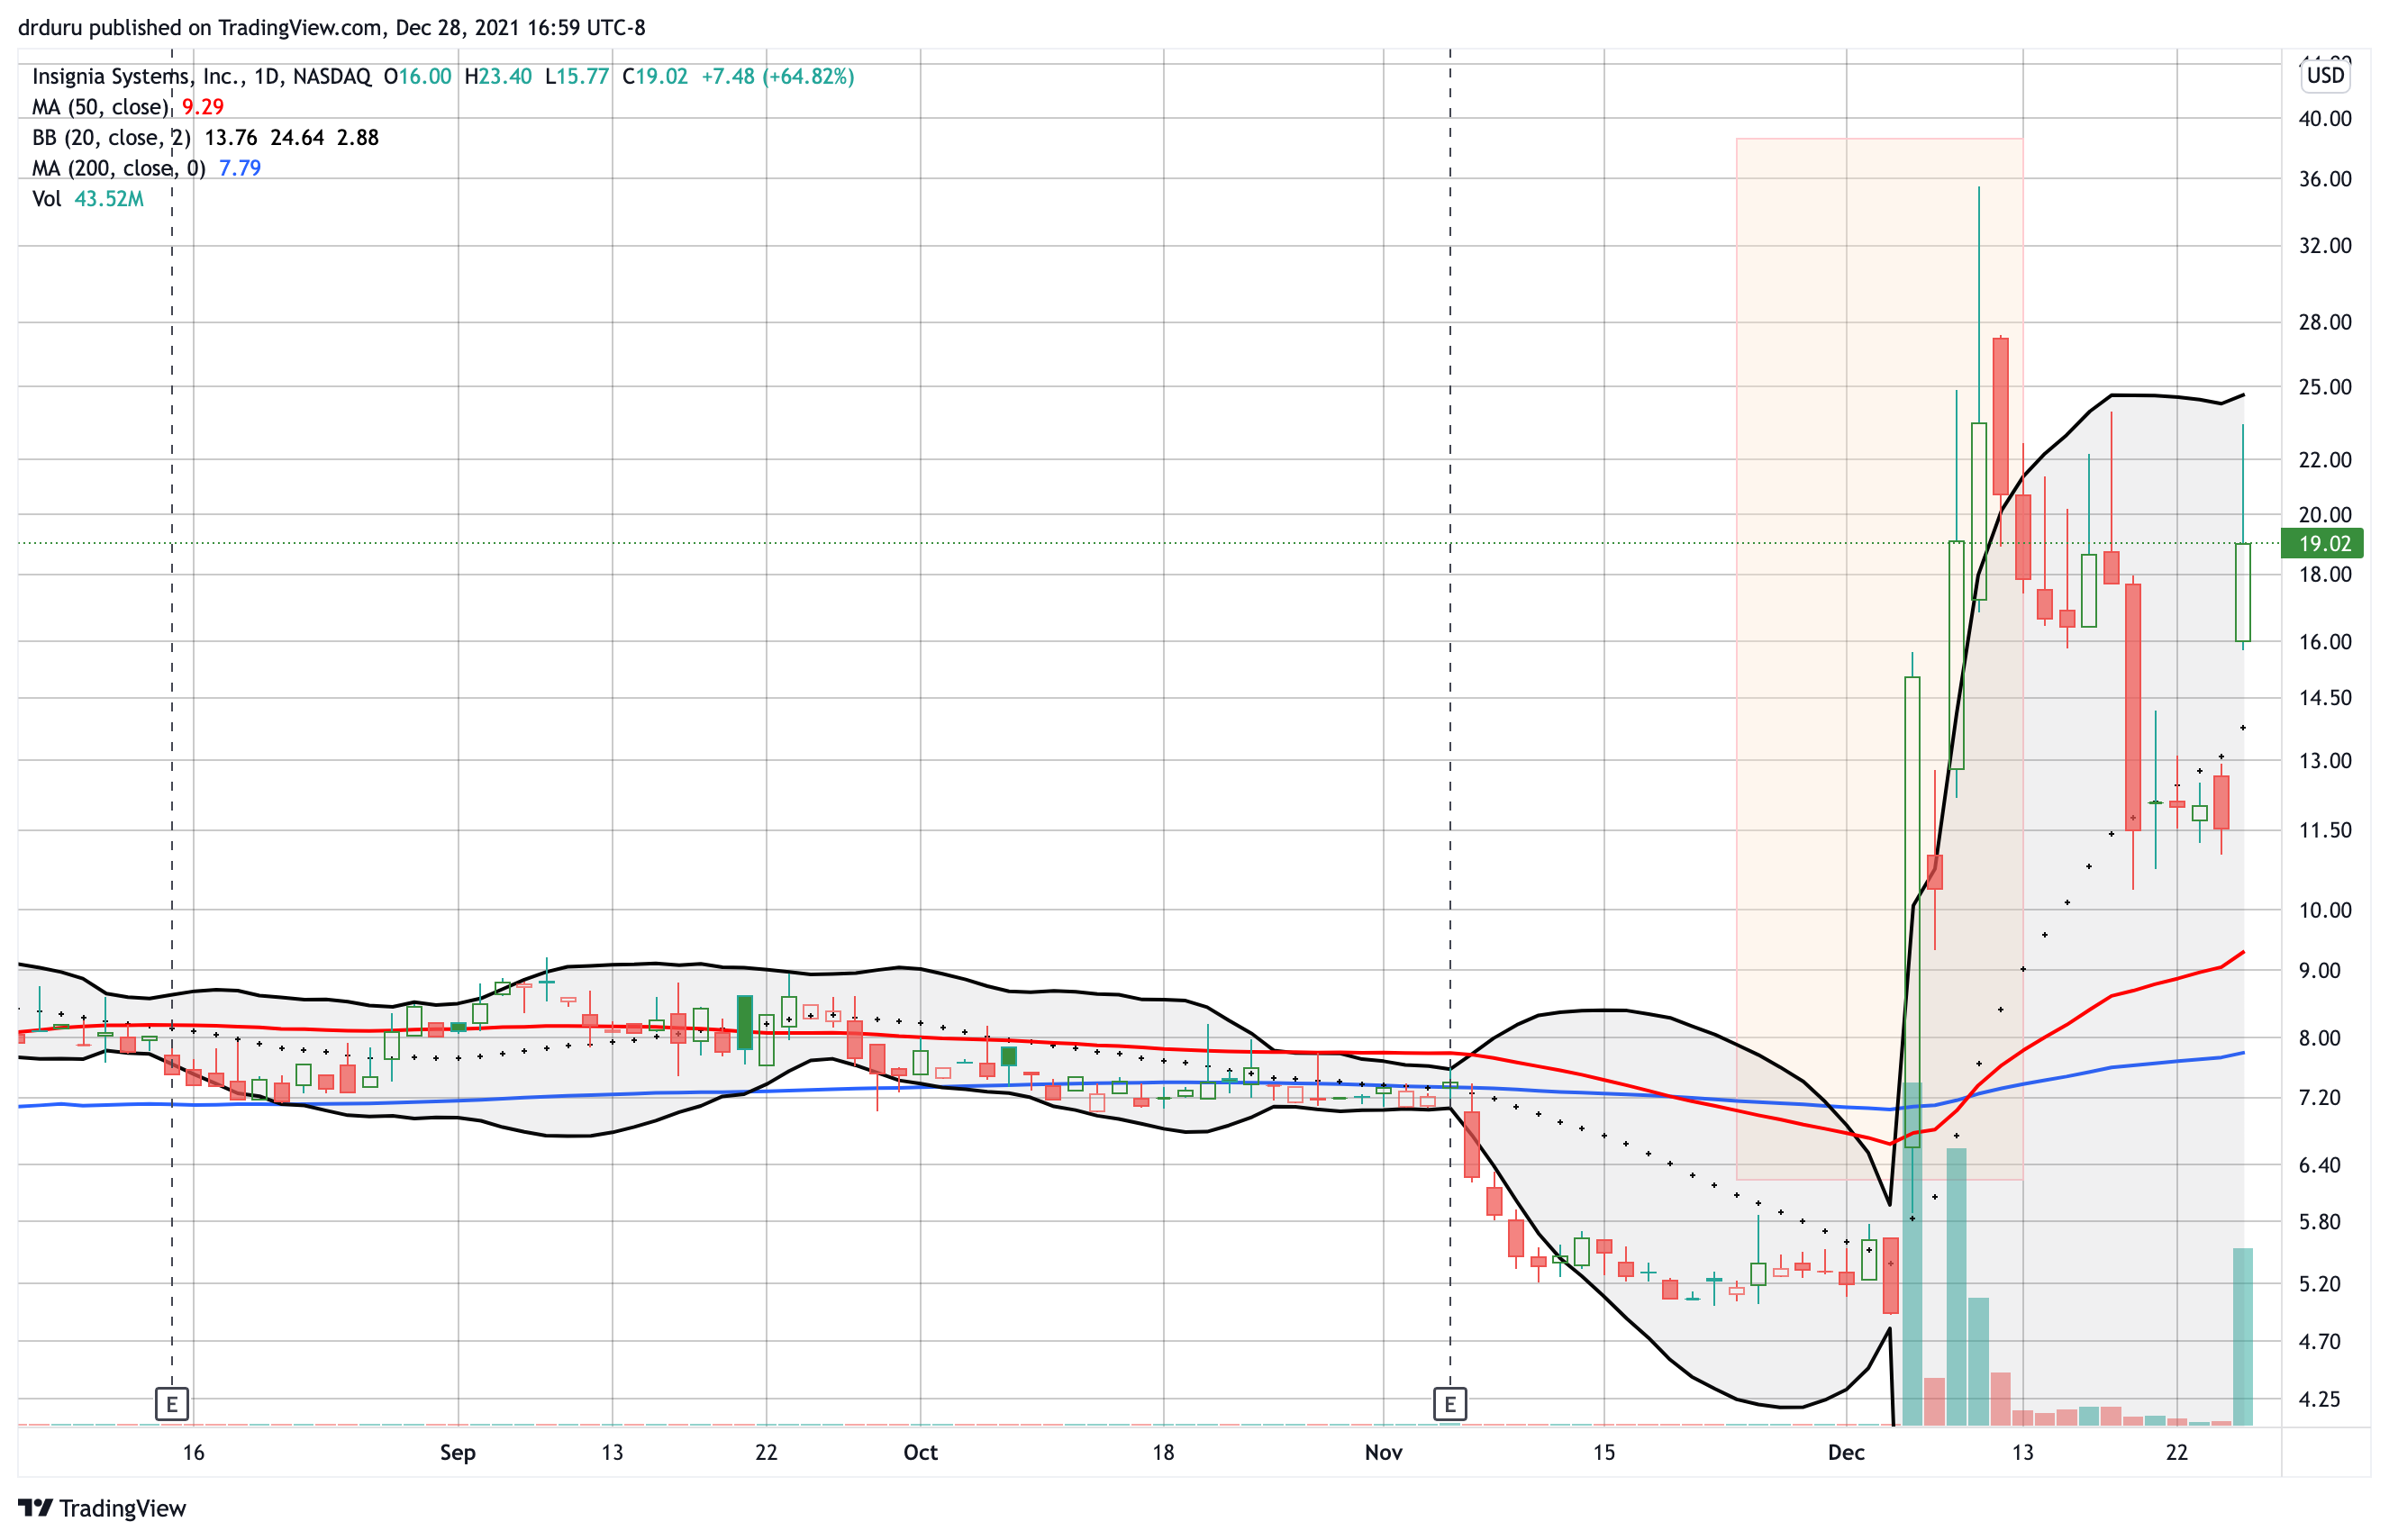
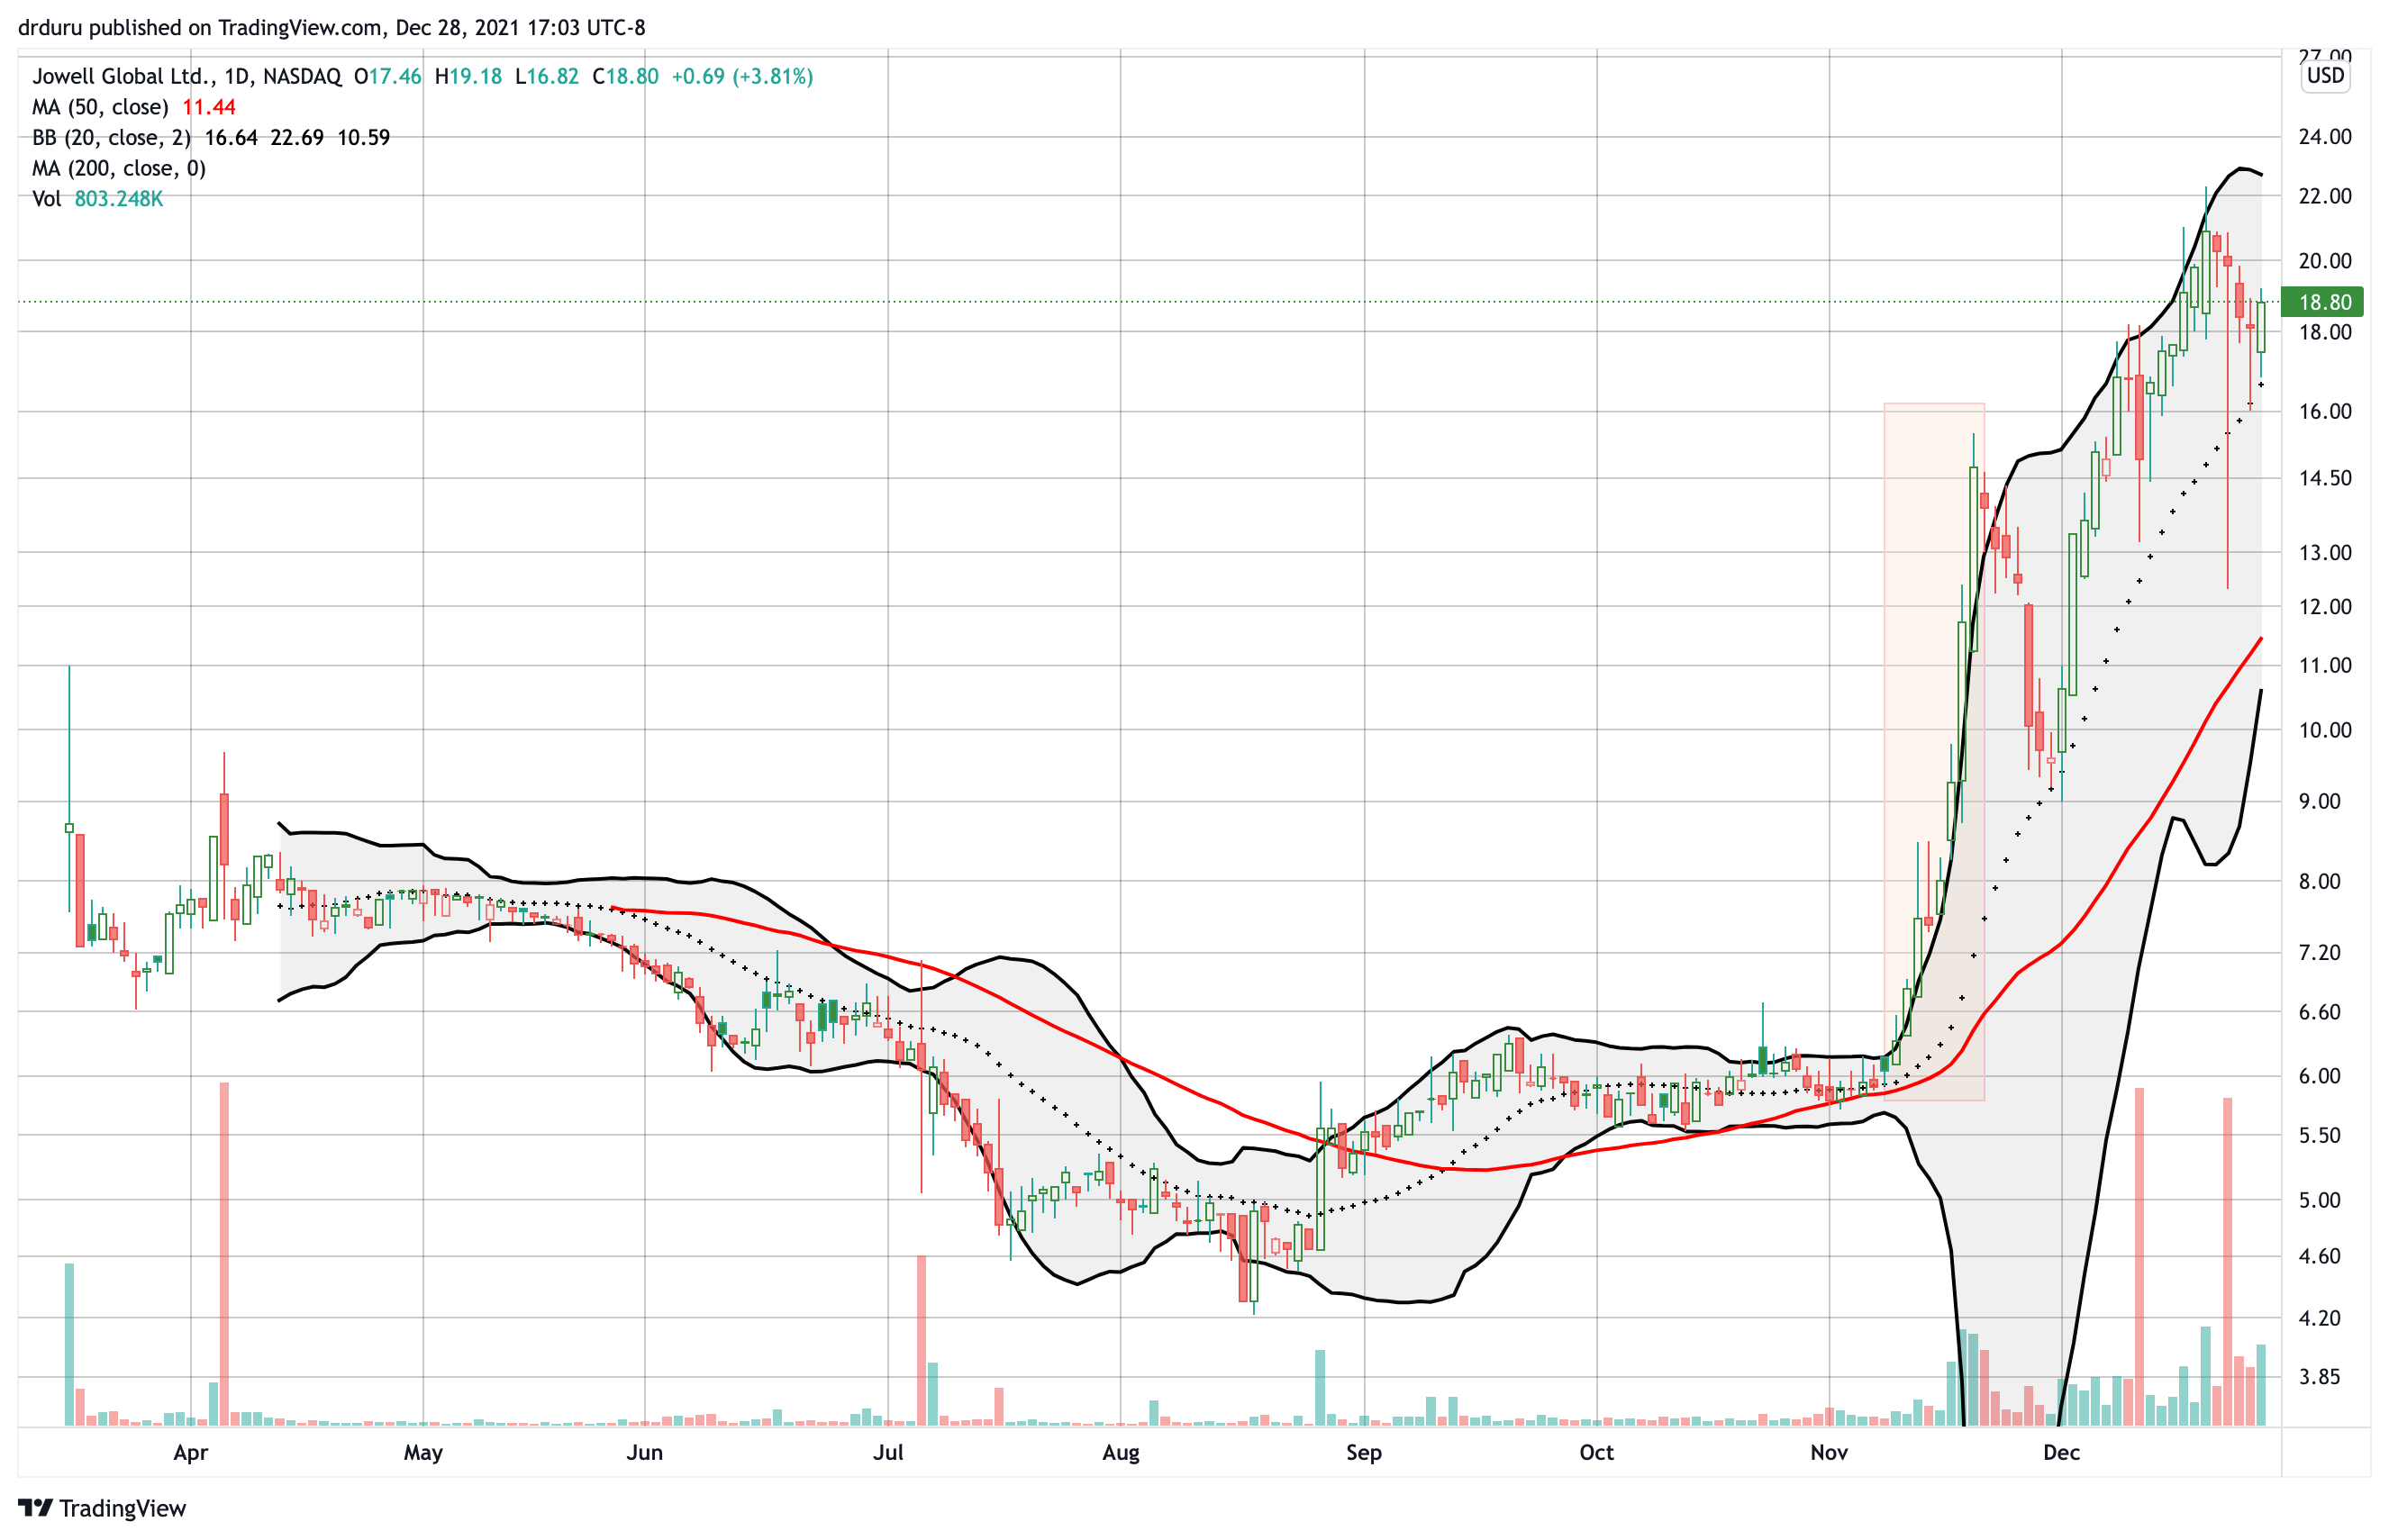
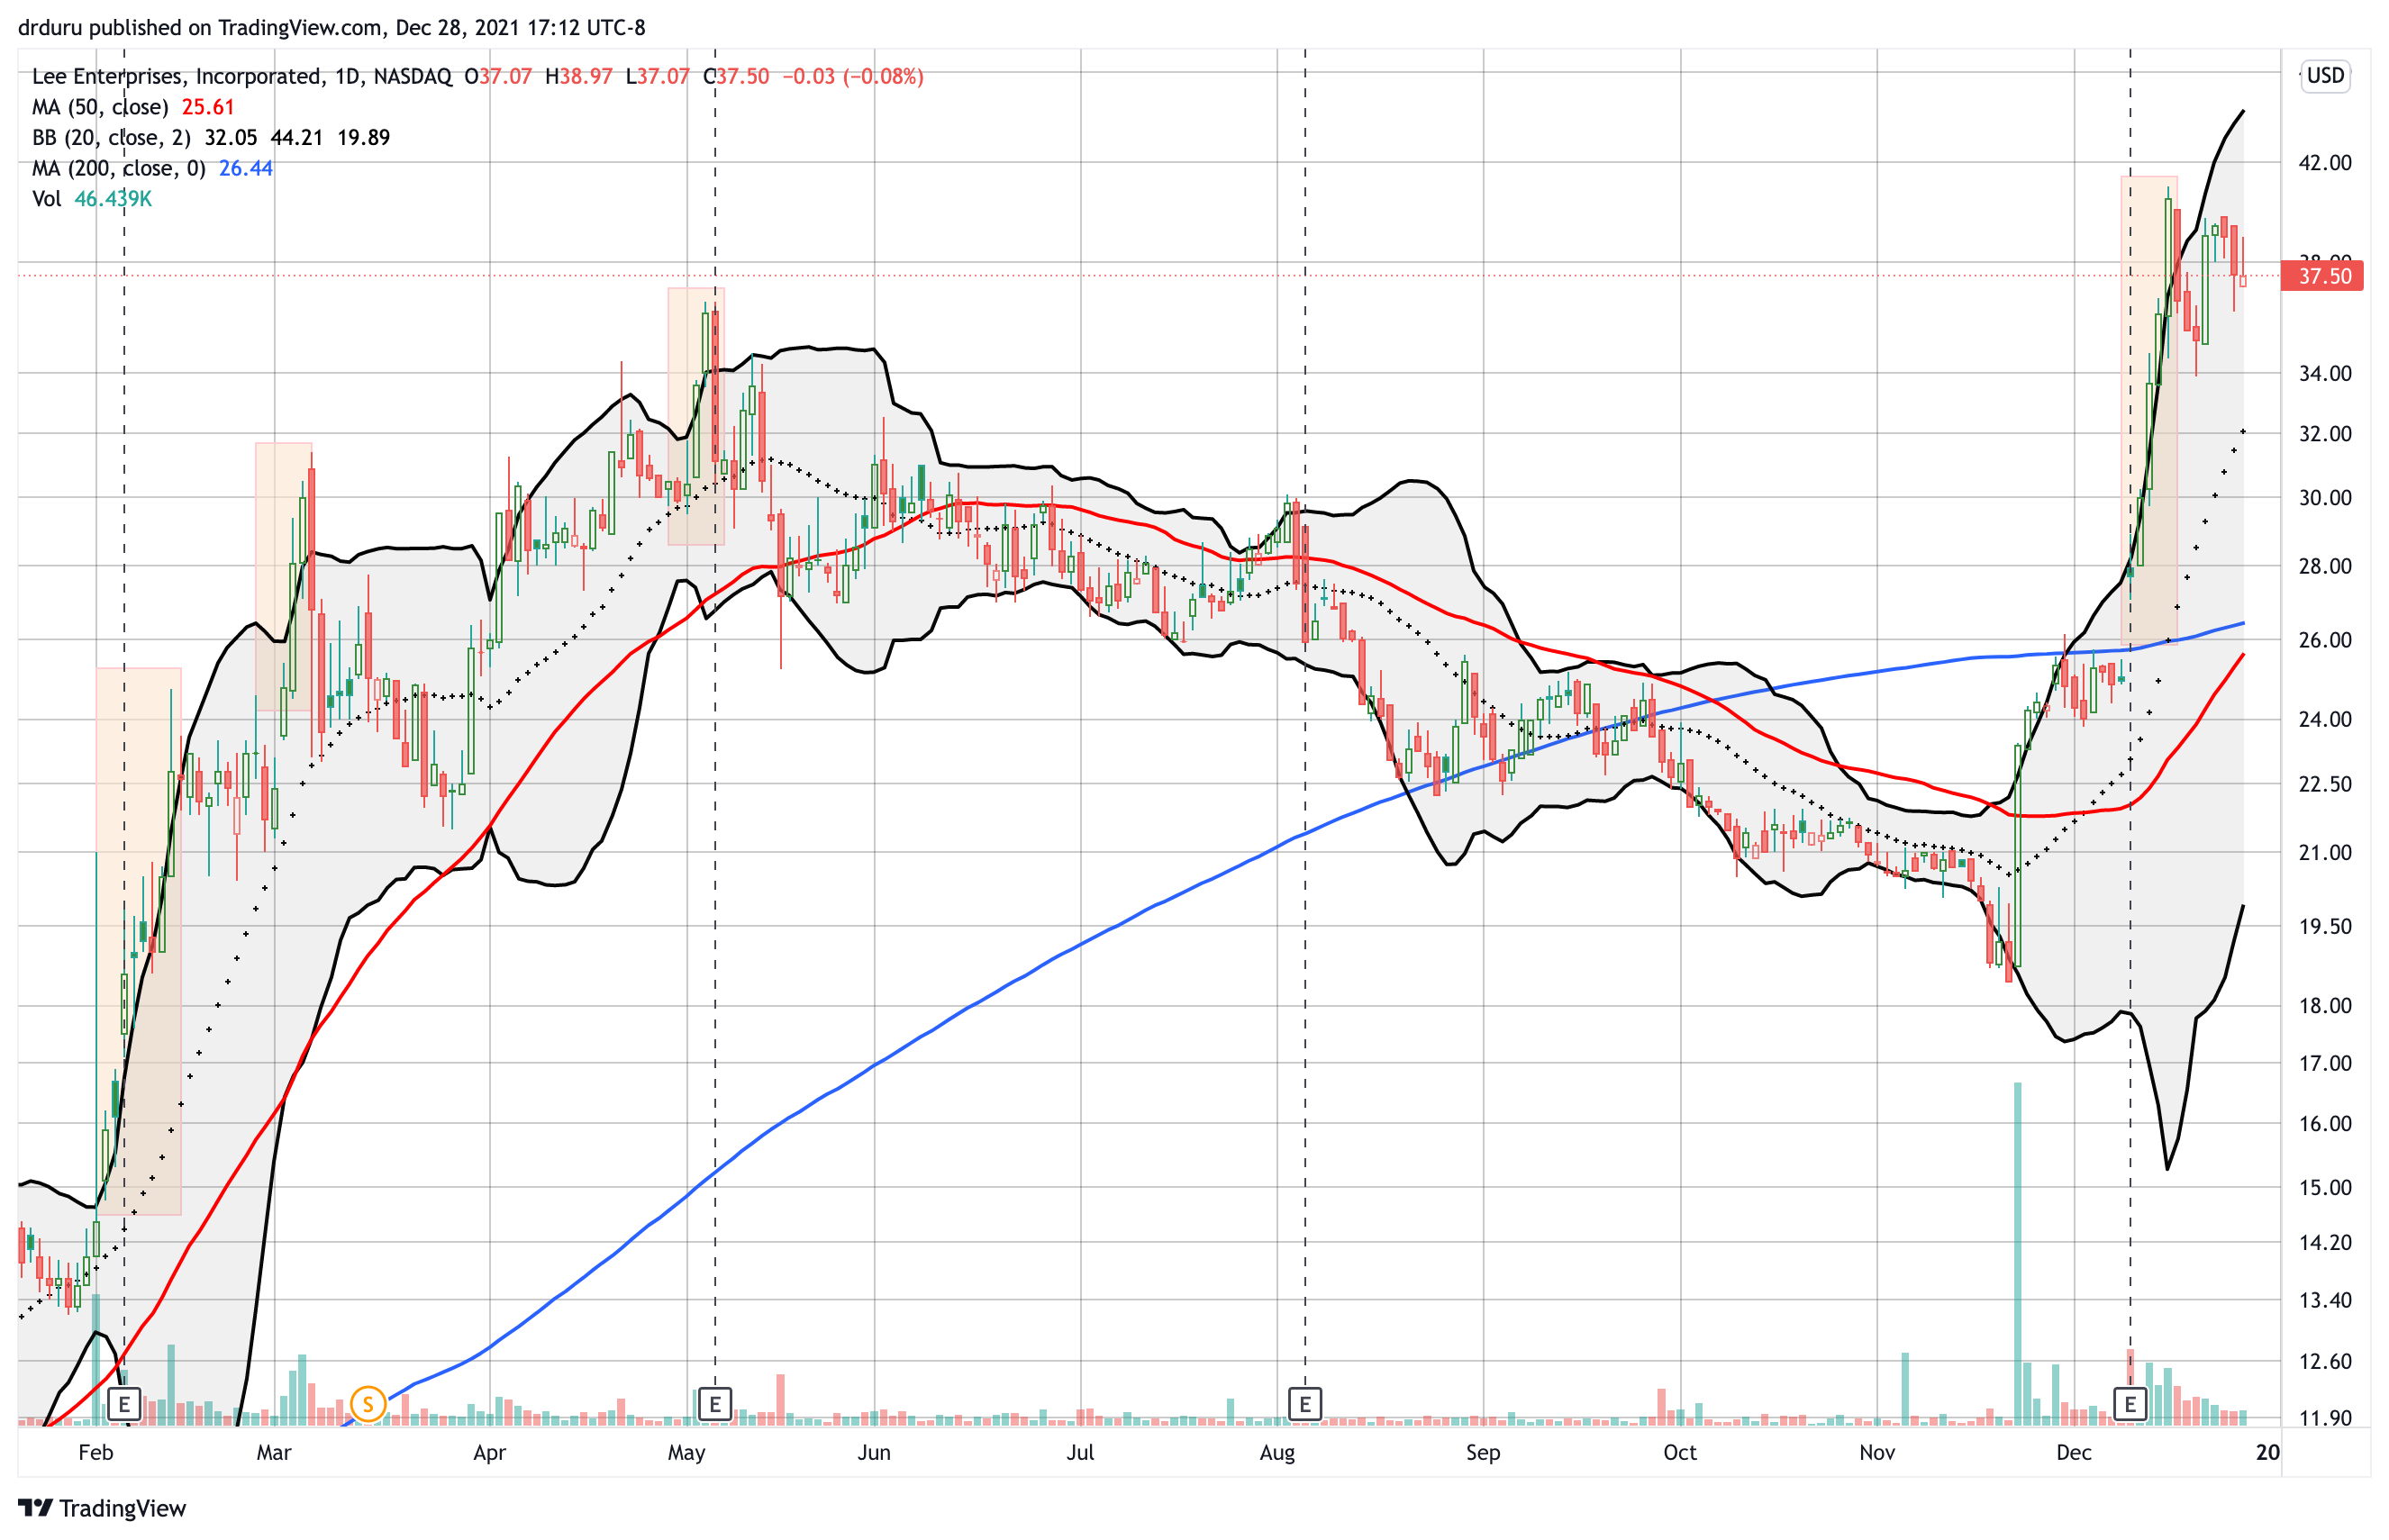
Notice how the upper Bollinger Band bends upward sharply, in a 45 degree angle or higher, once parabolic trading begins. The trading becomes more extreme the longer price follows that slope. Note well that no crystal ball exists to predict when the parabolic price run will end. Traders can only know that the run WILL end. The end usually comes with swift and large losses similar in magnitude to the previous price gains. LEE’s chart provides some exceptions to the rule. Apparently, LEE traders are generally hyperactive!
Parabolic Trading in the Currency Market
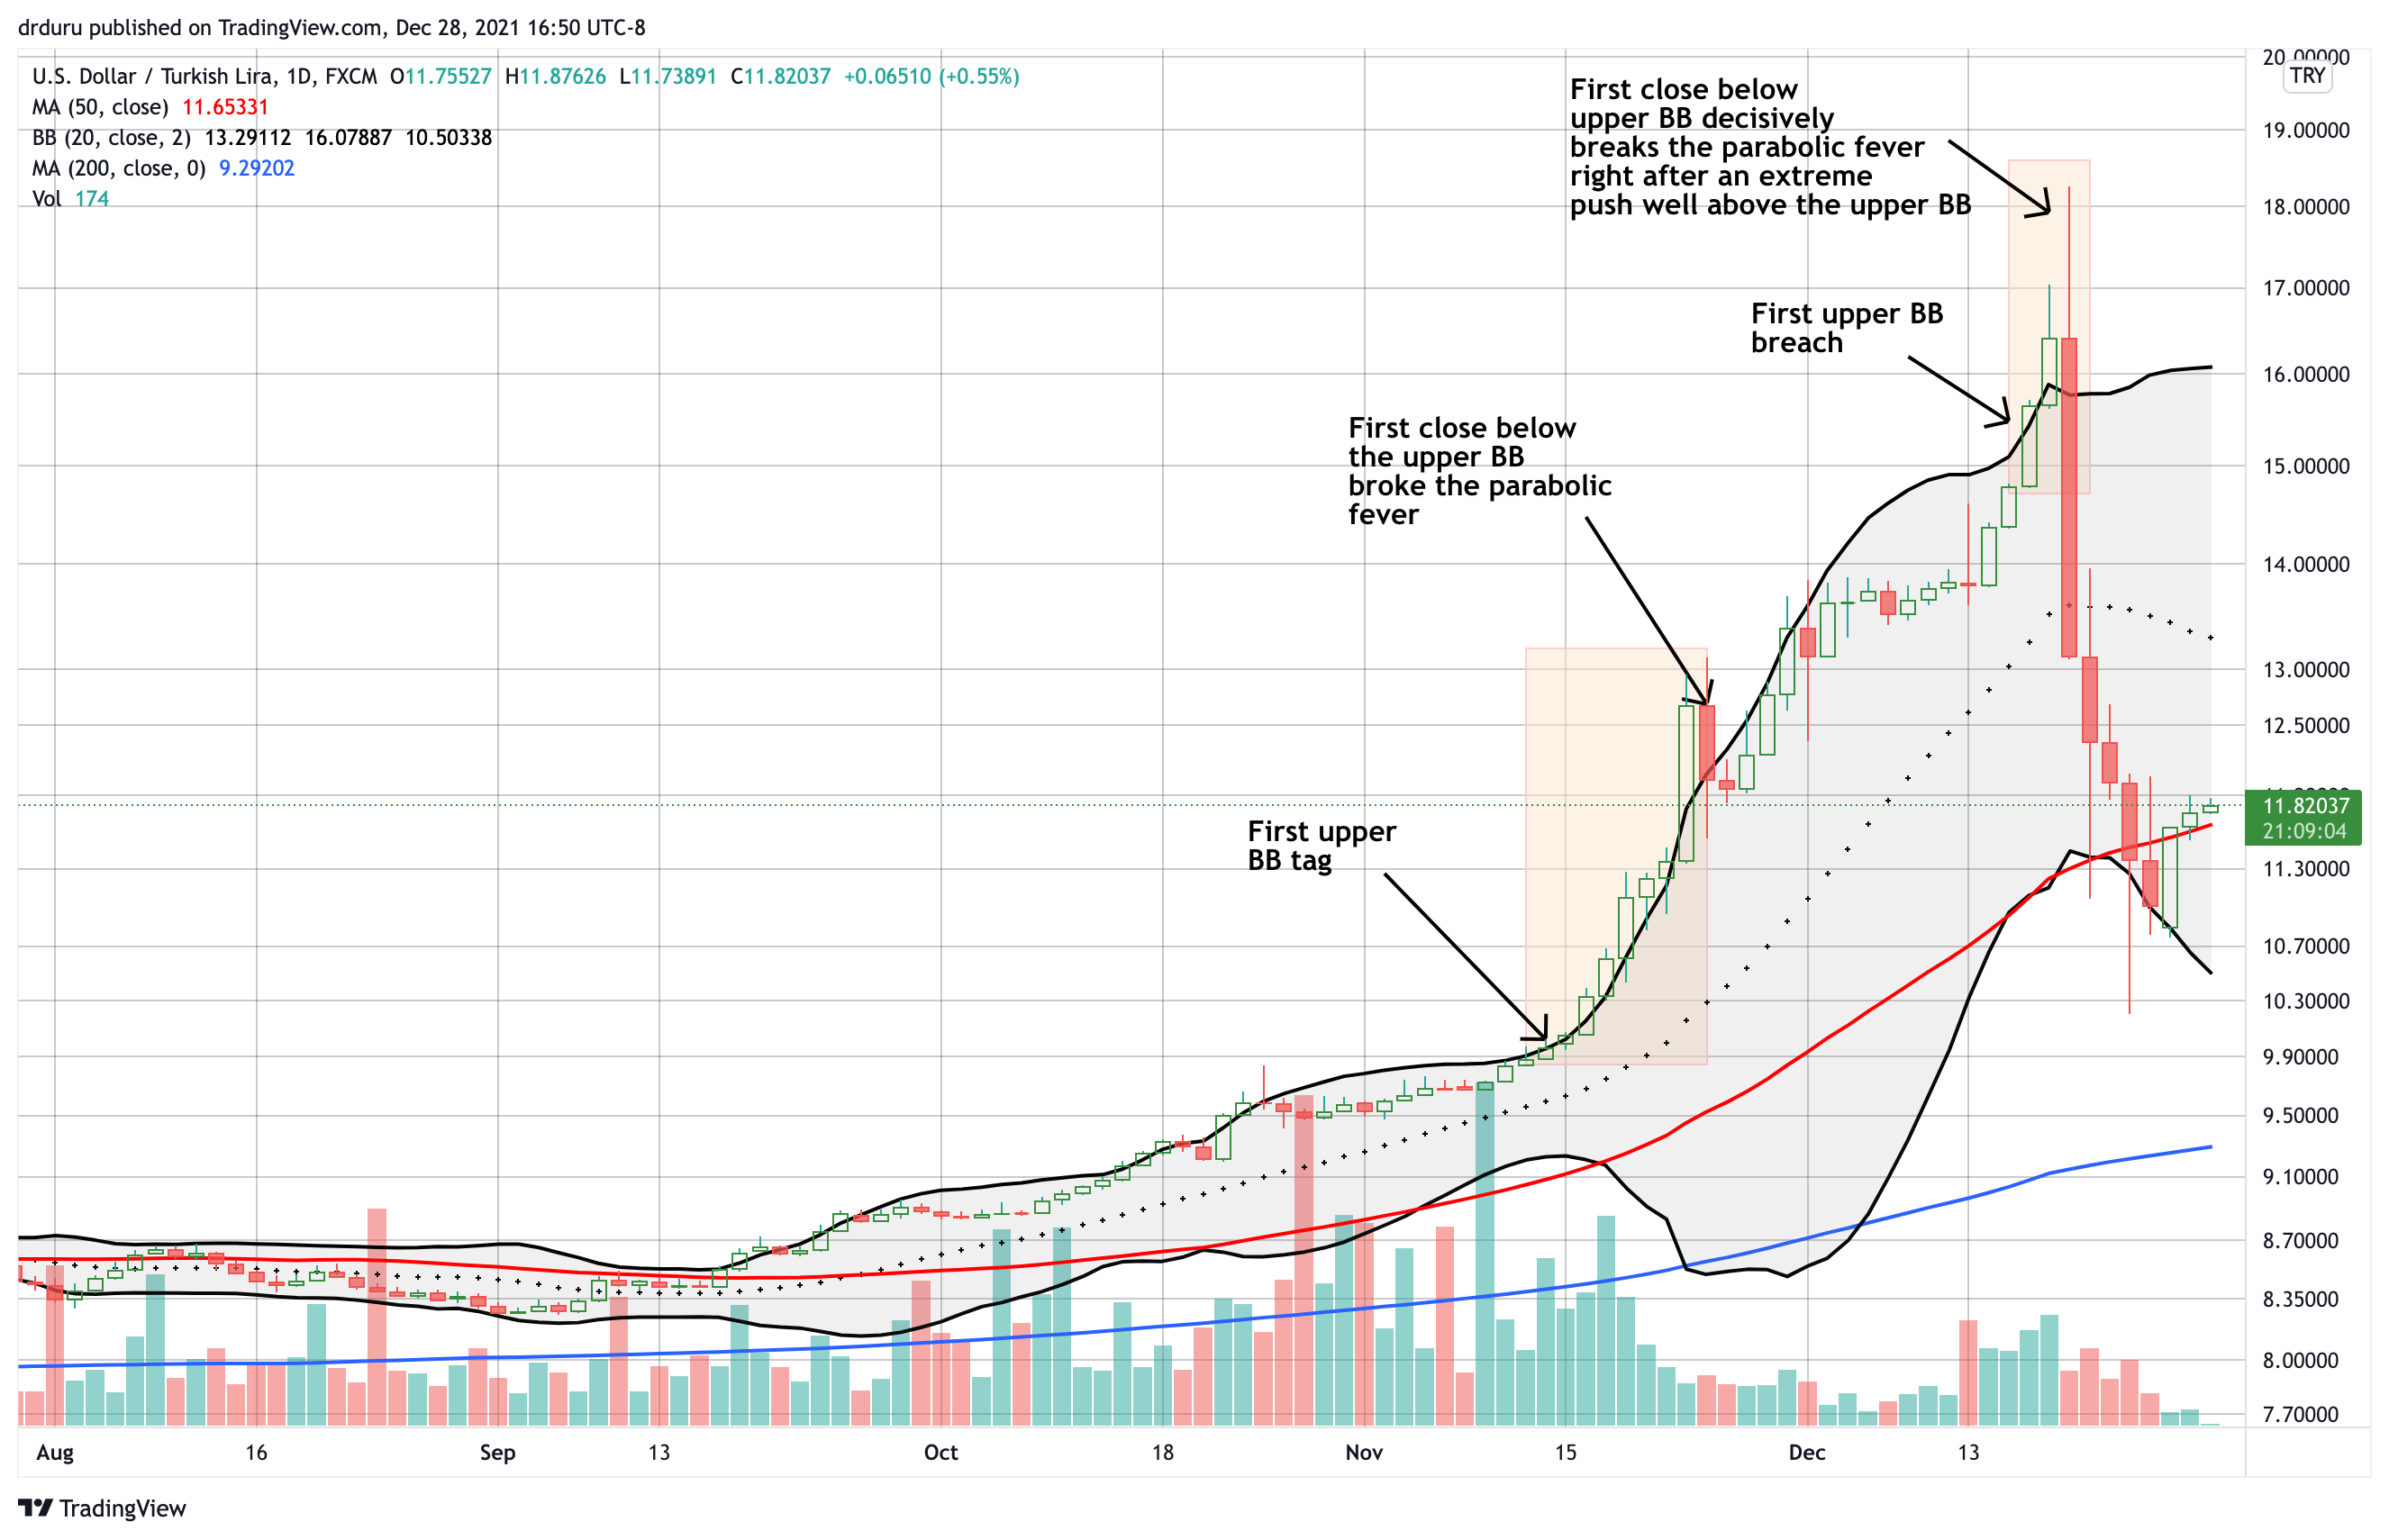
I recently covered the parabolic trading in the Turkish lira (USD/TRY). The price action delivered both dangers and opportunities. The chart below maps out the specific milestones in the trading. Currencies tend to move in much smaller increments than stocks. Accordingly, large percentage changes characterize some serious market dysfunction, instability, and/or dislocation. When the price extremes include parabolic trading, subsequent pullbacks can become even more dramatic than the price run-up.
To Buy or to Sell?
Trader preferences and risk tolerances help shape the decision to either try to ride a parabolic run-up or try to fade it. In either case, timing is everything. Risk management is a must. Traders should understand the fundamentals of the economic and/or business forces driving the trading action. Such knowledge strengthens opinions on when and how to time a trade against these extremes.
Even with the tools provided by SwingTradeBot and the definitions here, traders must still use judgement when identifying parabolic trading. No formula exists for the number of trading days, the magnitude of the extremes, or the density of the extremes in a parabolic run-up. In other words, the decision to buy or to sell will usually involve reactive and not proactive trading.
Above all, be careful out there!
Full disclosure: no positions
1 thought on “How to Identify Parabolic Trading in Stocks and Currencies”