Stock Market Commentary
A week ago, buyers did their best to push against topping stock indices by restarting overbought conditions. That overbought period lasted just 3 days as a Fitch downgrade of U.S. Treasury debt freshly cooled the summer of loving stocks. The resulting selling confirmed topping conditions and greased the skids of the stock market for more bad news. Poorly received earnings from Apple Inc (AAPL) increased the pressure on the stock market. An Apple topping is ominous given how much weight this 3 trillion dollar company carries around. The graph below shows how AAPL’s 4.8% post-earnings loss created a sharply bearish breakdown below the 50-day moving average (DMA) (the red line below).
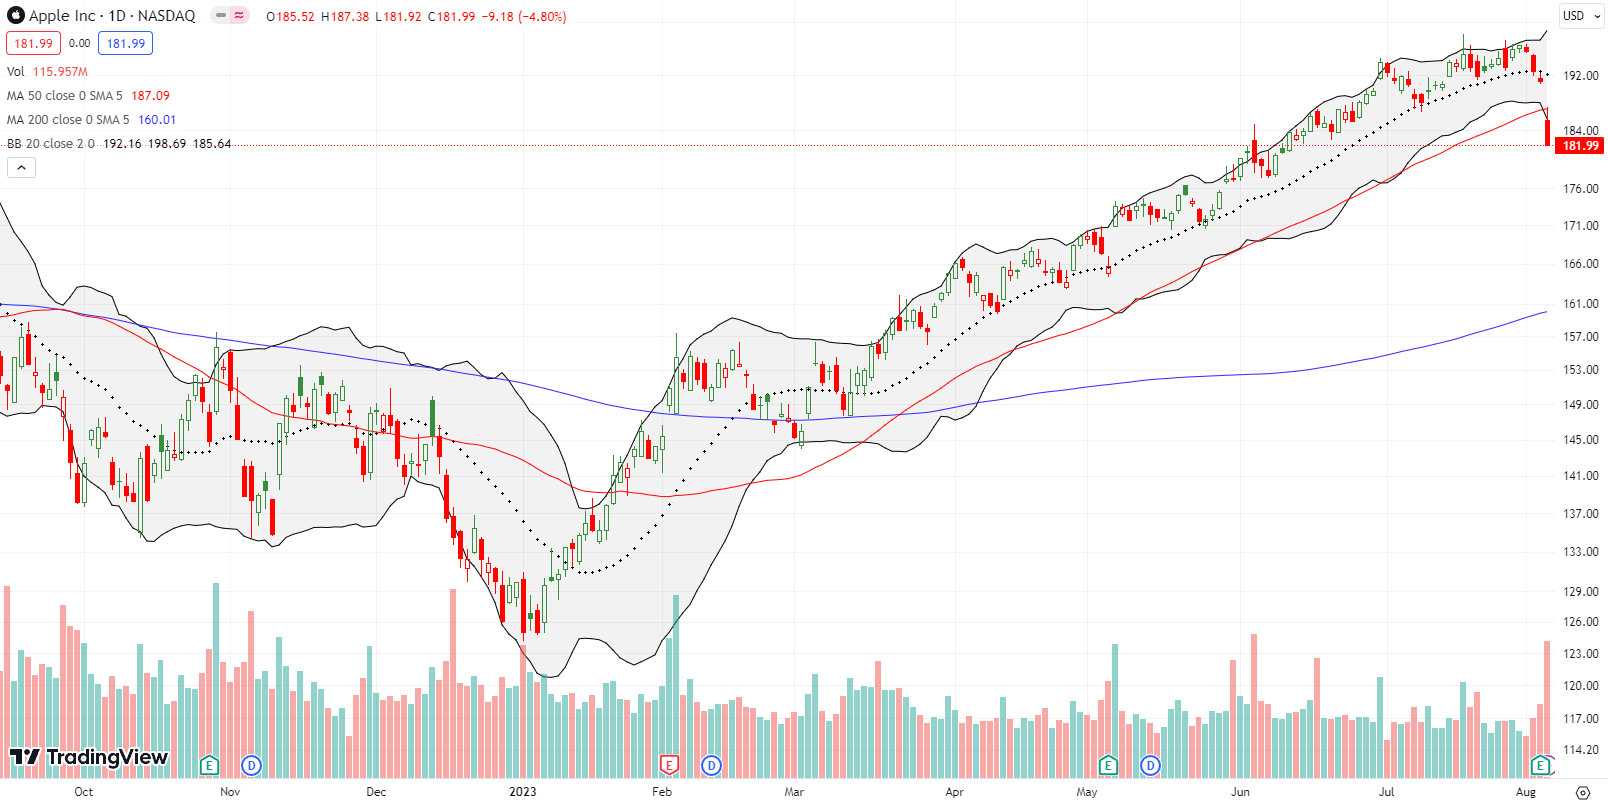
The earnings results for Apple were apparently weak enough to make investors and traders care about AAPL’s sky high valuation (the lofty 28 forward P/E and 8.0 price/sales buys little to no short-term growth). From a technical standpoint, the AAPL topping represents a dramatic end to one of the market’s most consistent uptrends marked by amazingly predictable bounces off 20DMA (the dashed line) support. Two weeks ago I traded off this pattern with a footnote warning about the topping pattern from the weekly chart. With the stock closing below the 50DMA, I put the Apple Trading Model (ATM) on the shelf.
The shockwaves from AAPL’s loss drowned out the news from the July jobs report. The lower than expected job creation helped to weaken the U.S. dollar (DXY) and sent bond yields dropping. Yet, these dynamics did not console traders and investors. Still, for now, it is possible that AAPL’s loss is a gain for some stocks, especially long neglected and beaten up stocks. Hand-wringing over whether AAPL becomes a source of funds or part of a broader exit from the stock market adds yet more tension to the stock market’s most dangerous months.
The Stock Market Indices
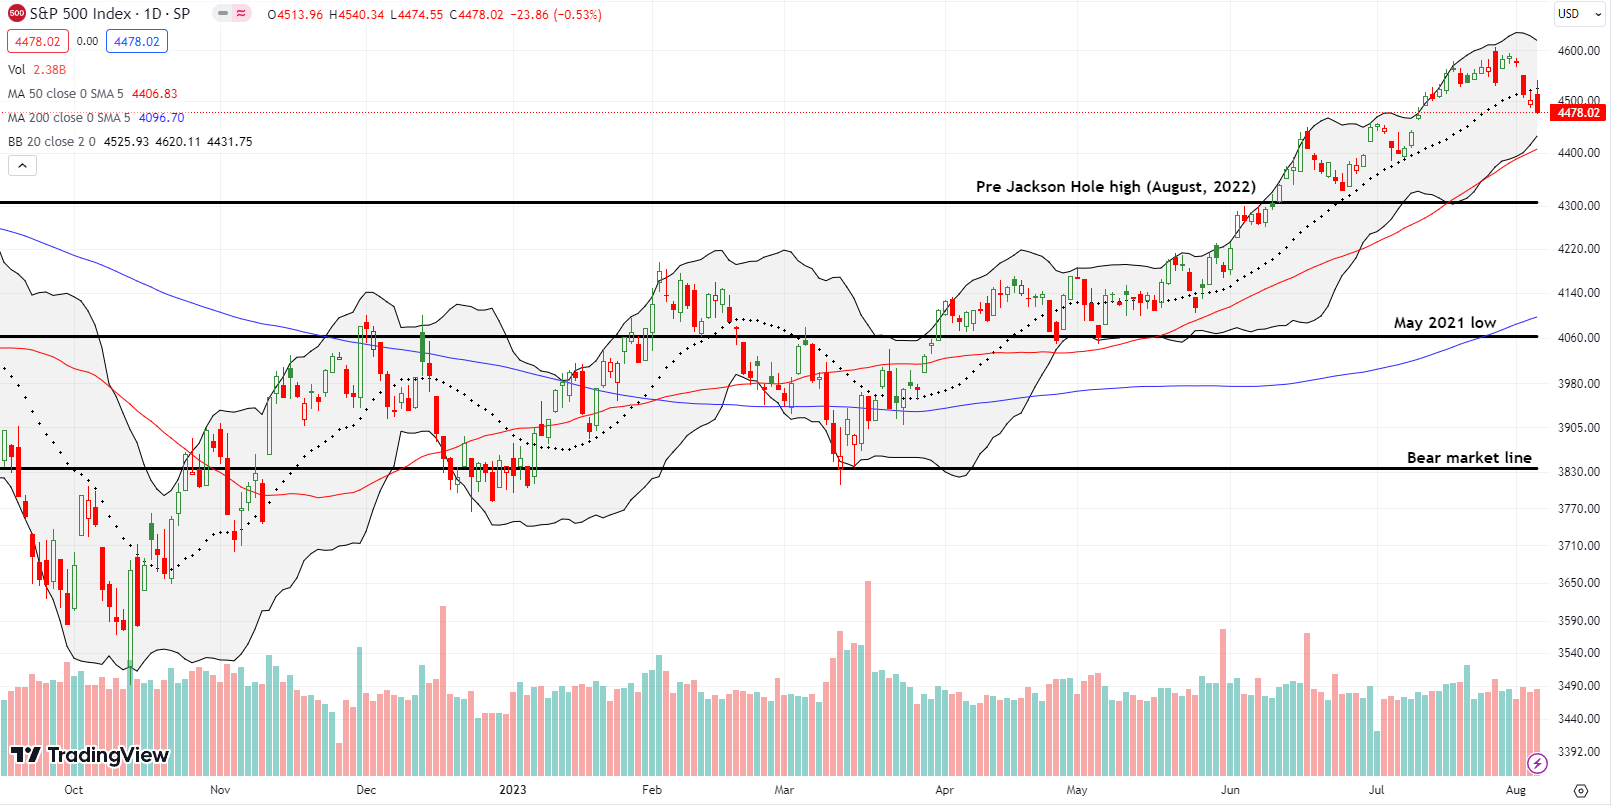
The S&P 500 (SPY) confirmed a 20DMA breakdown which ended a near 3-month uptrend. The index has now reversed its July breakout and looks ready to test its uptrending 50DMA support. The summer of loving stocks has cooled, but it remains in effect as long as the 50DMA uptrend holds up. Until then, the topping pattern from the earlier bearish engulfing pattern stands out as a potential major turning point for the stock market.
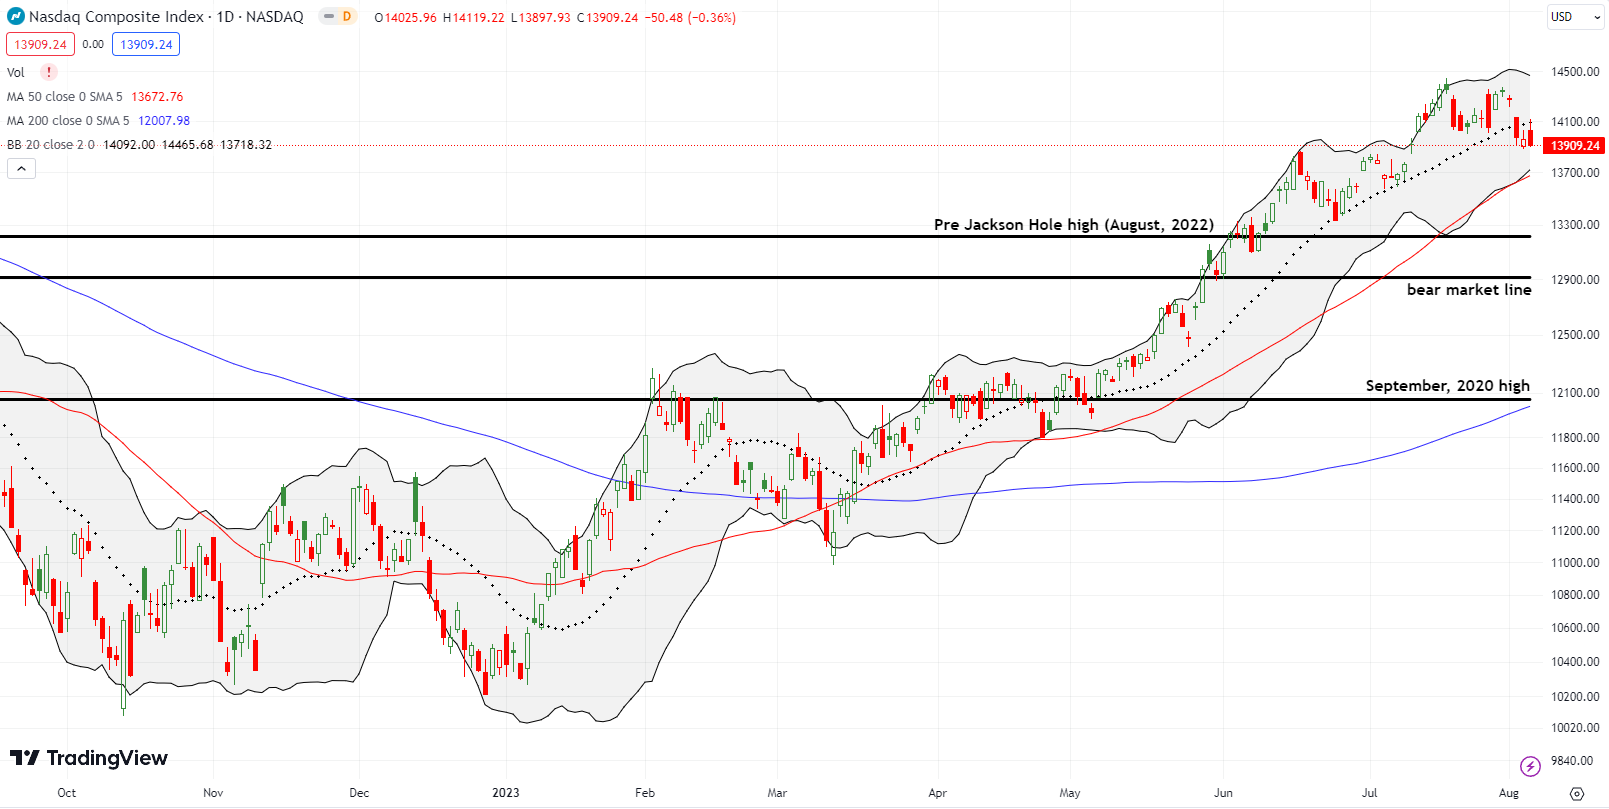
The topping for the NASDAQ (COMPQ) looks even more ominous than the S&P 500. The tech laden index first faded from a challenge of the July and 16-month high. A subsequent rebound also failed right at that high. Thus, the current 20DMA breakdown confirms a solid top in the NASDAQ until buyers prove otherwise. In the meantime, the NASDAQ finished reversing its breakout from July and looks ready to test its 50DMA uptrend as support.
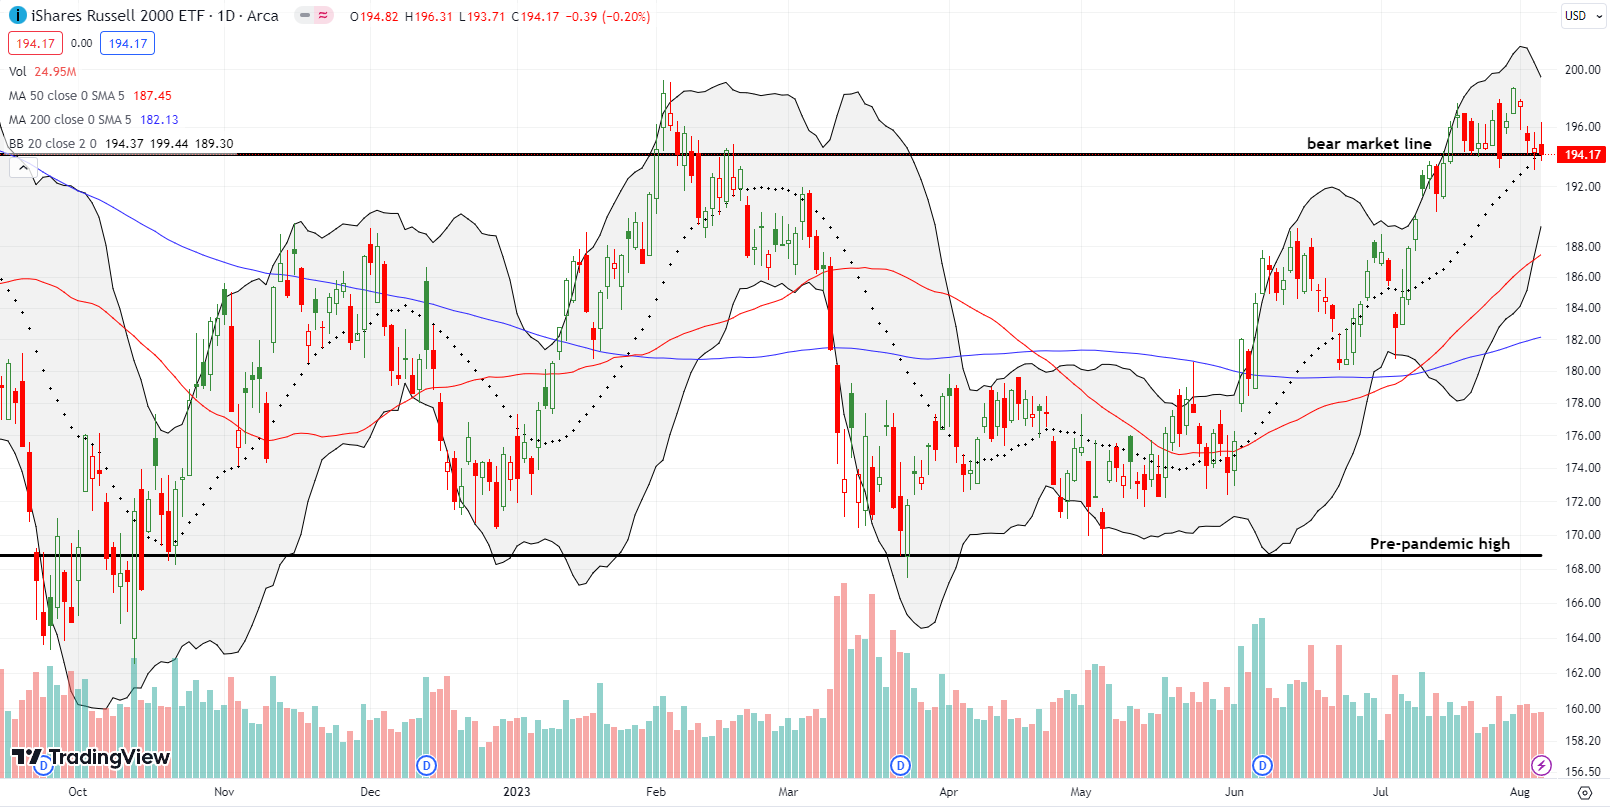
The iShares Russell 2000 ETF (IWM) printed its own topping pattern with a failure at the February highs. So unlike the S&P 500 and the NASDAQ, IWM has yet to print new highs for the year. So IWM continues to struggle with separating from its bear market line. IWM ended the week closed on or near this line for the sixth time in 3 weeks.
The Short-Term Trading Call with An Apple Topping
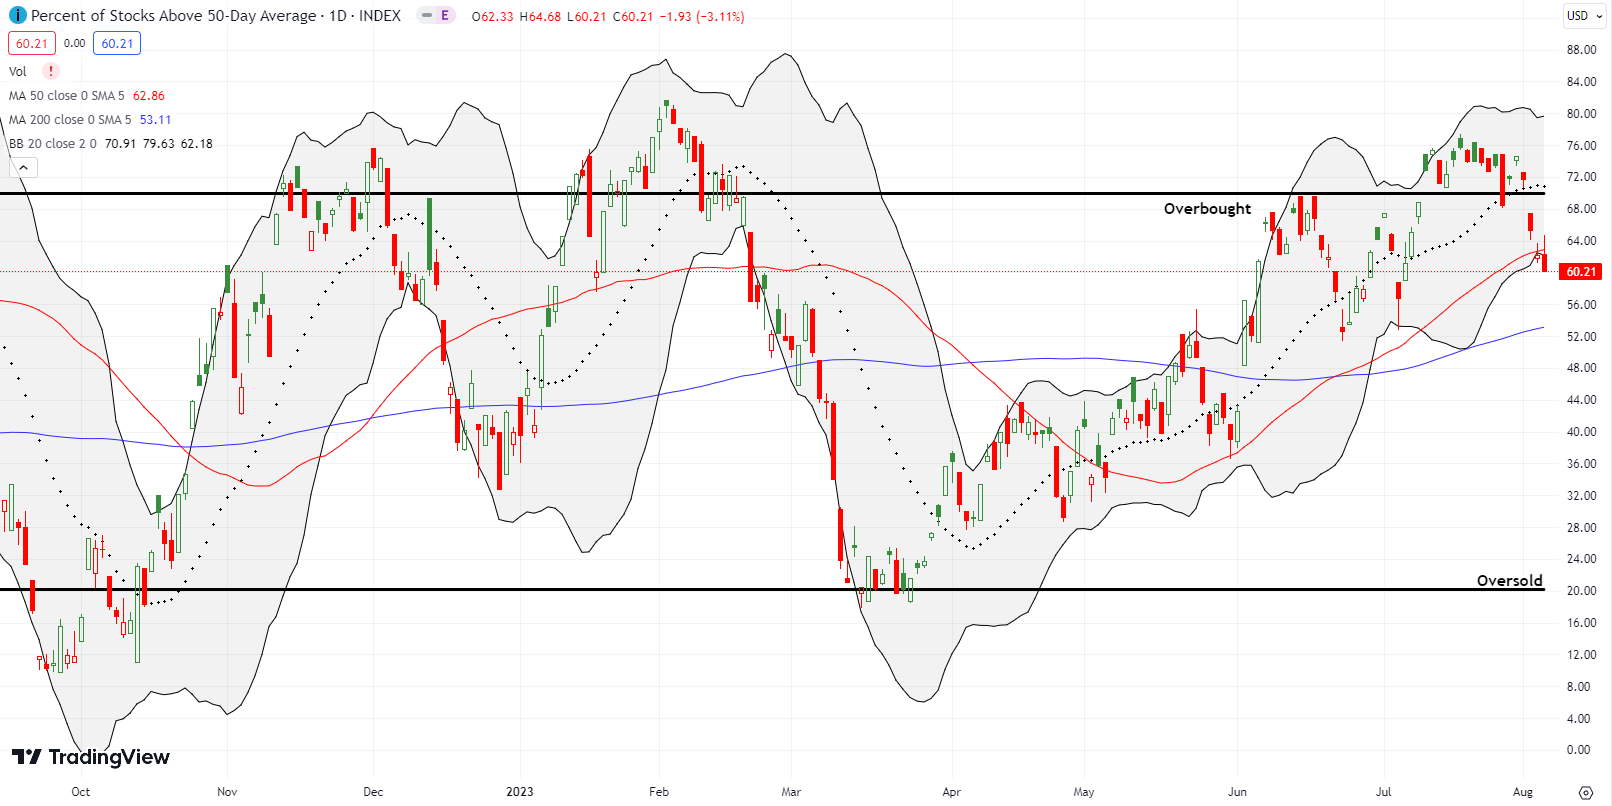
- AT50 (MMFI) = 60.2% of stocks are trading above their respective 50-day moving averages
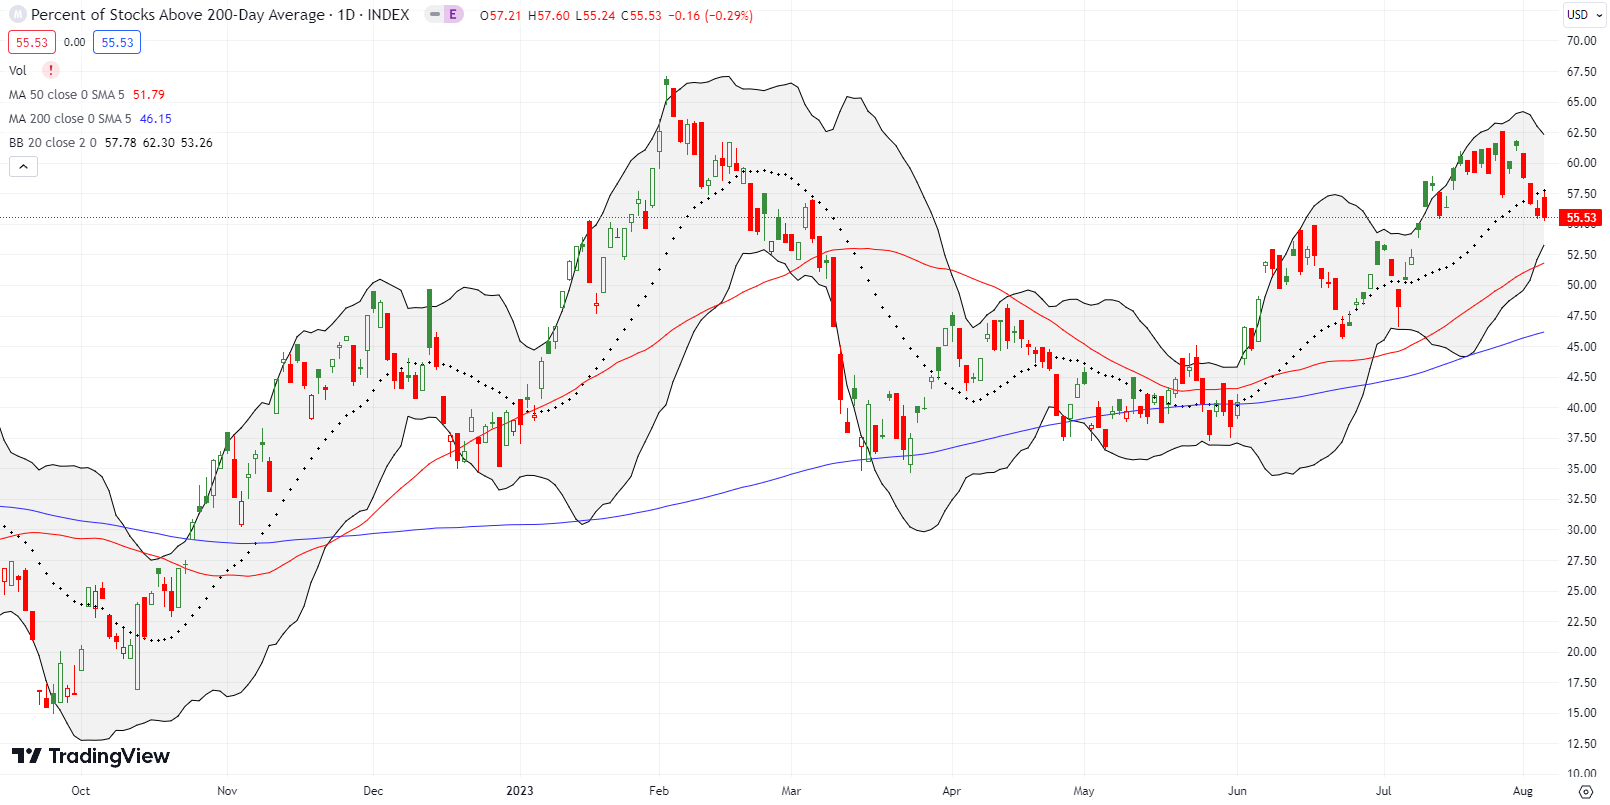
- AT200 (MMTH) = 55.3% of stocks are trading above their respective 200-day moving averages
- Short-term Trading Call: neutral
AT50 (MMFI), the percentage of stocks trading above their respective 50DMAs, dropped to 60.2%. I am surprised my favorite technical indicator did not end the week lower. While the Apple topping looks ominous, I saw a fair number of positive post-earnings responses that makes me think I can continue to ride pockets of bullishness while the rest of the market thrashes. Accordingly, I am staying neutral instead of flipping bearish as the AT50 trading rules dictate.
While Wednesday’s end of a 3-day overbought period should have flipped me bearish, I prefer to defer to the summer of loving stock’s general uptrend. I made the same decision after the end of the previous overbought period. I am much less confident of exercising discretion this time around! The negative and bearish catalysts are growing at a particularly dangerous time for the stock market.
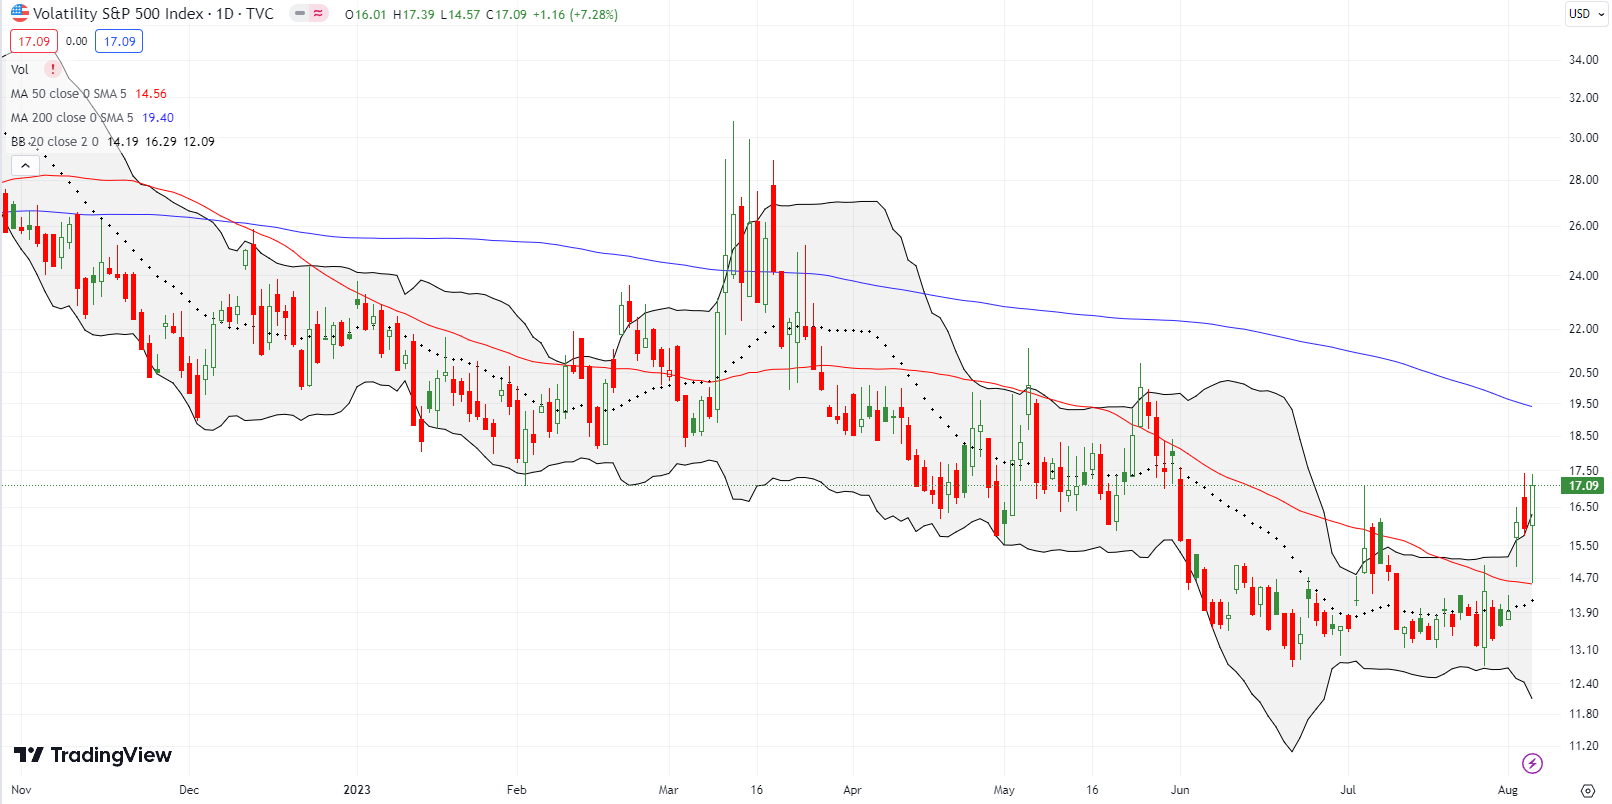
In a week that hit on many of my trading themes of the last several weeks and months, the volatility index (VIX) delivered on a fleeting opportunity. Per my fading strategy for the VIX I accumulated puts on iPath Series B S&P 500 VIX Short-Term Futures ETN (VXX) in the 2 days following the Fitch downgrade of U.S. debt. When the VIX plunged in the wake of the jobs report, I took profits. I simply thought the relief came from filling the news vacuum on jobs. I did not watch the market much from there and was quite surprised to see the VIX close with a 7.3% gain on the day. The VIX rocketed higher over the span of two hours shortly after it bottomed intraday.
Now, the VIX looks like it is bottoming with a higher high above a period of consolidation. Thus, I will only fade the VIX on an “extreme” push higher. Note well that a bottoming VIX supports the notion of a topping market!
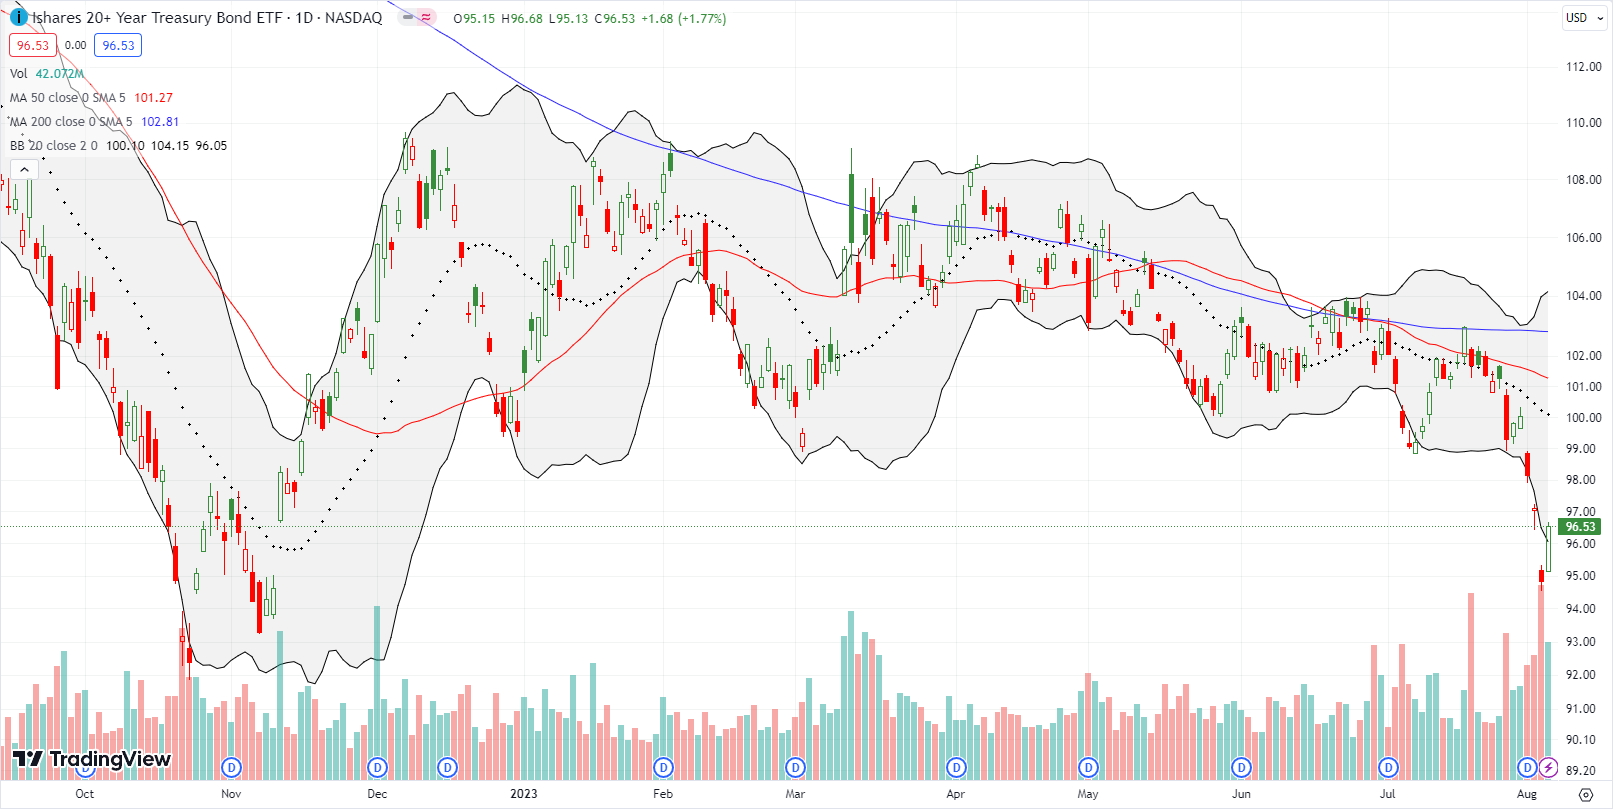
The wild swings in the bond market are likely helping to keep the VIX elevated. Fading iShares 20 Plus Year Treasury Bond ETF (TLT) is another of my recent trading themes given the need of the U.S. government to issue a massive amount of debt. I took profits on a put spread when TLT dropped to the previous low of 2023. The obligatory rebound lasted just two tepid days. The 1.9% gap down the next day caught me flat-footed.
After the Fitch debt downgrade pushed TLT down another 1.1%, I chased TLT with another put spread. The next day’s 2.3% loss was extreme, especially with the trade well below the lower Bollinger Band, so I took profits. Friday’s rebound nearly filled the gap and has me preparing to fade TLT all over again. I am hoping for an extension of the rally to get a better price for fading.
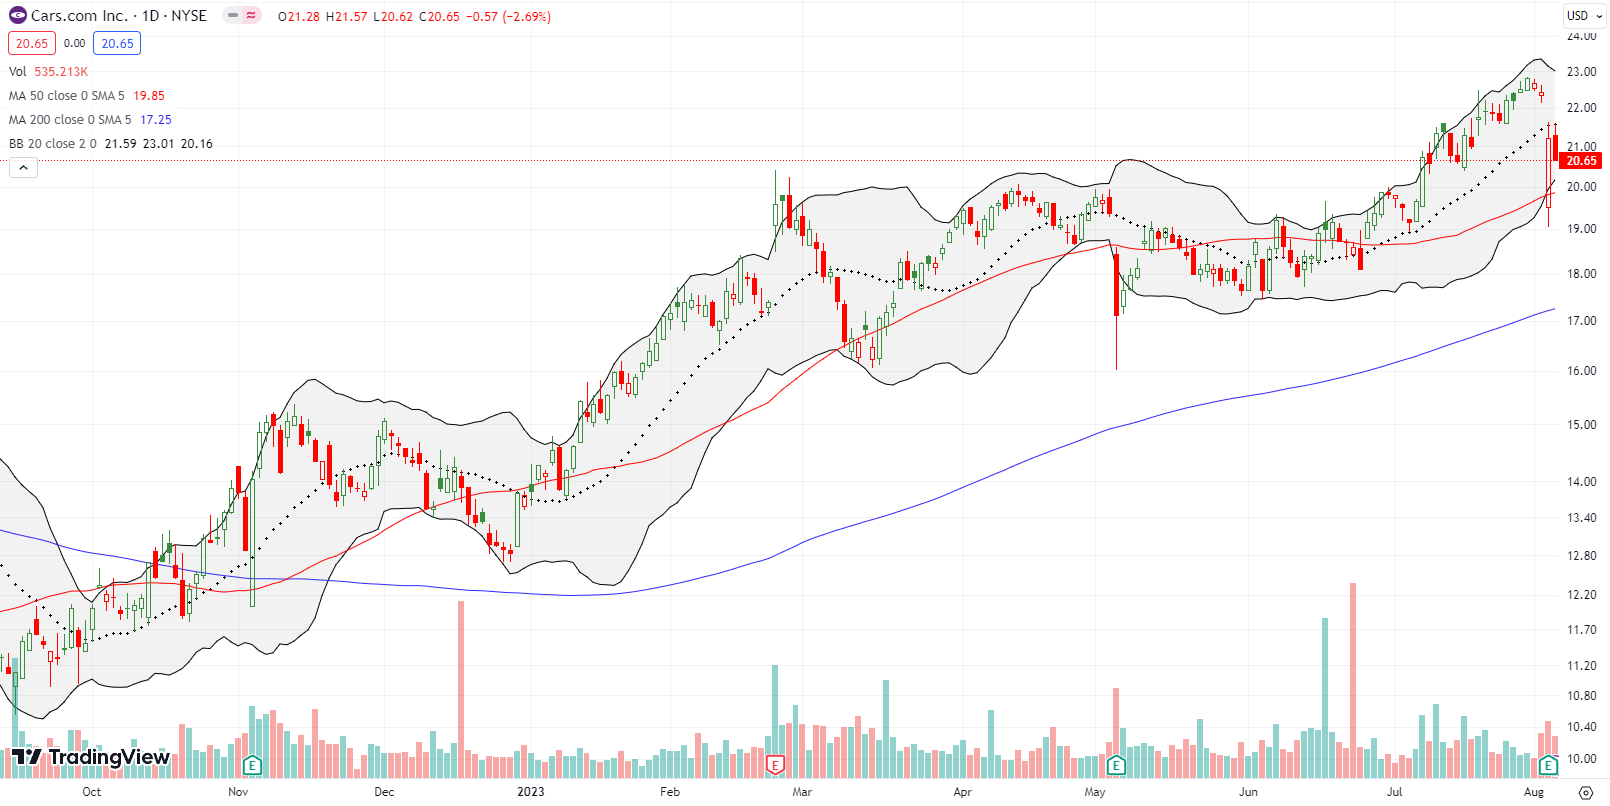
The trade in used car sellers has been one of many big surprises this year. Cars.com Inc (CARS) was up around 67% year-to-date ahead of earnings. The stock plunged post-earnings last week, but buyers put in their best effort to defend 50DMA support. Yet, fresh selling on Friday, a 2.7% loss, cast a shadow on the sustainability of the rebound. CARS is only a buy for me after a close above its high for the year. Otherwise, I am looking to an eventual test of 200DMA support.
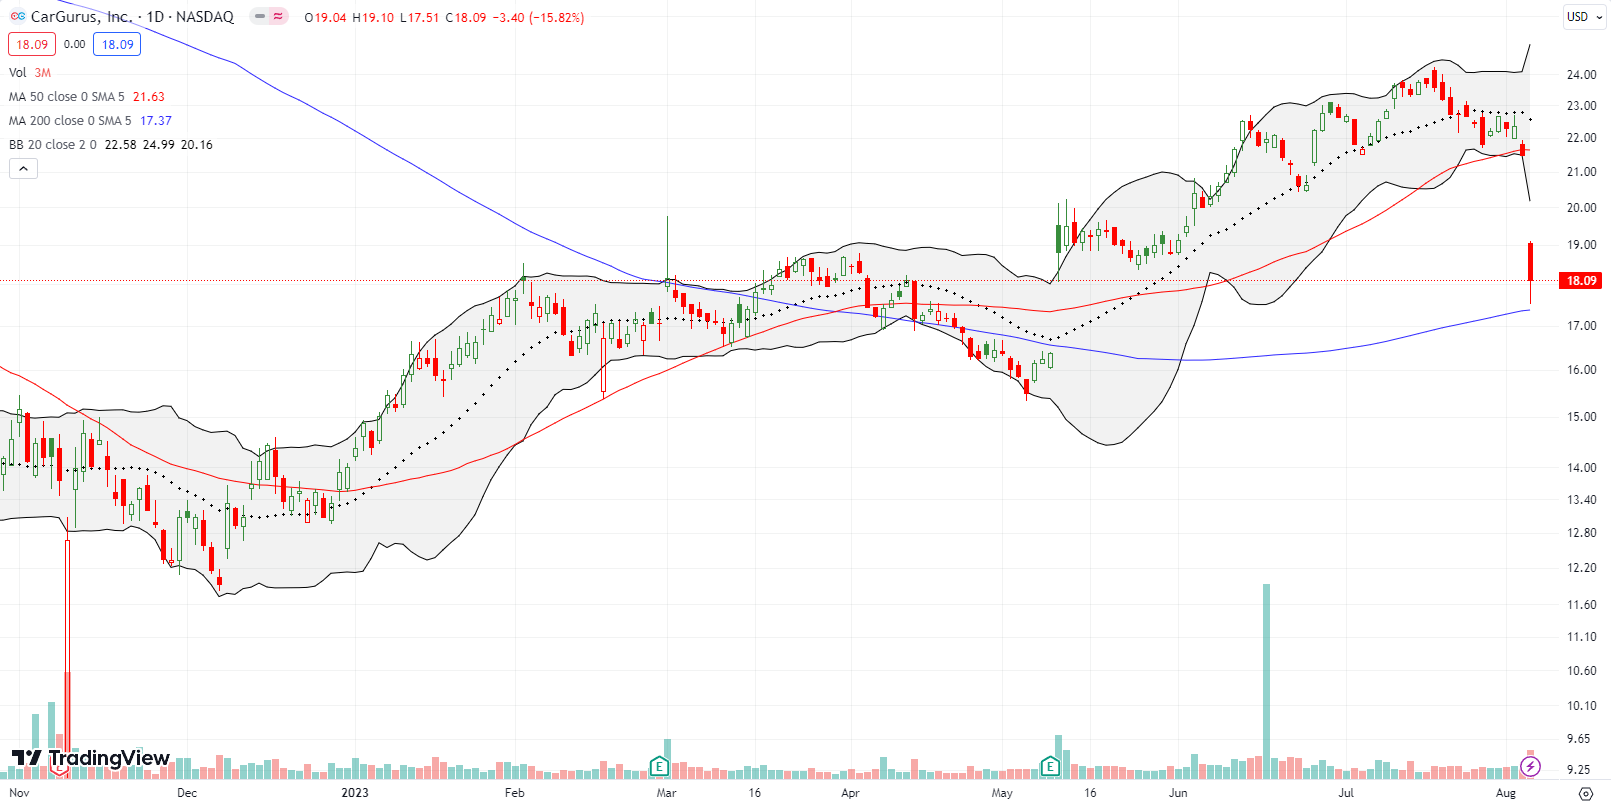
CarGurus, Inc (CARG) was one of the many stocks I sold as I derisked my holdings in the wake of the stock market’s topping. I wanted to preserve profits after the stock confirmed a 20DMA breakdown. The prospect of 50DMA support holding did not deter me. The breach of 50DMA support would have been my final signal if I had continued to hold it. The next day, CARG plunged 15.8% after announcing a delay in delivering its next earnings report. I think the plunge was exaggerated by the market’s bad mood on the day. CARG is now over-extended will below its lower Bollinger Band (BB). The tentative bounce of 200DMA support is a small positive.
If CARG had announced the new date for earnings, I would have dared to trade CARG for a bounce at least back to the lower BB. However, I consider the stock a no-touch given the potential for CARG issuing an earnings warning alongside the news of the rescheduled date.
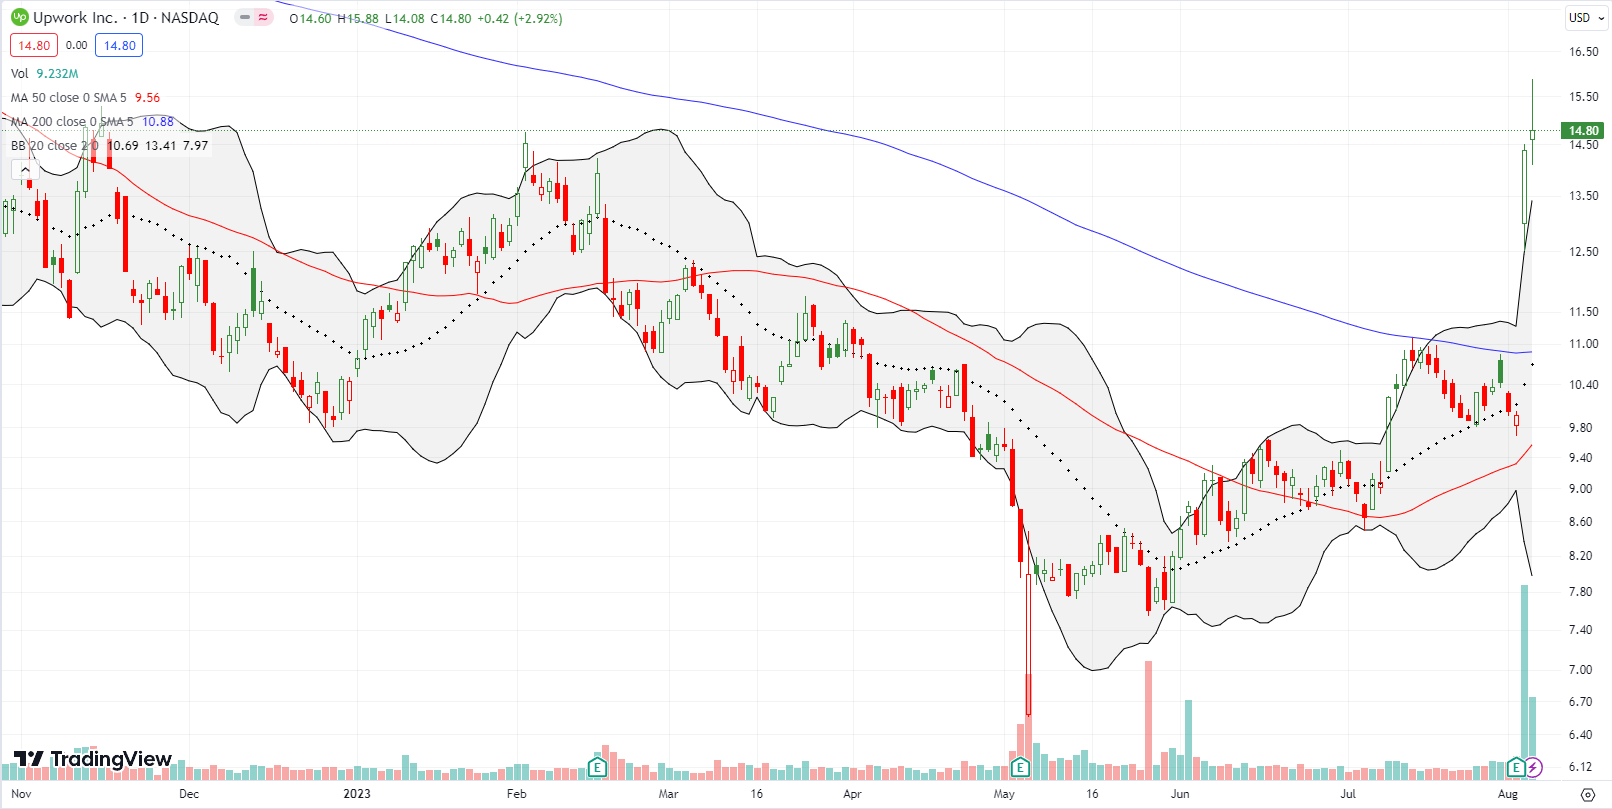
Upwork Inc (UPWK) is the opposite side of my de-risking efforts. I made the case for getting back into UPWK in early June even though the stock was still below its downtrending 50DMA. The stock churned for 5 weeks until it finally challenged 200DMA resistance. I promptly sold to lock in profits. I thought the exit was validated by two subsequent failures at 200DMA resistance. So all I could do was marvel from the sidelines as UPWK soared 44.2% post-earnings. This move is amazing, but it barely took UPWK over its high for the year. UPWK is (was) the quintessential beaten up stock; it remains a shell of its former $60+ self.
Upwork seemed to excite investors by increasing revenue and earnings guidance, a positive turn in fortunes. Perhaps more importantly, the company rolled out news about AI initiatives and job opportunities in its letter to shareholders. I am posting the extended content given its importance to the generative AI trade.
“One of the most important and diverse growth opportunities for Upwork is in the AI space, and we are are delivering on this opportunity by serving clients with a singular destination for sourcing the full breadth of AI-focused talent they need; premiering new AI-powered features for discovering and matching with expert talent across every category of work; and enabling talent on Upwork to access the most modern generative AI tools to supercharge their productivity and quality of work. Collectively, these steps move our customers closer to unlocking the magic of Upwork to accomplish more than they ever thought possible. We continue to see clients come to Upwork for the professionals and solutions they need to execute on their most ambitious AI initiatives, hiring talent spanning roles from prompt engineers and AI model trainers to researchers, data annotators, and code checkers. Outstanding growth in this category of work continued in the second quarter, as AI was the fastest-growing category on Upwork in the first half of 2023(1). In fact, generative AI job posts on our platform were up more than 1000% while related searches were up more than 1500% when comparing the second quarter of 2023 to the fourth quarter of 2022.
Over the past few weeks, we unveiled the first of many generative AI innovations in our ecosystem, which we expect to further accelerate our momentum in this flourishing space. On July 11, we launched a new centralized AI Services hub that connects clients to highly skilled AI-focused talent, features partnerships with leading AI providers, and highlights resources and tools for businesses and talent looking to boost their work with AI. We further advanced this priority through a partnership with OpenAI announced earlier this week, establishing OpenAI Experts on Upwork.”
So I think UPWK is still a great story. Now, I need to manage my FOMO on this one!
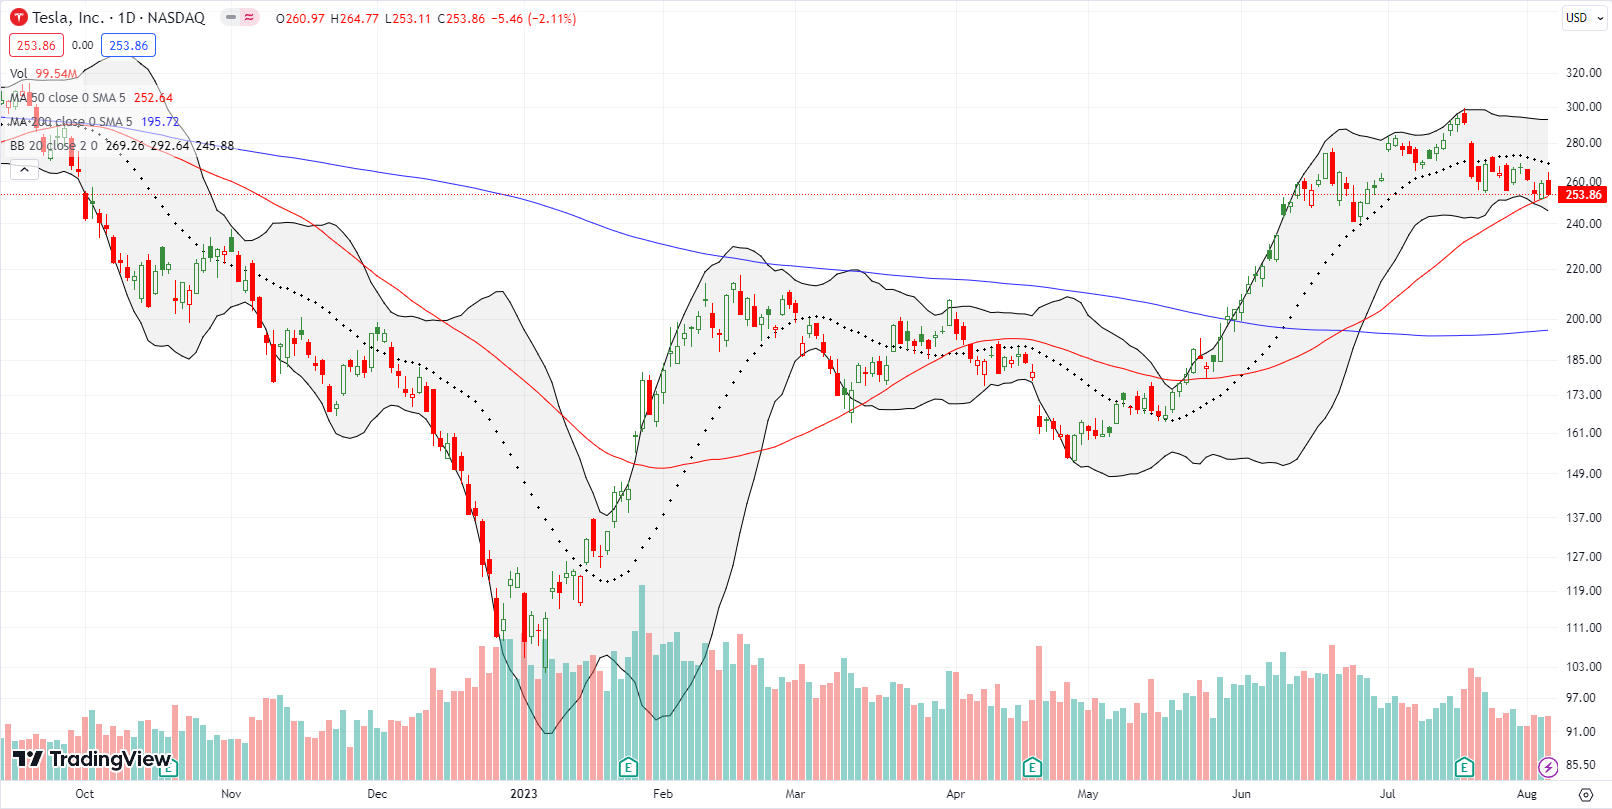
Tesla, Inc (TSLA) looks ready to join AAPL in topping out the major stock market indices. TSLA tested 50DMA support the last 3 days. Friday’s 2.1% loss puts the EV maker’s stock right at the edge of a critical breakdown. TSLA last traded below its 50DMA in mid-May. The stock never looked back after its 50DMA breakout. So a 50DMA breakdown could lead to a swift test of 200DMA support.
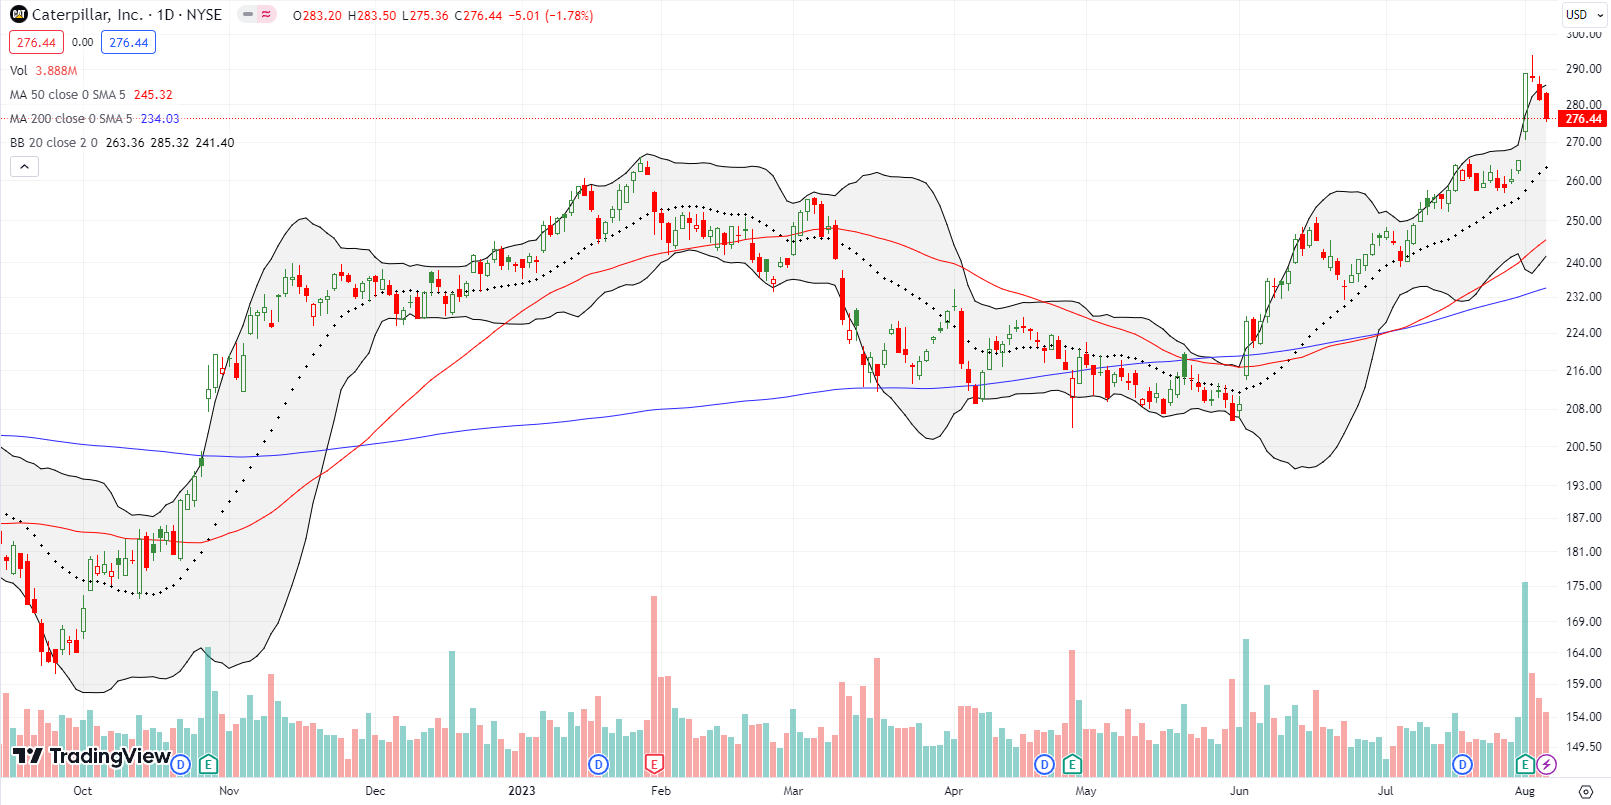
Caterpillar, Inc (CAT) is another critical tell for the stock market. Industrials and materials are some of the healthiest looking parts of the current market. CAT surged to an all-time high after last week’s 8.9% post-earnings gain. This move was particularly important because it pushed CAT far above the year’s highs first set in February. However, the stock printed the dreaded evening star topping pattern the very next day. Two straight days of subsequent selling confirmed the topping pattern. Now CAT looks ready to fully reverse its post-earnings gains.
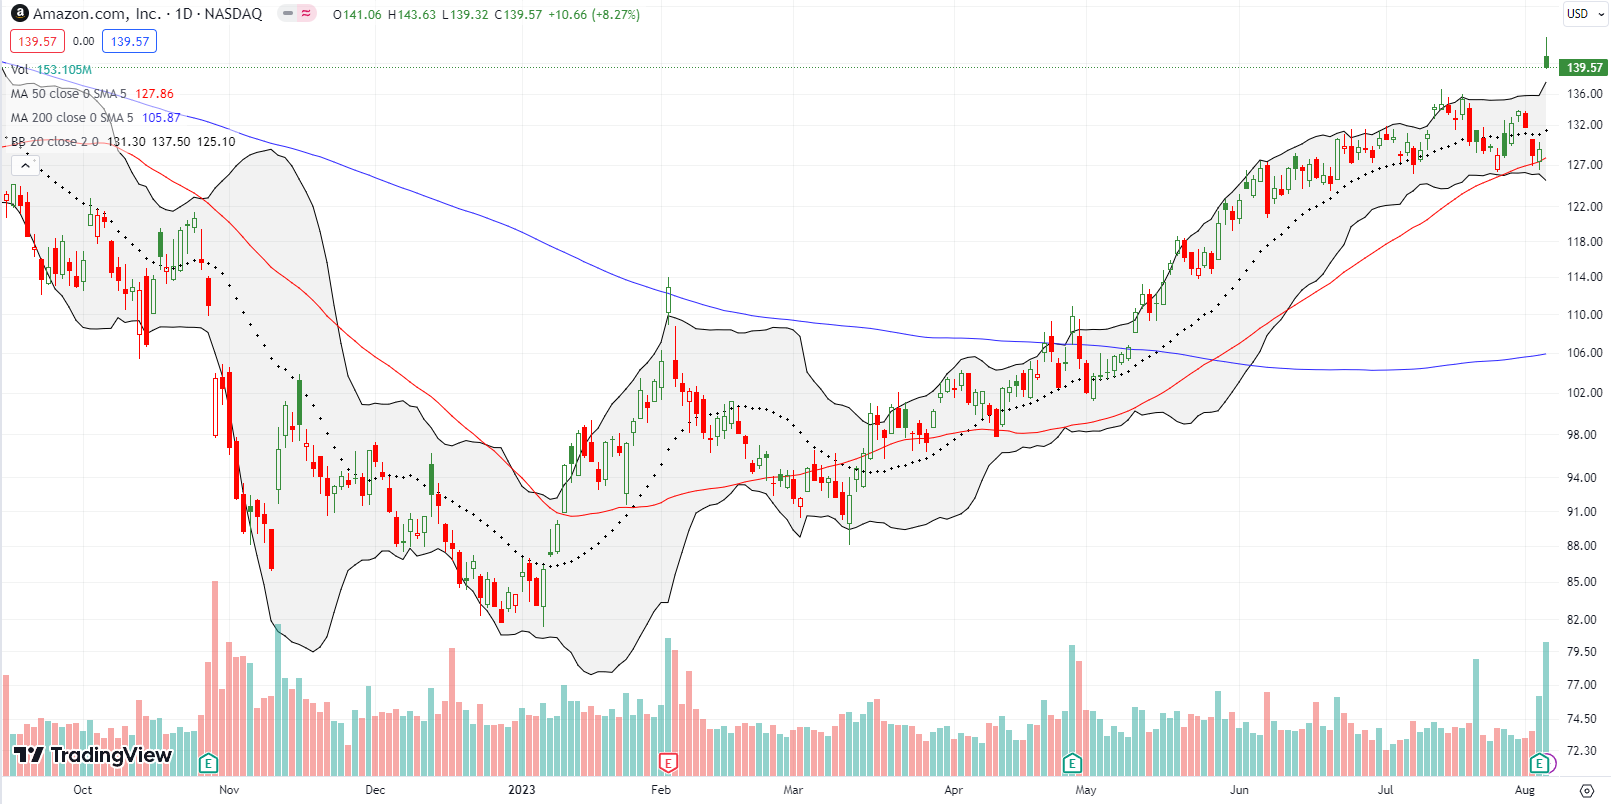
I gave in to temptation and bet on a positive post-earnings result for Amazon.com (AMZN). I wrote about the case in the last Market Breadth post following my successful Prime Day trade. AMZN closed the day with an 8.3% gain after fading from intraday highs. For a time, it looked like investors and traders were cashing in AAPL chips for AMZN chips. Now, AMZN stands out as a lingering hope for big cap tech to continue propping up the major indices. I took profits on my call spread at the open of trading. Note in the chart below how AMZN jumped perfectly off 50DMA support.
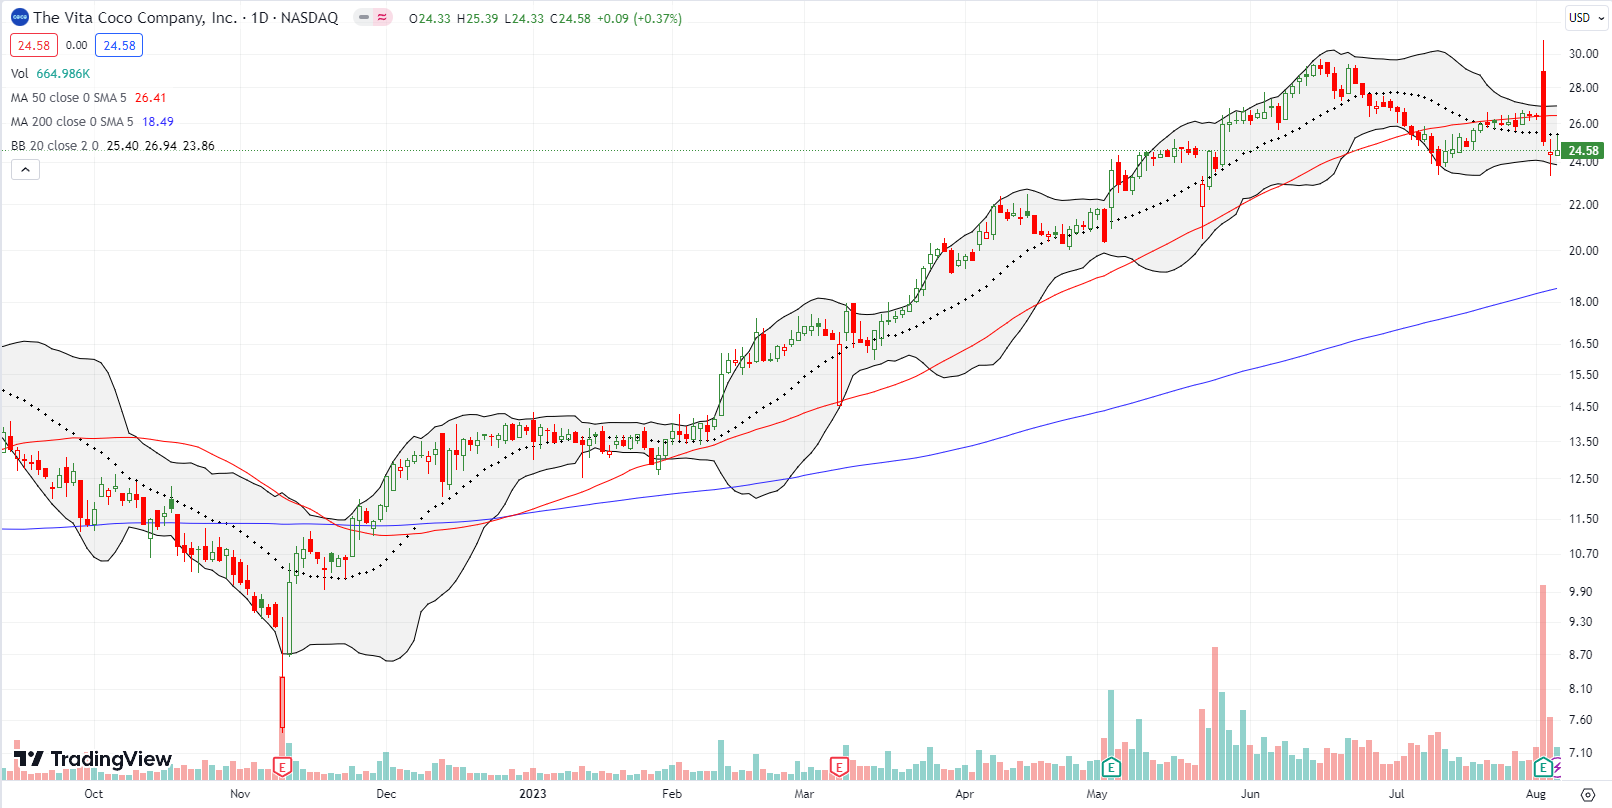
Coconut water company Vita Coco Company Inc (COCO) inexplicably enjoyed a strong run-up this year. I hopped aboard the ride as I chased breakouts in mid-February and mid-April. I did not buy back in after the stock stumbled on May 22nd in the wake of an announced stock offering. Even after the stock surged the next day by 7.0%, I failed to trigger my trading rule on stock offerings.
COCO finally topped out in June. Traders tepidly stepped into last week’s earnings. It was a bizarre day with COCO gapping higher by 9.7% and trading even higher before wickedly fading into a 5.0% loss. Buyers now look completely exhausted, and I am only interested in watching from the sidelines until at least I understand better what is going on with the business and the stock. COCO is right back to the price where it recovered from the post-secondary sell-off.
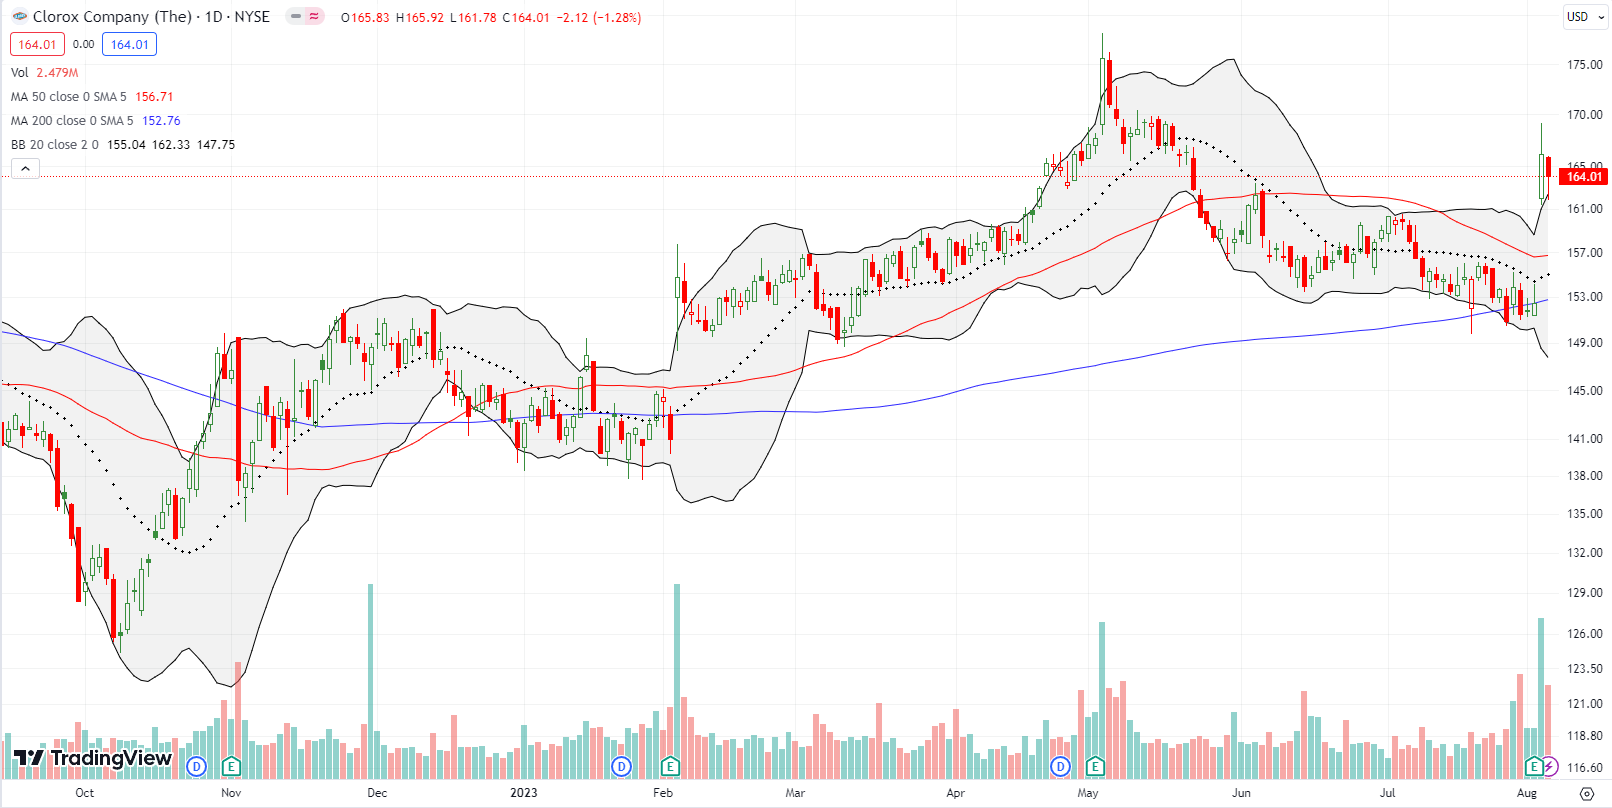
I got lured into The Clorox Company (CLX) as the COVID-19 pandemic approached its one year anniversary. Since then I just waited and collected dividends and reinvested most of them (the yield is now 2.9%). This year, CLX is finally making an important technical turn. Despite flaring out with a parabolic move into and through May earnings, CLX has bullishly held 200DMA support. Last week’s 9.0% post-earnings surge awaits confirmation, but I think this is the kind of consumer staple stock that could regain favor as the high-flyers of 2023 cool off with the market’s topping action.
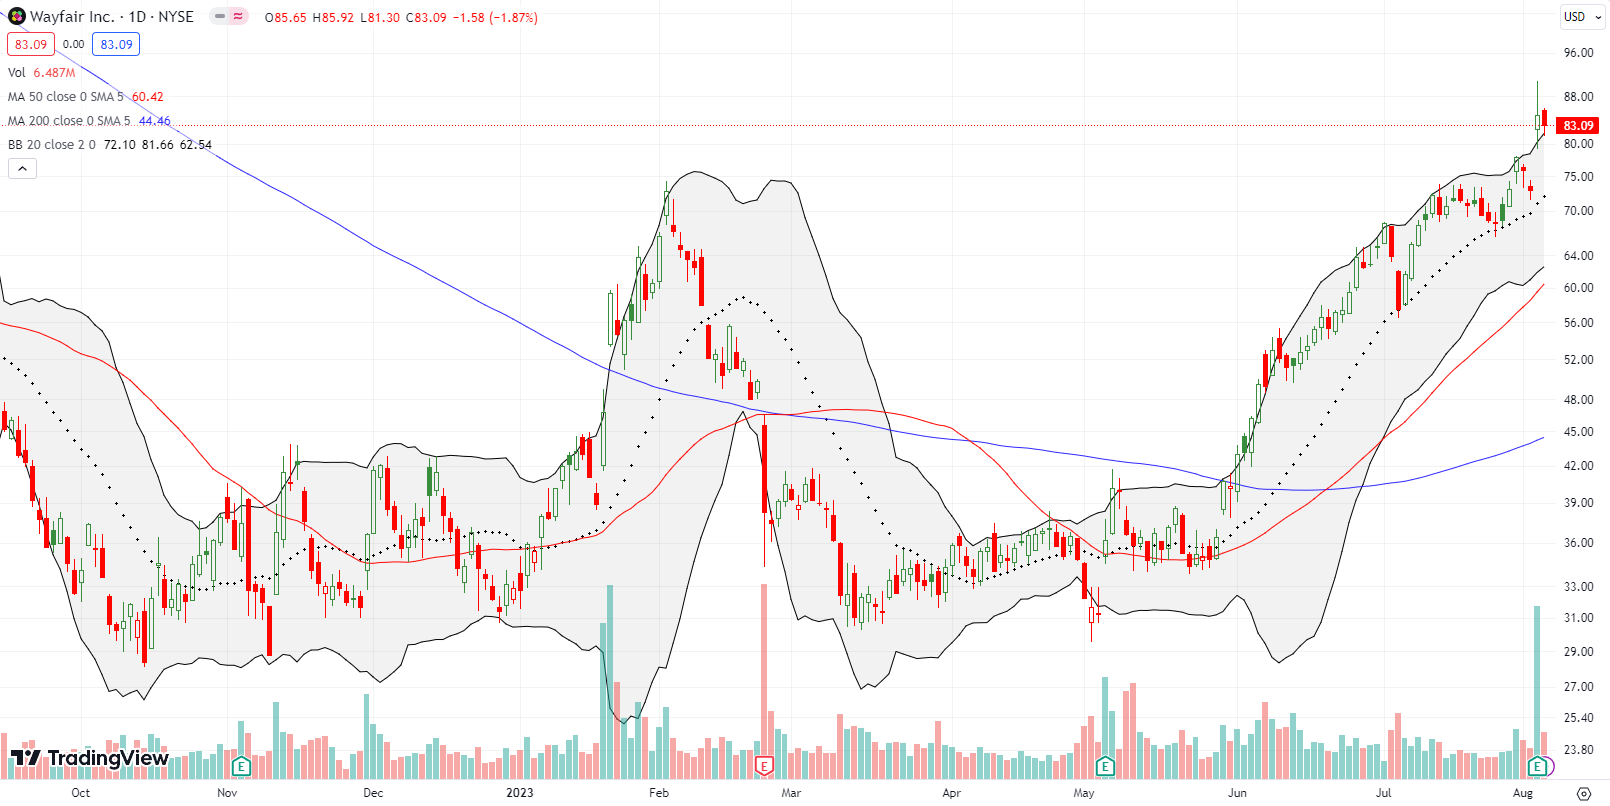
The surge in online furniture seller Wayfair Inc (W) is quite a surprise. Or maybe not. Forty-eight percent of W’s float is still sold short, so perhaps a fresh short squeeze is underway. Last week’s 16.2% post-earnings surge on a major earnings and revenue surprise inflicted fresh pain on the bears. Still, W is a former shell of its $350+ self. Looks like shorts got a little too greedy this year.
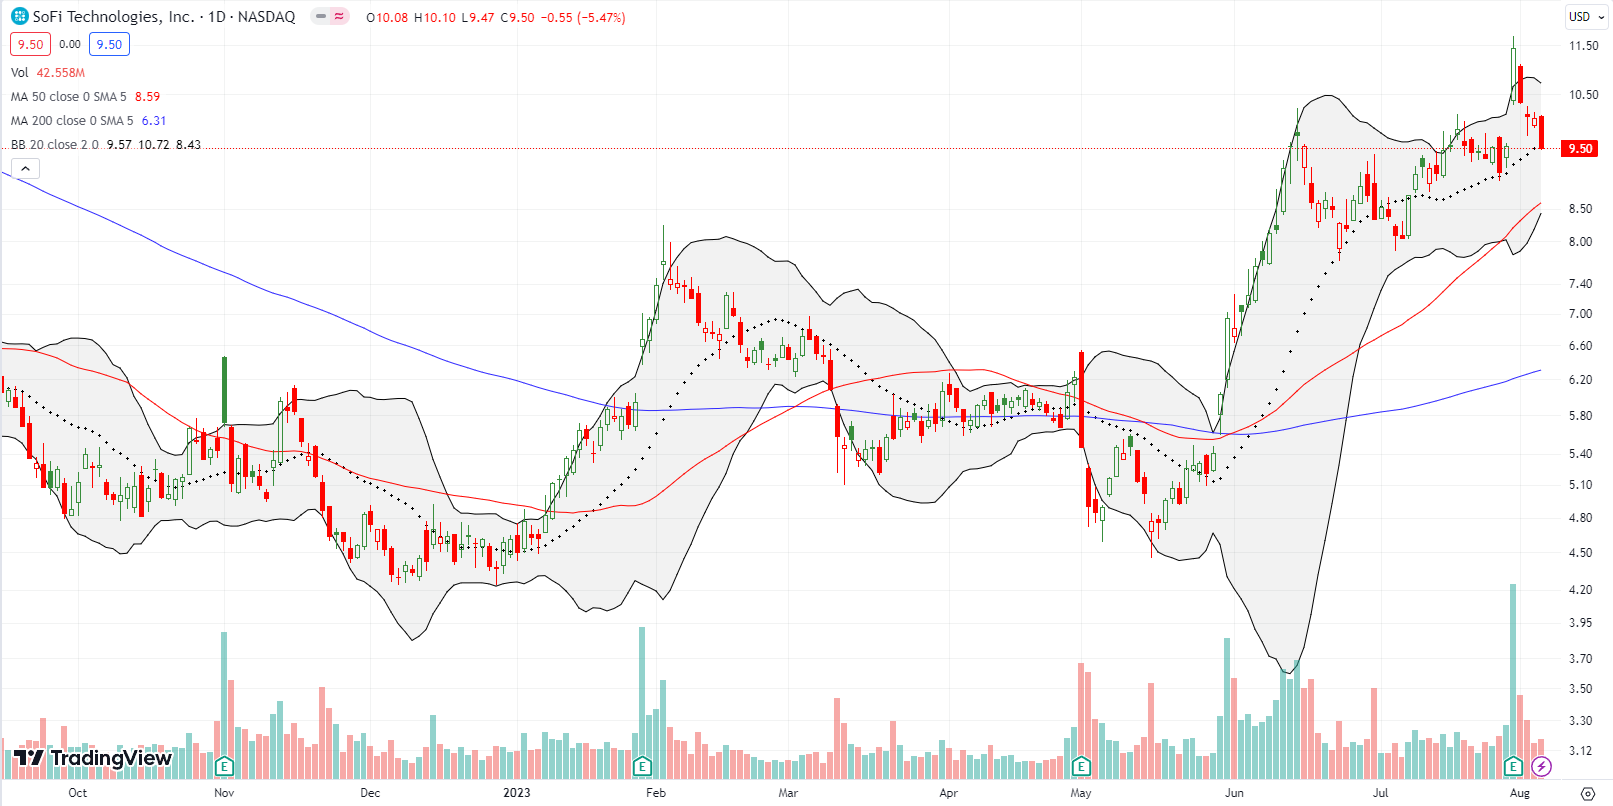
The drama in SoFi Technologies, Inc (SOFI) continues. I described my trade in SOFI a month ago. The stock looked trapped around its $9 target level until earnings sent SOFI surging toward $11.50. Buyers ran out of gas from there with sellers taking SOFI right back down to $9.50 and a complete post-earnings reversal. I doubt 20DMA support will hold here. SOFI looks set to eventually test 50DMA support.
Be careful out there!
Footnotes
Subscribe for free to get email notifications of future posts!
“Above the 50” (AT50) uses the percentage of stocks trading above their respective 50-day moving averages (DMAs) to measure breadth in the stock market. Breadth defines the distribution of participation in a rally or sell-off. As a result, AT50 identifies extremes in market sentiment that are likely to reverse. Above the 50 is my alternative name for “MMFI” which is a symbol TradingView.com and other chart vendors use for this breadth indicator. Learn more about AT50 on my Market Breadth Resource Page. AT200, or MMTH, measures the percentage of stocks trading above their respective 200DMAs.
Active AT50 (MMFI) periods: Day #89 over 20%, Day #63 over 30%, Day #60 over 40%, Day #46 over 50%, Day #21 over 60% (overperiod), Day #3 under 70% (underperiod)
Source for charts unless otherwise noted: TradingView.com
Full disclosure: long IWM call spread, long CLX, long TSLQ
FOLLOW Dr. Duru’s commentary on financial markets via StockTwits, Twitter, and even Instagram!
*Charting notes: Stock prices are not adjusted for dividends. Candlestick charts use hollow bodies: open candles indicate a close higher than the open, filled candles indicate an open higher than the close.

