
Stock Market Statistics
- AT40 = 79.6% of stocks are trading above their respective 40-day moving averages (DMAs) (Day #10 overbought)
- AT200 = 76.0% of stocks are trading above their respective 200DMAs (near 3-year high and holding breakout above post financial crisis downtrend)
- VIX = 20.8
- Short-term Trading Call: neutral
Stock Market Commentary
Instead of Monday, the stock market chose Tuesday last week to make a big move. From there, tech stocks carried the torch and the momentum through the end of a holiday-shortened week. With volatility continuing to sag, the stock market is stretching for a fresh rally.
The Stock Market Indices
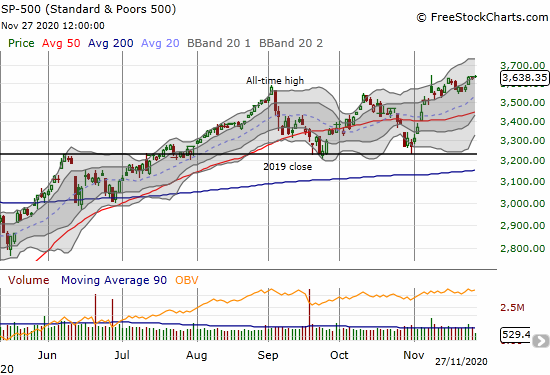
The S&P 500 (SPY) snuck its way to a new all-time high (label in the graph is misplaced). The index is stretching for a fresh rally and looks ready to sneak its way to the top of its upper Bollinger Band (BB).
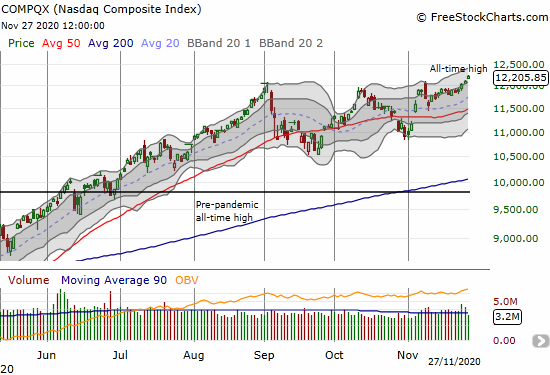
The NASDAQ (COMPQX) took a notable turn upward on consecutive all-time highs. The on-going rotation into “reopen” or “value” stocks took a backseat to a revival in tech stocks. The NASDAQ’s stretch for a fresh rally is already underway.
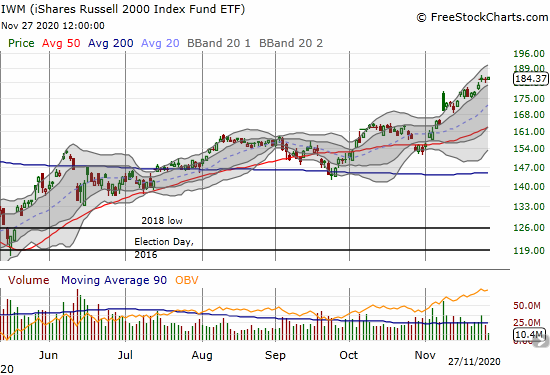
The iShares Russell 2000 Index Fund ETF (IWM) is riding high on new all-time highs. The index of small cap stocks is floating through its upper-BB.
The SPDRs Select Sector Financial (XLF) jumped 3.5% on Tuesday and then stalled out. Still, at a 9-month high, XLF looks revived and is participating in the general bullishness in the stock market.

Stock Market Volatility
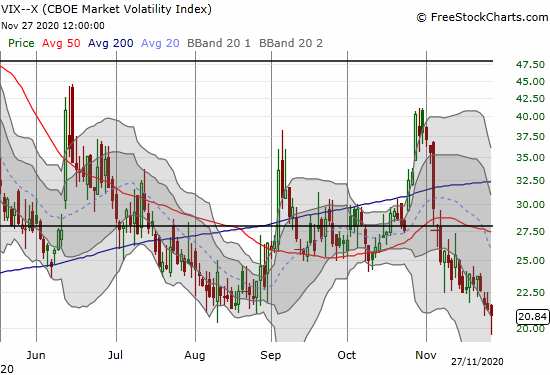
The volatility index (VIX) is churning but has trended downward all month. On Friday, the VIX even punched through the 20 level which is the threshold for elevated volatility. If the VIX confirms a breakdown below 20, then the stock market will get a freshly bullish signal. The VIX last closed below 20 on February 21st….right before the stock market’s collapse began in earnest as a part of the pandemic.
The Short-Term Trading Call: Overbought and Stretching Further

AT40 (T2108), the percentage of stocks trading above their respective 40DMAs, closed at 79.6% and seems very stretched. The overbought period is 10 days old. Still, the price action shows no signs of fatigue. Tech stocks in particular are stretching for a fresh rally and confirming a gathering swell of fresh buying power in the stock market.
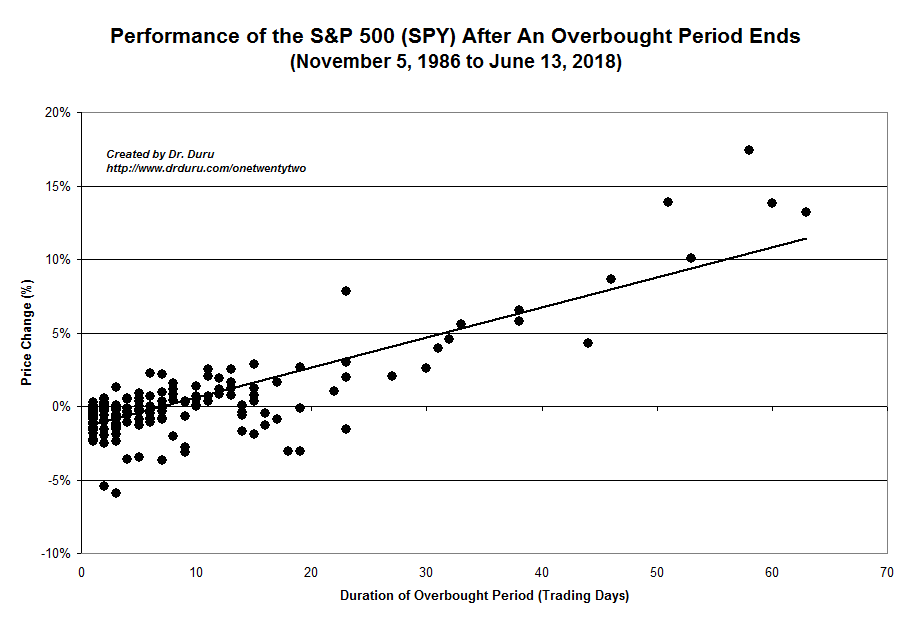
My trading call remains neutral although I now anticipate the potential for an extended overbought rally. The S&P 500 first needs to get through the next 10 to 12 trading days “unscathed.” The chart below suggests that until the overbought period makes it to 20 days, the index has a high risk of a small pullback on an end to overbought trading. The S&P 500 has 1.5% in gains since overbought trading resumed on November 13th.
Stock Chart Reviews – Below the 50DMA
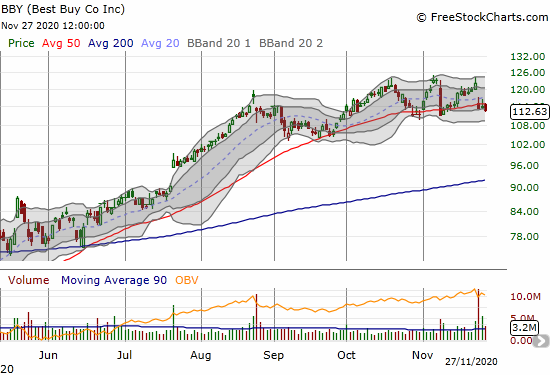
Best Buy Co (BBY)
Electronics retailer Best Buy (BBY) ruined the good mood and grace granted to retail stocks. A disappointing earnings report sent the stock down 7.0%. BBY confirmed that 50DMA breakdown with a 1.1% loss.
Stock Chart Reviews – Above the 50DMA
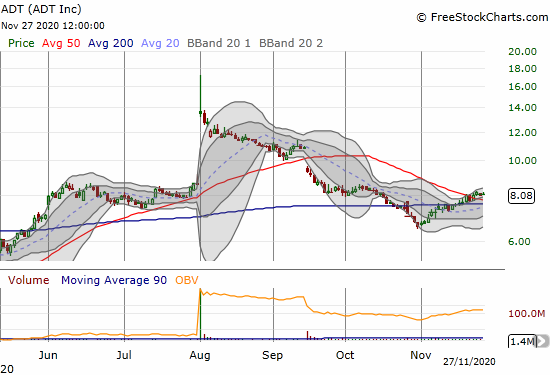
ADT Inc (ADT)
I am eyeing home security company ADT Inc (ADT) for a rebound after the stock closed above its 50DMA. I thought the 56.6% surge on August 3 indicated that the announced partnership with Alphabet (GOOG) was a game changer. The home security space is extremely crowded with many innovators. Accordingly, until that Alphabet deal, I assumed ADT was slowly but surely fading away.
ADT faded hard from its high on that day and kept selling from there. Sellers did not stop with a simple reversal of those gains. After hitting a 5-month low, ADT finally bottomed. The stock is back to its pre-partnership close. I am a buyer here in anticipation of some eventual renewed excitement. I even wonder whether Alphabet could soon decide to buy out ADT.
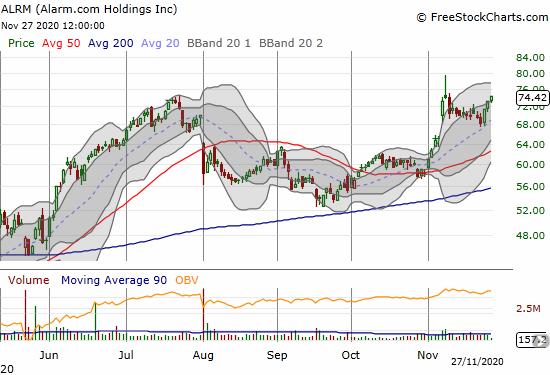
Alarm.com Holdings, Inc (ALRM)
The ADT deal with Alphabet slammed Alarm.com Holdings (ALRM). ALRM lost 16.8% that day. Over three months later, ALRM finished recovering its losses. A 12.3% post-earnings surge confirmed the recovery. ALRM closed the week at an all-time high. Is there enough room for both ADT and ALRM (and a lot more)?
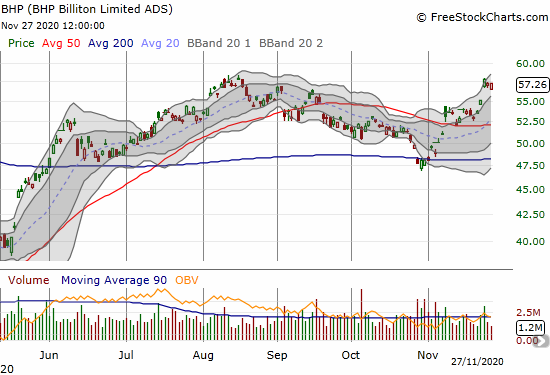
BHP Billiton Limited (BHP)
Commodity plays enjoyed a strong November. BHP Billiton Limited (BHP) gapped higher 5.0% on Tuesday to confirm the on-going strength.
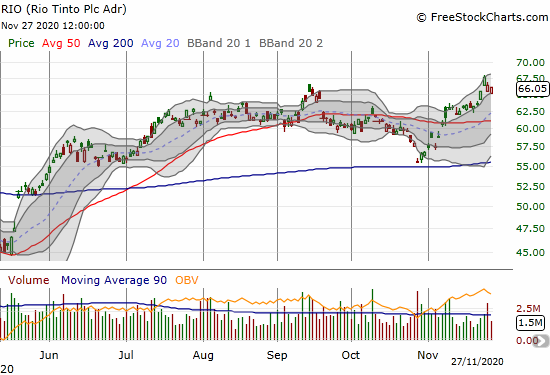
Rio Tinto Plc (RIO)
Rio Tinto Plc (RIO) quickly lost its Tuesday gap up. Fortunately, I sold my January call options on that day. I am now looking to rush back into a position.
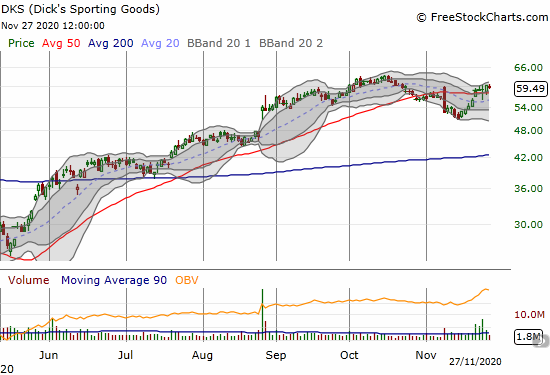
Dick’s Sporting Goods (DKS)
The outdoor and sports recreation play yet lives. Dick’s Sporting Goods (DKS) quickly recovered from the big down day earlier in the month. The stock survived earnings and still trades above 50DMA support. I am almost ready to move into a fresh covered call trade on DKS.
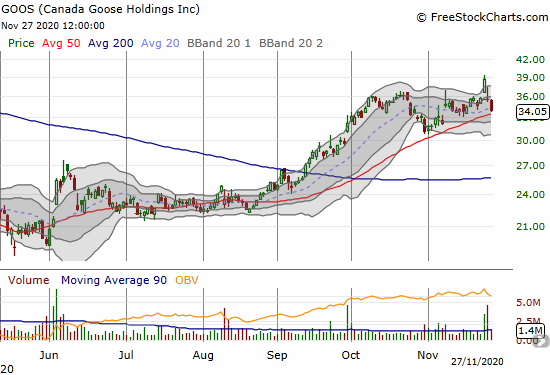
Canada Goose Holdings Inc (GOOS)
I took advantage of a post-earnings fall toward 50DMA support to finally buy into Canada Goose Holdings Inc (GOOS). I felt like a genius on Tuesday’s 8.2% leap and close to a 52-week high. An analyst downgrade to sell the next morning spoiled the milk. GOOS promptly gapped down 7.9%. As a result, I reluctantly closed my position to preserve my remaining profits. The stock is tempting again near the 50DMA, but I will stay in watch mode for now.
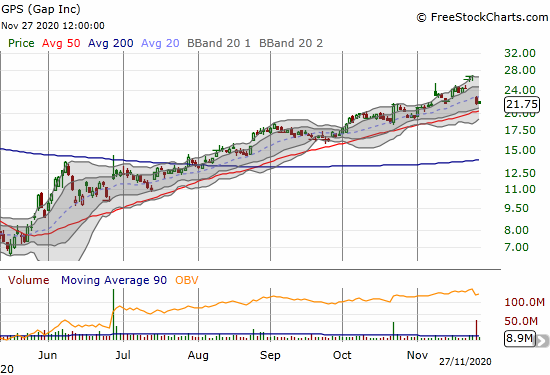
Gap Inc (GPS)
Like Best Buy, Gap Inc (GPS) demonstrated that traders cannot assume the retail trade will just keep growing to the sky. Sellers descended upon GPS post-earnings for a 19.6% loss. While the uptrend remains in the stock, a successful test of 50DMA support will be critical to maintaining the technical health of the trade.
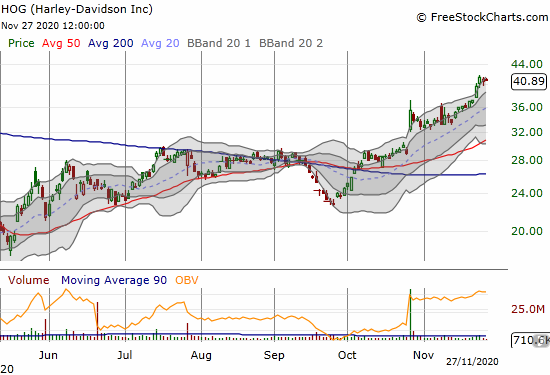
Harley-Davidson Inc (HOG)
Motorcycle manufacturer Harley-Davidson Inc (HOG) is following through nicely on its 200DMA breakout. I remain a holder and am looking for further gains.
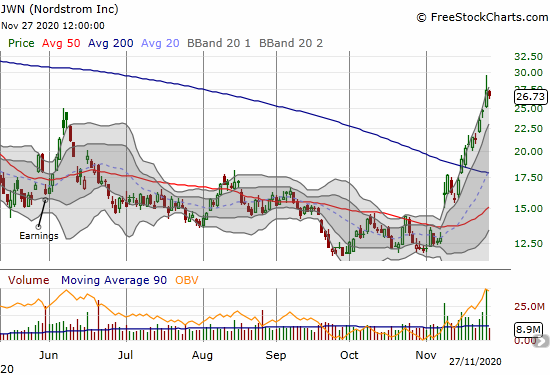
Nordstrom (JWN)
Somehow, I missed the latest rally in department store retailer Nordstrom (JWN). The 200DMA breakout was a great buying signal. The 11.7% post-earnings gain makes JWN a buy on the dips. JWN remains one of my favorite ways to play a potential resurrection in some traditional retail.
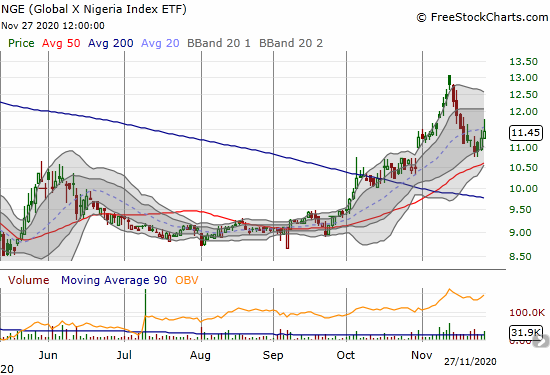
Global X Nigeria Index (NGE)
I sang the praises of the Global X Nigeria Index (NGE) right at what turned out to be a notable top. NGE completed a parabolic move with a 3.9% loss the next day. Sellers did not stop until last week. The current rebound looks healthy. If I did not already own a sufficiently large position, I would add shares here.
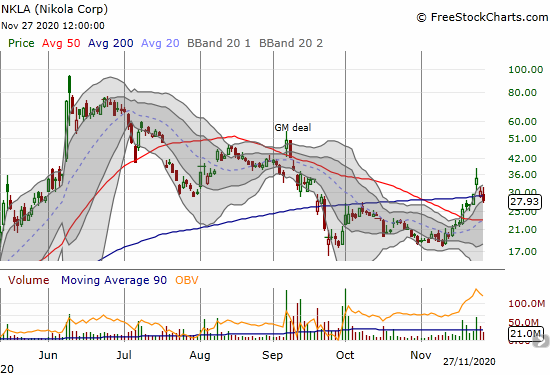
Nikola (NKLA)
It’s back! I was ready to bury Nikola (NKLA) just two months ago. NKLA enjoyed a 17.3% 200DMA breakout last week on renewed hopes for a deal with General Motors (GM). The move lured me back into a trade.
I constructed a familiar “collar” trade with a covered call (Jan $40) and a Dec $30 put purchased with some of the premium from selling the call short. After NKLA promptly closed the gap up with a test of the 200DMA, I took profits on the put and used some of the profits to buy a Dec $25 put. Thanks to the large implosion in the premium on the call, my net position is positive. However, my choice of the December expiration for the put means time is short for this version of the trade. (Also see “How to Buy Jumia Technologies with Limited Risk” for a description of the pros and cons of this kind of collar trade).
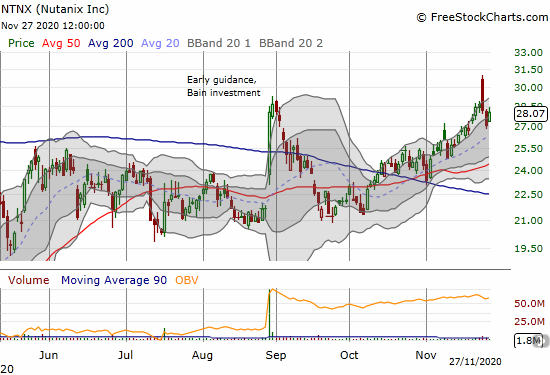
Nutanix (NTNX)
I took profits in Nutanix (NTNX) ahead of earnings. For a brief moment, I felt regret as the stock gapped over its August highs. However, sellers quickly took the stock down to a 0.9% loss. I am looking to buy back in after a period of stabilization. I prefer a successful test of uptrending 20DMA support.
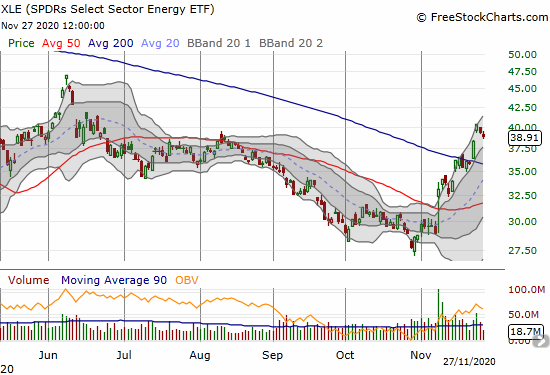
SPDR Select Sector ETF (XLE)
I started the year diving into what I called 2020’s contrary trade: oil. By late January, my hopes for the trade rapidly faded to minimal. XLE looks like it finally secured a sustainable bottom last month with a 50DMA breakout and then last week’s 200DMA breakout. I have XLE on my shopping list for the coming week. A trade on oil is more contrary than ever given the combined double whammy of a recession-driven implosion in demand and the robust interest in alternative energy. I still prefer solar and EV trades to oil trades.
— – —
FOLLOW Dr. Duru’s commentary on financial markets via email, StockTwits, Twitter, and even Instagram!
“Above the 40” uses the percentage of stocks trading above their respective 40-day moving averages (DMAs) to assess the technical health of the stock market and to identify extremes in market sentiment that are likely to reverse. Abbreviated as AT40, Above the 40 is an alternative label for “T2108” which was created by Worden. Learn more about T2108 on my T2108 Resource Page. AT200, or T2107, measures the percentage of stocks trading above their respective 200DMAs.
Active AT40 (T2108) periods: Day #33 over 20%, Day #17 above 30%, Day #16 over 40%, Day #15 over 50%, Day #14 over 60%, Day #10 over 70%
Daily AT40 (T2108)
")
Black line: AT40 (T2108) (% measured on the right)
Red line: Overbought threshold (70%); Blue line: Oversold threshold (20%)
Weekly AT40 (T2108)

*All charts created using FreeStockCharts unless otherwise stated
The T2108 charts above are my LATEST updates independent of the date of this given AT40 post. For my latest AT40 post click here.
Be careful out there!
Full disclosure: long UVXY, long HOG, long IWM calendar call spread, long NGE; long NKLA shares, short call, long put; long XLE calls
*Charting notes: FreeStockCharts stock prices are not adjusted for dividends. TradingView.com charts for currencies use Tokyo time as the start of the forex trading day. FreeStockCharts currency charts are based on Eastern U.S. time to define the trading day.