
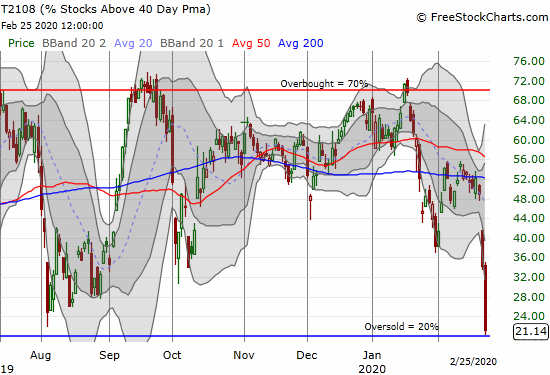
AT40 = 21.1% of stocks are trading above their respective 40-day moving averages (DMAs)
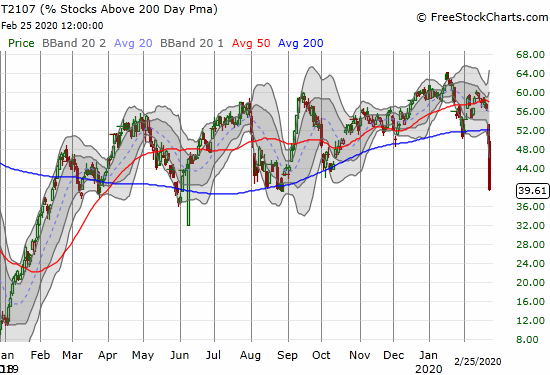
AT200 = 39.6% of stocks are trading above their respective 200DMAs
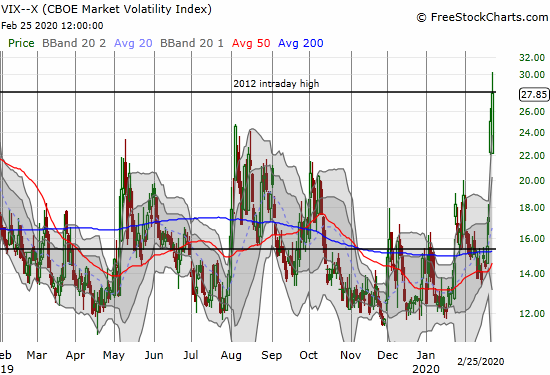
VIX = 27.9
Short-term Trading Call: neutral
Stock Market Commentary
Synchronized breakdowns below the 50-day moving average (DMA) looked like an extreme day of selling. The follow-up was even more spectacular. Major indices collapsed to fresh levels of critical support on high volumes of selling and extended in some cases well below their lower Bollinger Bands (BB). Such closes are one form of extreme selling.
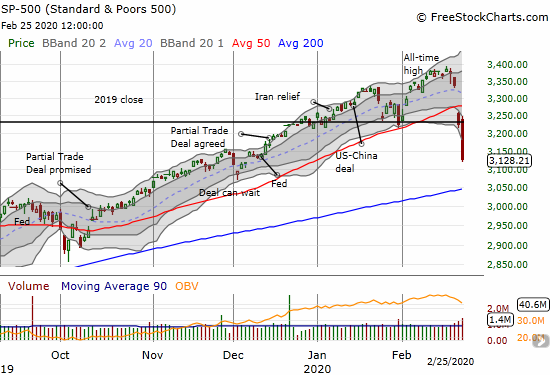
The S&P 500 (SPY) lost 3.0% and closed near a 3-month low. The major index whizzed right past previous trade deal milestones…fading memories of the global trade turmoil that catalyzed global economic weakness long before anyone could even imagine a virus capturing the world’s attention.
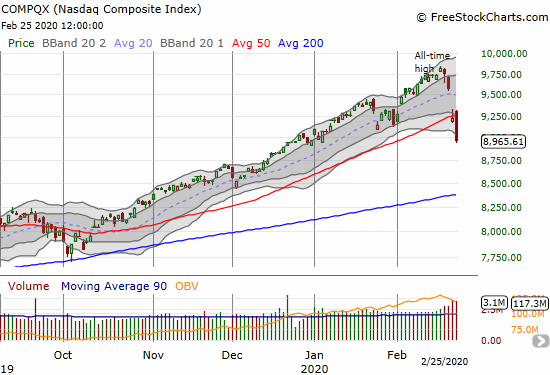
The NASDAQ (COMPQX) finally erased all its gains for 2020. The tech-laden index lost 2.8% on the day and confirmed its 50DMA breakdown.
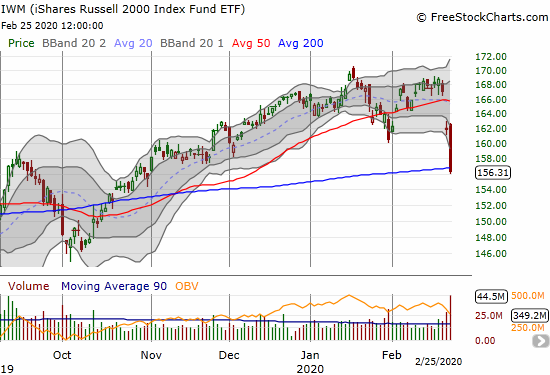
The iShares Russell 2000 Index Fund ETF (IWM) cratered to and through its 200DMA support with a 3.6% loss.
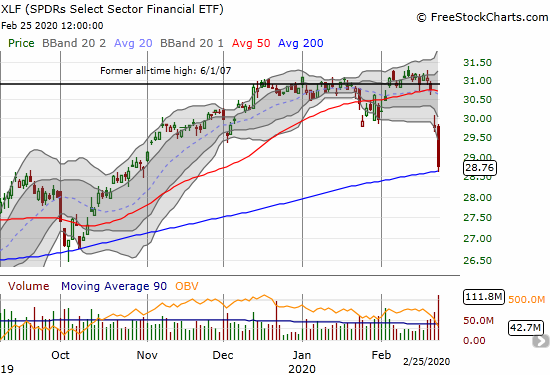
The SPDRS Select Sector Financial ETF (XLF) further confirmed a top with an extreme stretch below its lower-BB to tap its 200DMA support. XLF lost 3.4% a day after losing 3.3%.
Volatility
The volatility index (VIX) soared again. The fear gauge managed to close right at its 2012 intraday high. I keep this level marked as an upper bound on the VIX because that point marked such a major low for the stock market in the shadows of the financial crisis and resulting recession. The VIX was extreme enough to finally motivate me into buying March $15 put options on ProShares Ultra VIX Short-Term Futures ETF (UVXY). I plan to accumulate these put options if they get cheaper in anticipation of an eventual bounce from oversold conditions.
Currency Signal On Edge
The Australian dollar versus the Japanese yen (AUD/JPY) has performed better than I would have expected during this period of extreme selling. Economic weakness in Japan that has currency traders anticipating more monetary measures from the Bank of Japan as weakened the yen and clouded the conventional risk-off signal. At the time of writing AUD/JPY was trading right at the edge of a breakdown past January’s low (which itself helped to convince me to pay serious heed to the bearish divergences in the stock market). I will interpret a bounce in AUD/JPY as a green light for speculating on an oversold bounce.
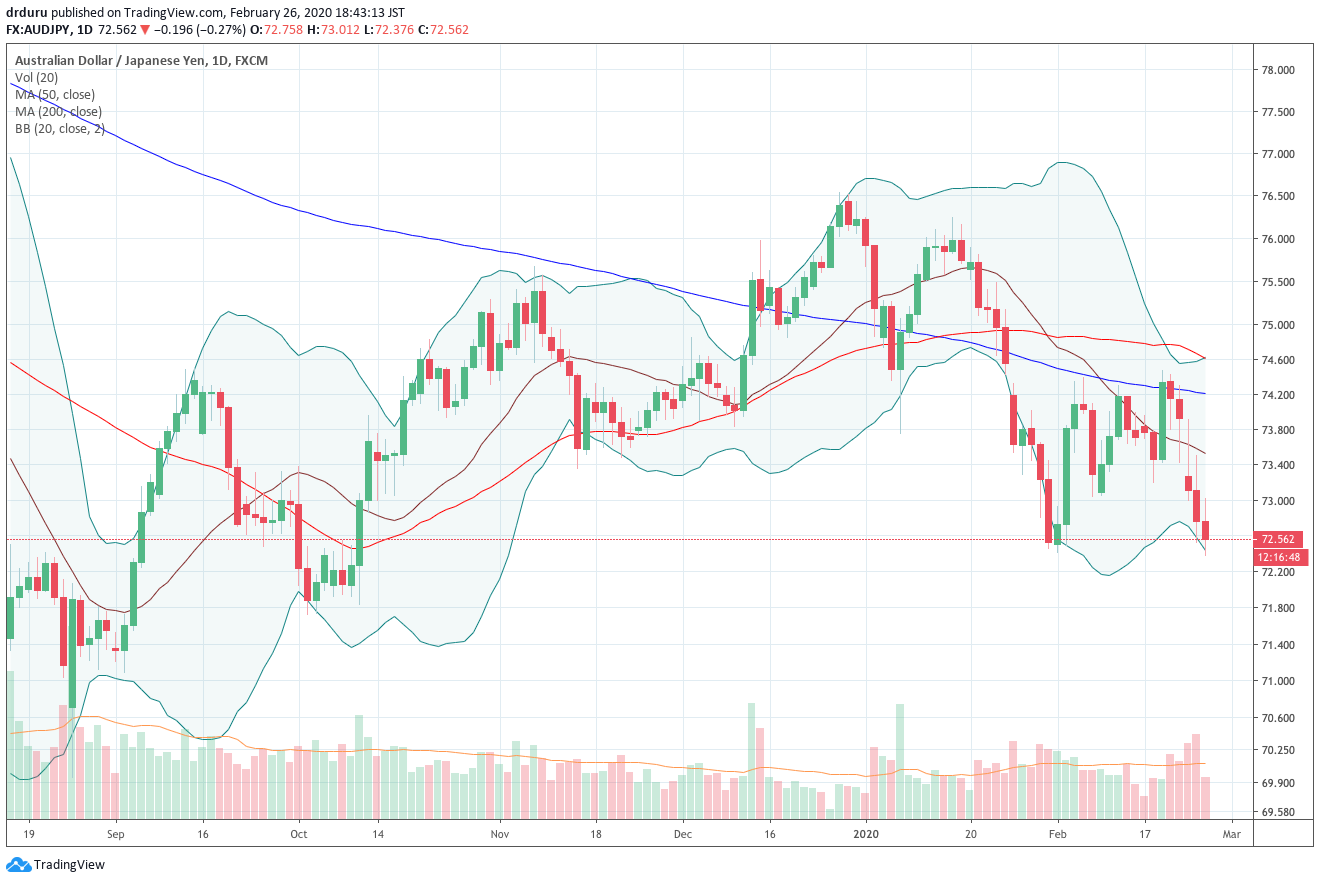
Source: TradingView
Suddenly Oversold
My favorite technical indicator made one of the most spectacular and extreme moves of the day. AT40 (T2108), the percentage of stocks trading above their respective 40-day moving averages (DMAs), plunged from 34.3% to 21.1%. In picture-perfect form, AT40 tapped the oversold threshold of 20% at its lowest level of the day. AT40 was last this low on January 4, 2019. AT40 did not close below 20%, but I consider this extreme action to be “close enough.” These moves write all the signatures of a market becoming suddenly oversold.
AT200 (T2107), the percentage of stocks trading above their respective 200DMAs, put on its own display of extremes. AT200 dropped 10 percentage points to 39.6% for a 6-month low. The previous day’s drop confirmed a top in the stock market. Today’s drop confirmed significant and broad-based damage in the stock market.
The Short-Term Trading Call
Putting all these extremes together gives me enough cause to flip my bearish trading call all the way to neutral. While I am calling these conditions “suddenly oversold”, I am not officially going bullish because AT40 did not close below 20%. However, I do not want to stay bearish because conditions are too extreme to provide good risk/reward on new bearish bets. Neutral is the right compromise between these two tensions.
Ideally, the market gaps down on Wednesday. A VIX soaring to even greater extremes and AT40 plunging below 20% would give me a clear buy signal for a trade. Yet, these perfect conditions almost never happen when I look for them. So instead I am prepared to do a little chasing higher if buyers step right into the breach early tomorrow. I will scale positions according to the opportunity: small when chasing, big otherwise.
Stock Chart Reviews – Below the 50DMA
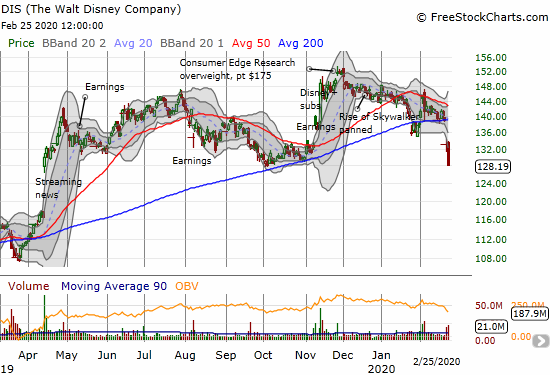
Disney (DIS)
Disney (DIS) announced a CEO change in the after hours. I want to buy shares (for the long-term) and calls on tomorrow’s resulting dip. I have been waiting since Disney+ for cheaper prices to get back into DIS.
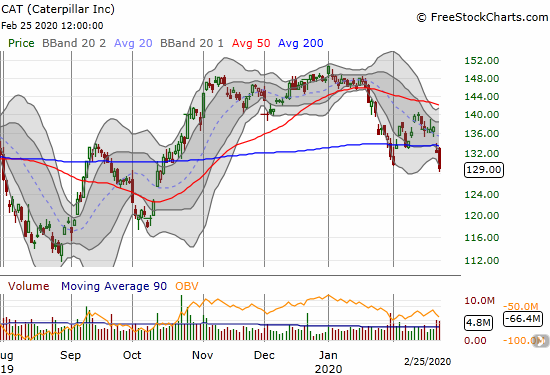
Caterpillar (CAT)
Caterpillar (CAT) confirmed a 200DMA breakdown. This is one of a few select stocks I do not mind chasing downward. I plan to reload on CAT puts as a way to stay hedged against fresh downward momentum in the stock market. CAT has downside risk at least to $120.
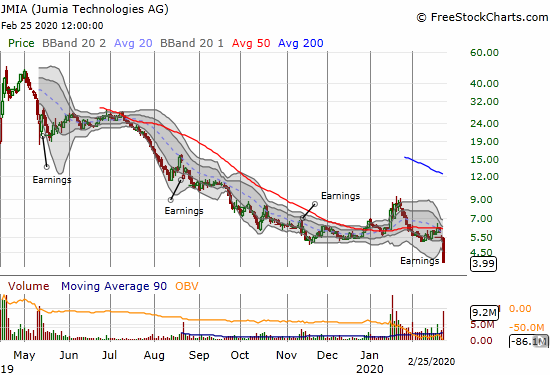
Jumia Technologies (JMIA)
I might as well roll out my mea culpa now on Jumia Technologies (JMIA). This stock is an unmitigated disaster. I am left wondering whether this e-commerce play for Africa will survive.
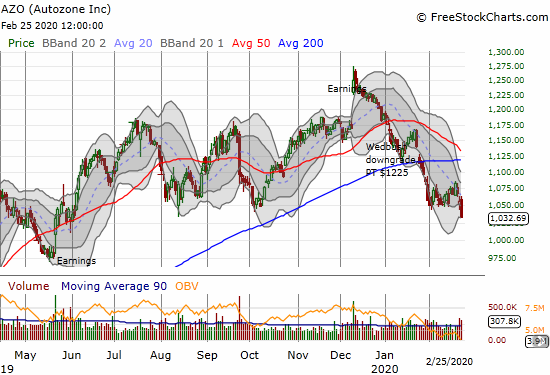
Autozone (AZO)
The on-going weakness in Autozone (AZO) continues to surprise me. I think of AZO as a bit of a defensive stock. The fresh downdraft tells me that a lasting top is in the stock. It is even time to think seriously about getting bearish on AZO. The stock closed at a 9-month low.
Stock Chart Reviews – Above the 50DMA
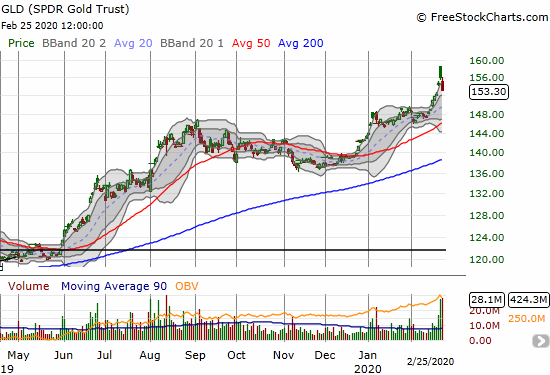
SPDR Gold Trust (GLD)
SPDR Gold Trust (GLD) lost its “safe haven” status by losing 1.8% at the same time stocks imploded. I suspect the trade got over-crowded by the fearful set. Moreover, the gap down and follow-on selling left behind a bearish topping pattern sometimes called an island reversal. The move left the previous day’s buyers “trapped” on an island and eager to evacuate at the earliest opportunity. I want to buy the dip in GLD (with call options to supplement my long-term shares), but I need lower prices. In the meantime I am left wondering whether GLD is an early sign of oversold conditions in the stock market.
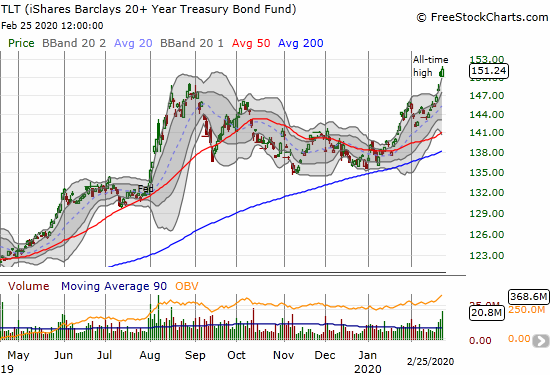
iShares Barclays 20+ Year Treasury Bond Fund (TLT)
For this moment, I was supposed to have a fistful of call options iShares Barclays 20+ Year Treasury Bond Fund (TLT). Instead, I took profits far too early. I firmly believe rates are going to keep trending ever lower (TLT higher), and I am looking to buy into the next dip.
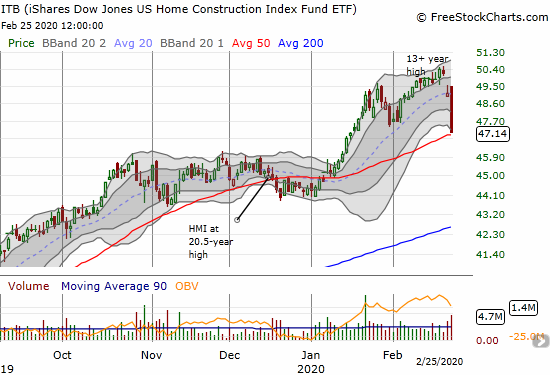
iShares Dow Jones US Home Construction Index Fund ETF (ITB)
The iShares Dow Jones US Home Construction Index Fund ETF (ITB) had its worst one day performance since December 4, 2018 during the final throes of the last housing slowdown. This dip automatically triggered my seasonal trade for home builders with the suddenly oversold conditions creating ripe buying opportunities. I added call options to my existing call spread. I expect awful earnings from Toll Brothers (TOL) to put further pressure on the entire sector. I am primed to load up on more home builders in the wake of that likely selling.
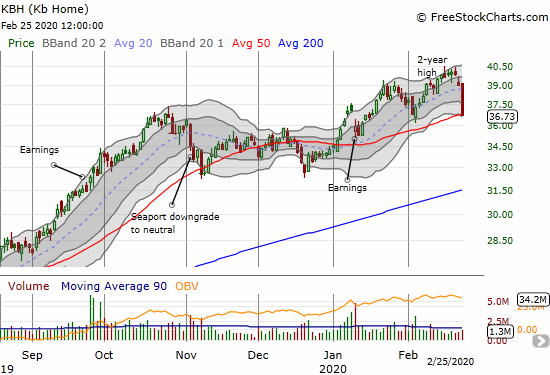
KB Home (KBH)
KB Home (KBH) is at the top of my (re)buy list after it plunged right to 50DMA support. The stock is off 2-year highs but still has gains from its last earnings report.
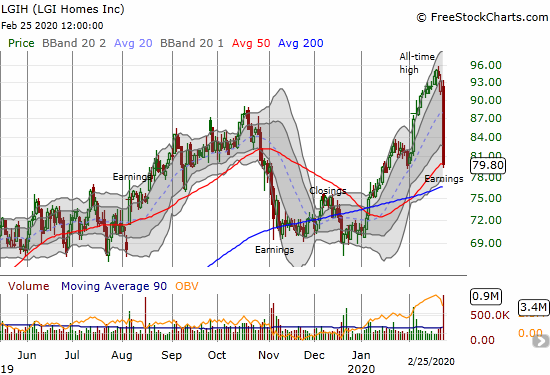
LGI Homes (LGIH)
LGI Homes (LGIH) shocked me. The stock lost 14.3% after what looked like a strong earnings report. I quickly scanned the results, and I think I found a key chink in the armor that likely incited the stampede out of the stock: extremely wide guidance for homes closed in 2020, 8400 to 9400 homes. Compare this to the 6900-7800 range given for 2019 guidance a year ago and the 7,960 homes closed for 2019. The market clearly is skeptical that the company is simply being conservative again. Moreover, LGIH projects average selling prices to drop significantly for the year and from Q1. I will be looking to start buying into LGIH around its 200DMA.
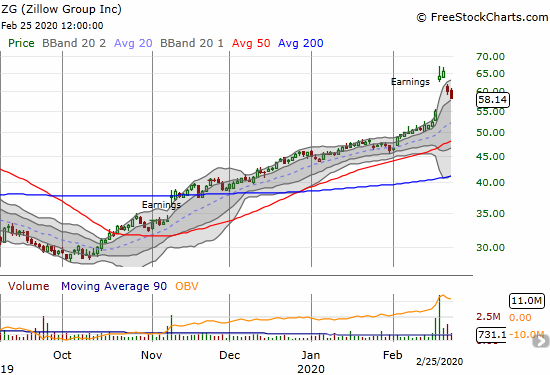
Zillow Group (ZG) (Z)
I missed the “obvious” trade going long Zillow Group (ZG) (Z) ahead of earnings after my bullish assessment of competitor Redfin (RDFN). The current post-earnings pullback would look like just the opportunity I need except it leaves behind a toppy looking pattern. I will feel more comfortable speculating after a complete earnings reversal.
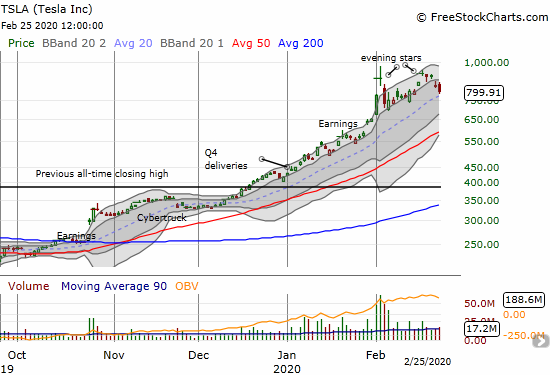
Tesla (TSLA)
I had to change my trading strategy on Tesla (TSLA) as margin requirements soared on shares (a sure sign that the brokers knew selling pressure was around the corner). I closed out my short position and completely focused on flipping call and put options. I added small shares short to align with the market’s bearish mood. While TSLA should benefit from an oversold bounce, the stock is looking topped out. Two evening stars mark a double-top in the stock. The last two days of selling mark the first days TSLA has closed below its primary uptrend with the upper-BBs since the brief consolidation period in early December. A close below the uptrending 20DMA will confirm the end of the primary uptrend.
Of course, TSLA is still a wild, momentum stock, so I am still braced for large swings up and down. While volatility is high, spreads are the trade of choice, especially calendar spreads.
— – —
FOLLOW Dr. Duru’s commentary on financial markets via email, StockTwits, Twitter, and even Instagram!
“Above the 40” uses the percentage of stocks trading above their respective 40-day moving averages (DMAs) to assess the technical health of the stock market and to identify extremes in market sentiment that are likely to reverse. Abbreviated as AT40, Above the 40 is an alternative label for “T2108” which was created by Worden. Learn more about T2108 on my T2108 Resource Page. AT200, or T2107, measures the percentage of stocks trading above their respective 200DMAs.
Active AT40 (T2108) periods: Day #275 over 20%, Day #1 under 30% (underperiod ending 113 days over 30%), Day #12 under 40%, Day #3 under 50%, Day #22 under 60%, Day #26 under 70%
Daily AT40 (T2108)
")
Black line: AT40 (T2108) (% measured on the right)
Red line: Overbought threshold (70%); Blue line: Oversold threshold (20%)
Weekly AT40 (T2108)

*All charts created using FreeStockCharts unless otherwise stated
The T2108 charts above are my LATEST updates independent of the date of this given AT40 post. For my latest AT40 post click here.
Be careful out there!
Full disclosure: long VIXY calls, long UVXY puts, long GLD, long SPY put spread, long JMIA, long TSLA calendar call, call spread and puts; long ITB call spread and calls
*Charting notes: FreeStockCharts stock prices are not adjusted for dividends. TradingView.com charts for currencies use Tokyo time as the start of the forex trading day. FreeStockCharts currency charts are based on Eastern U.S. time to define the trading day.