
AT40 = 34.3% of stocks are trading above their respective 40-day moving averages (DMAs)
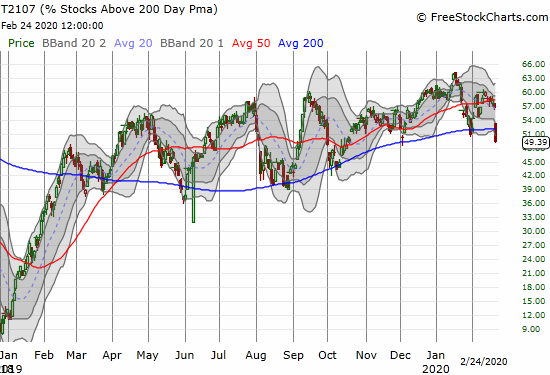
AT200 = 49.4% of stocks are trading above their respective 200DMAs
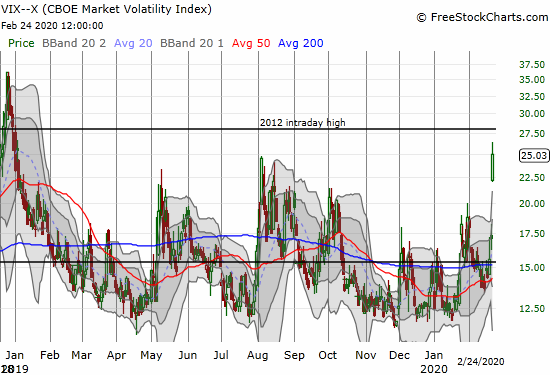
VIX = 25.0
Short-term Trading Call: bearish
Stock Market Commentary
Sellers put on another rare performance: major indices across the board broke down below their respective 50-day moving averages (DMAs). Following Friday’s bearish performance, I was expecting follow-on weakness. I was NOT expecting broad-based, major breakdowns.
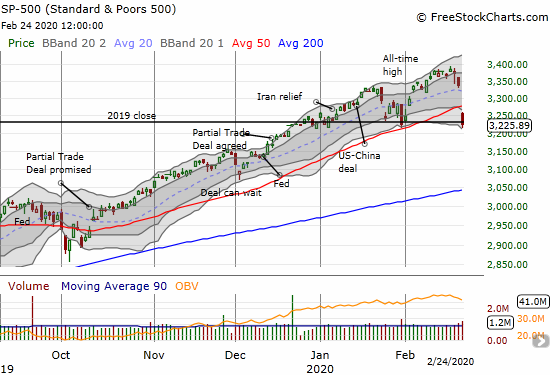
The S&P 500 (SPY) once again reversed all its gains for the year. The major index broke down below its 50DMA on a 3.4% loss.
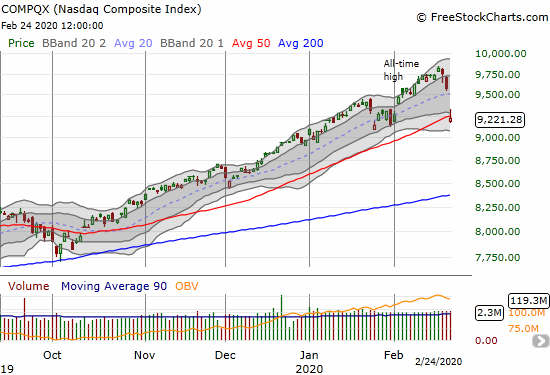
The NASDAQ (COMPQX) broke down below its 50DMA on a 3.7% loss. The tech-laden index is hanging on to a 2.8% year-to-date gain.
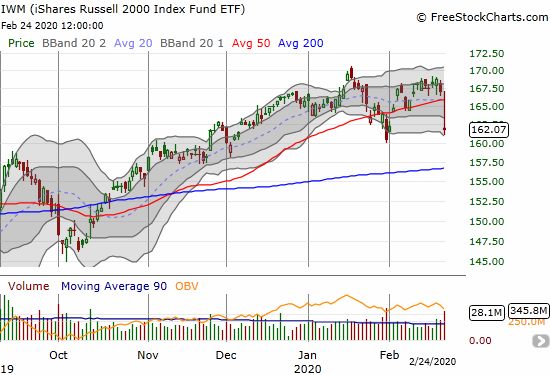
The iShares Russell 2000 Index Fund ETF (IWM) broke down below its 50DMA for a 3.0% loss. The index of small cap stocks is down 2.2% year-to-date.
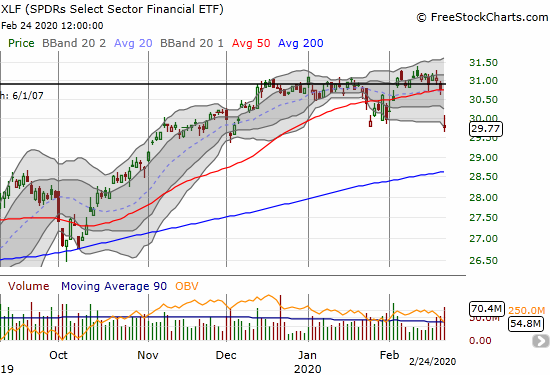
In late January, I noted the struggles of the SPDRS Select Sector Financial ETF (XLF) financials at its all-time high as part of my bearish thesis. XLF confirmed a topping pattern with its 50DMA breakdown on a 3.3% loss.
On and on it goes. These major indices are in bearish short-term patterns based on synchronized 50DMA breakdowns. This display is quite awesome to behold. My favorite technical indicator, AT40 (T2108), the percentage of stocks trading above their respective 40-day moving averages (DMAs), reflected the broad-based selling. AT40 fell from 48.9% to 34.3%, AT40’s lowest level since October 8, 2019. This plunge released pent-up selling pressure from weeks of bearish divergences with the S&P 500. It is also a 5-week delayed confirmation of the bearish implications of last month’s failure at the overbought threshold (70%).
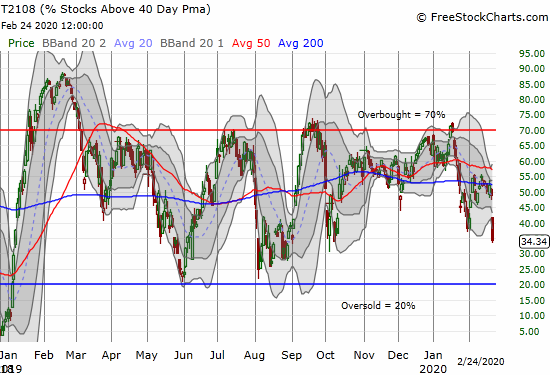
Recall that in a bullish market, the low 30s are “close enough” to oversold. However, I am staying bearish until 1) oversold trading conditions (AT40 below 20%), or 2) a confirmed 50DMA breakout on the S&P 500….whichever comes first. Note that of the last 5 sell-off cycles in the past 13 months, just two pullbacks stopped with AT40 in the low 30s.
AT40 (T2107), the percentage of stocks trading above their respective 200DMAs, made its first lower low since last summer. This longer-term indicator confirms that the market should be topped out for a while.
Volatility
For my last Above the 40 post, I noted the following: “the volatility index (VIX) avoided a retest of the 12 level. The next upward cycle kicked off on Thursday’s selling…I am assuming that the “pent-up” selling pressure in the market will not end until the VIX gets a close above 20. Last week’s VIX rally may have set such a move in motion with the 13.5 level serving as a higher low.” The VIX is already well above the elevated level of 20. The 14-month high rings the bell on fear and loathing in the stock market. Even the standard fare of volatility fading barely made a dent on the day.
The Short-Term Trading Call
As I mentioned in my last Above the 40 post, I came into this week without puts on the major indices and felt overly exposed. The synchronized 50DMA breakdowns confirmed I was overly exposed, but I also left a lot of money on the table. Implied volatilities spiked so much at the open that ALL my remaining puts and put spreads (on individual stocks) closed out at my target prices. I have NEVER experienced such a clean sweep.
After I collected myself, I executed on my strategy to aggressively go after SPY puts below my bear/bull line. I bought an SPY put spread expiring next week and a single SPY put expiring Friday. THAT put hit my target price, and I bought another on the market’s only bounce for the day. I also bought QQQ puts expiring next week. I will be looking to reload on more put options on the next market rally. I prefer a rally because the VIX at current levels makes options very expensive and subject to price implosions. As long as the VIX remains elevated I will prefer spread plays that sell volatility back to the market. Moreover, the VIX is unstable at these levels and cannot sustain itself on fear for long. While more churn lies ahead, the VIX could be at or near its highs for this cycle.
I am assuming the next market bounce will end at or around the S&P 500’s 50DMA.
Stock Chart Reviews – Below the 50DMA
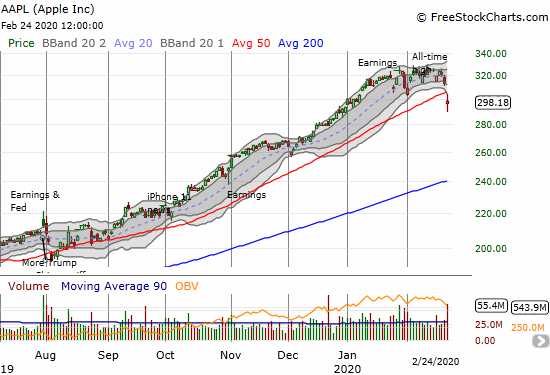
Apple (AAPL)
I remain conflicted on Apple (AAPL). The stock now has a clear topping pattern confirmed by a 50DMA breakdown, but my weekly call strategy continues to beckon. After my clean sweep of put options, I immediately thought to buy an AAPL call option. I took profits as soon as AAPL cracked $300 again. Toward the close I bought a calendar call spread at the $310 strike. This should be my fill of bullish plays while my short-term trading call sits at bearish.
It goes without saying that AAPL is one of the most important 50DMA breakdowns in the stock market. Will passive and automatic money pour right back in on schedule?
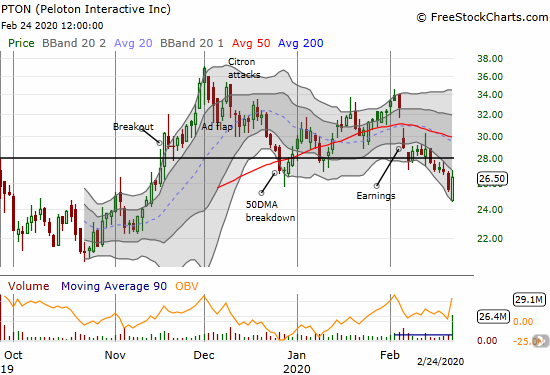
Peloton Interactive (PTON)
I just wrote about how the bearish breakdown in Peloton Interactive (PTON) opened up the next trading opportunity in the stock. Insiders indeed dumped stock onto the market. High-volume selling took PTON down to $24.50 but buyers stepped in right from there despite the breakdowns occurring across the stock market. Given the extreme short interest in PTON, I have to assume much of this buying was driven by shorts deciding this was as good as it gets. I switched up my strategy for now and bought March $25 put options near the highs of the day.
Stock Chart Reviews – Above the 50DMA
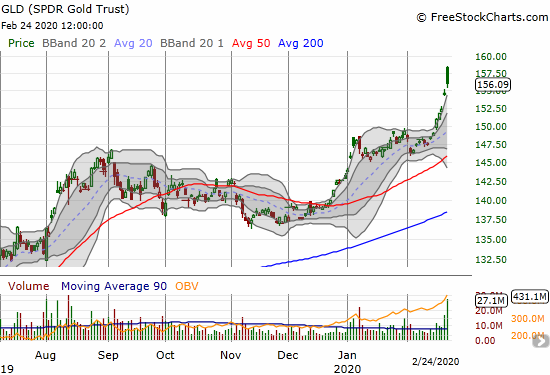
SPDR Gold Trust (GLD)
I thought I did well taking profits on my last round of call options on SPDR Gold Trust (GLD) during last week’s breakout above $150. At least I continue to hold my long-term GLD shares…and will continue to do so.
— – —
FOLLOW Dr. Duru’s commentary on financial markets via email, StockTwits, Twitter, and even Instagram!
“Above the 40” uses the percentage of stocks trading above their respective 40-day moving averages (DMAs) to assess the technical health of the stock market and to identify extremes in market sentiment that are likely to reverse. Abbreviated as AT40, Above the 40 is an alternative label for “T2108” which was created by Worden. Learn more about T2108 on my T2108 Resource Page. AT200, or T2107, measures the percentage of stocks trading above their respective 200DMAs.
Active AT40 (T2108) periods: Day #274 over 20%, Day #113 over 30% (overperiod), Day #11 under 40% (underperiod ending 14 days over 40%), Day #2 under 50%, Day #21 under 60%, Day #25 under 70%
Daily AT40 (T2108)
")
Black line: AT40 (T2108) (% measured on the right)
Red line: Overbought threshold (70%); Blue line: Oversold threshold (20%)
Weekly AT40 (T2108)

*All charts created using FreeStockCharts unless otherwise stated
The T2108 charts above are my LATEST updates independent of the date of this given AT40 post. For my latest AT40 post click here.
Be careful out there!
Full disclosure: long VIXY calls, long GLD, long SPY put spread, long QQQ put, long PTON puts
*Charting notes: FreeStockCharts stock prices are not adjusted for dividends. TradingView.com charts for currencies use Tokyo time as the start of the forex trading day. FreeStockCharts currency charts are based on Eastern U.S. time to define the trading day.