
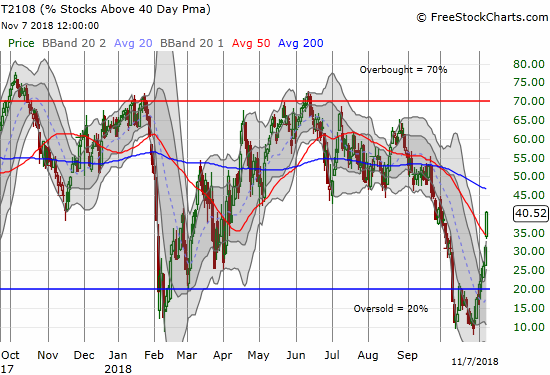
AT40 = 40.5% of stocks are trading above their respective 40-day moving averages (DMAs)
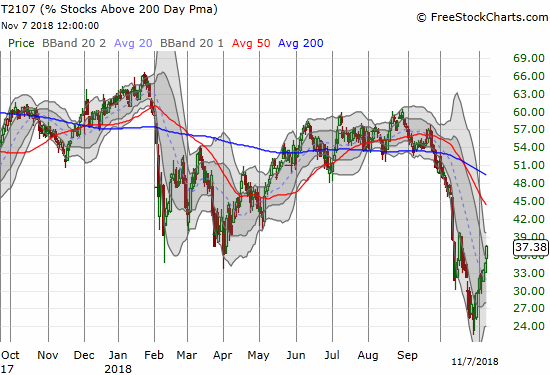
AT200 = 37.4% of stocks are trading above their respective 200DMAs
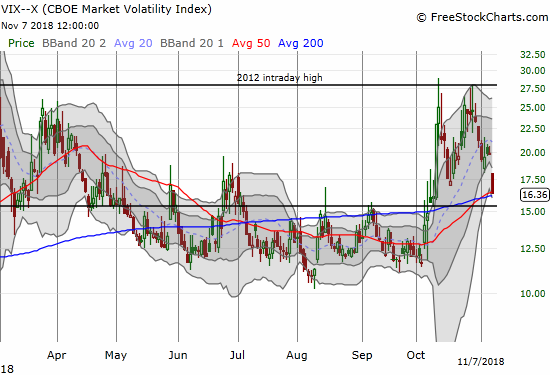
VIX = 16.4
Short-term Trading Call: bullish
Commentary
Financial markets made their votes very clear after the U.S. 2018 midterm election.
Apparently, today’s rally in the S&P 500 (SPY) was the index’s largest one-day post midterm election rally since 1982. This exclamation of a data point does not take into account the gains (or losses) preceding the big day, but I suppose an extreme reaction makes sense on the heels of what was an extreme struggle with oversold conditions that included a declining 200-day moving average (DMA) for the first time in 2 1/2 years.
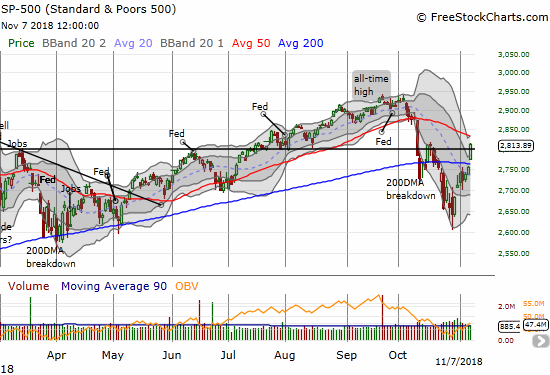
The S&P 500 closed at its high of the day, broke out above its 200DMA, and sliced through the 2800 level that proved so important starting in June (see the dark horizontal line in the above chart). The index is in a bullish position and looks ready to challenge its downward sloping 50DMA resistance directly overhead. The index will only flag the “all clear” after it finishes reversing all its losses from the big 50DMA breakdown that launched the market’s struggles with oversold trading conditions.
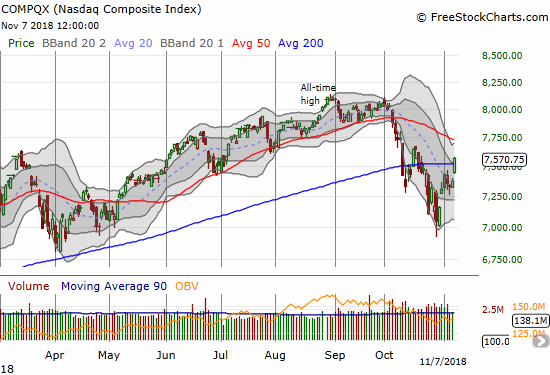
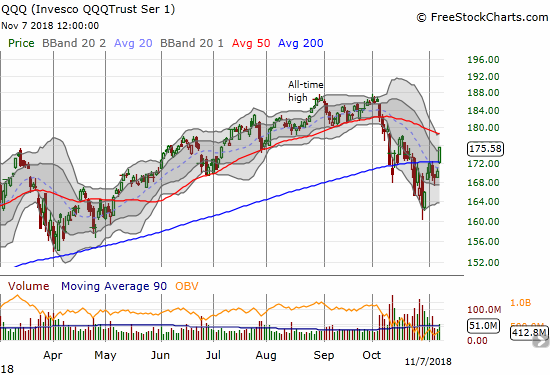
The NASDAQ and the Invesco QQQ Trust (QQQ) also gapped into 200DMA breakouts, adding to the market-wide exclamation points. Both tech-laden indices still have considerable headroom before challenging the first post-oversold high in October.
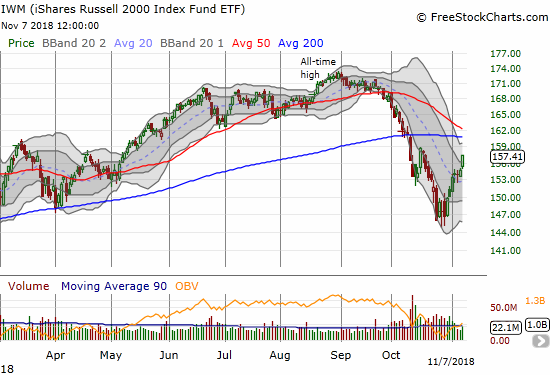
The iShares Russell 2000 ETF (IWM) lagged the bigger indices with a 1.8% gain. Small caps have the biggest challenge ahead as downtrending 50 and 200DMAs converge to provide what should prove to be stiff resistance. I am holding my core position of call options that I accumulated during the oversold period in anticipation of a rally into resistance by the end of next week.
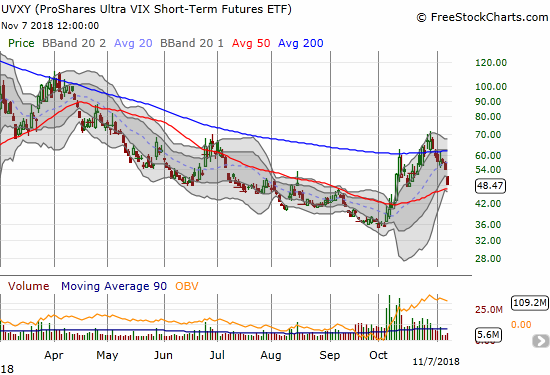
The volatility index, the VIX, featured prominently in my oversold trading strategy. The last tranche worked out spectacularly with one of the loudest exclamation points for this post-oversold period. I was focused on a post-election volatility implosion (again, without any prediction on the specifics of the outcome), and the market delivered. The VIX collapsed 17.8% and effectively reversed ALL its gains since the first oversold period began. This milestone is another bullish development. With a Federal Reserve pronouncement on monetary policy coming the next day, I did not want to take the risk of holding overnight my ProShares Ultra VIX Short-Term Futures (UVXY) put options which expire in just two days. In the near-term, I expect volatility gains to be more short-lived than during the oversold periods, so I am ready to continue fading the VIX.
As I wrote in the last Above the 40 post, long-term passive index investors should now feel comfortable returning to their regularly scheduled programming (a break of the oversold lows would change things of course). In the coming days, weeks, and months there will be a blitz of narratives and attempts to back into explanations of the market’s on-going machinations. The mid-term elections are over, but the same catalysts that the market has alternatively ignored and then obsessed over this year are largely still in place. This dynamic will provide plenty of fodder for distracting chatter that will open up short-term trading opportunities (swing trades) in what I expect to be an overall bullish trading environment through at least the end of the year.
AT40 (T2108), the percentage of stocks trading above their respective 40DMAs, soared today from 31.2% to 40.5% in a resounding confirmation of the bullish end to oversold trading conditions. AT40 rocketed off its historic low and kept slicing higher after the last oversold period ended. Even the conservative oversold trading strategy that triggers buys after the oversold period ends would have worked like a wonder. Note that between 40 and 60%, AT40’s level matters a lot less as it will be off the lower and upper extremes.
AT200 (T2107), the percentage of stocks trading above their respective 200DMAs, remains important as it still bears the scars of all the technical damage done through the two oversold periods in October. AT200 closed at 37.4% and has yet to pass its high following the first October oversold period. This longer-term breadth indicator still has a LONG way to go to wipe out October’s damaging losses.
The Australian dollar (FXA) versus the Japanese yen (FXY) is confirming the bullish tone with flashing green lights. AUD/JPY has rocketed right past the previous high. I ended my hedge going short the currency pair and will soon flip to ride the tiger (I also want to collect the carry and not pay it anymore!)
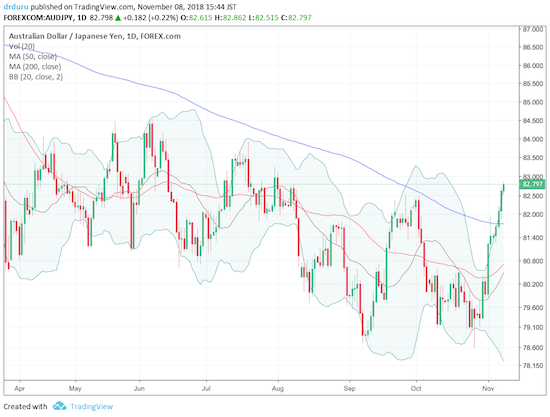
Source: Trading View
CHART REVIEWS
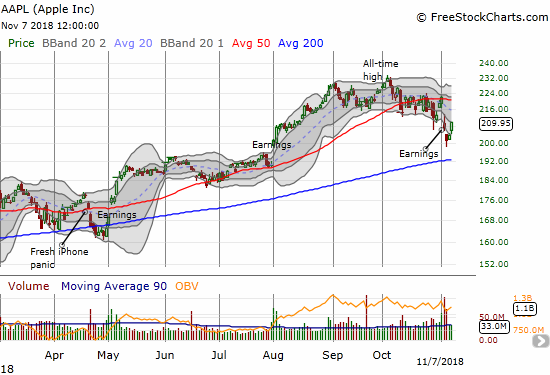
Apple (AAPL)
AAPL was one of the last stocks to fall in the oversold period. Still, earnings were strong enough to push the stock right off its pedestal. Now, AAPL is right back in conquer mode. Today’s amazing 3.0% gain reversed the losses from Monday’s latest manifestation of iPhone fears. With my earnings play likely to go out with a whimper, I reloaded on AAPL calls in Monday’s weakness. I closed out that position into today’s rally. With AAPL in the market buying up its stock with many billions in hand, AAPL becomes an ideal buy-the-dip target for swing trades.
Cash-rich companies are set to pour $2.5 trillion into buybacks, dividends and M&A this year from CNBC.
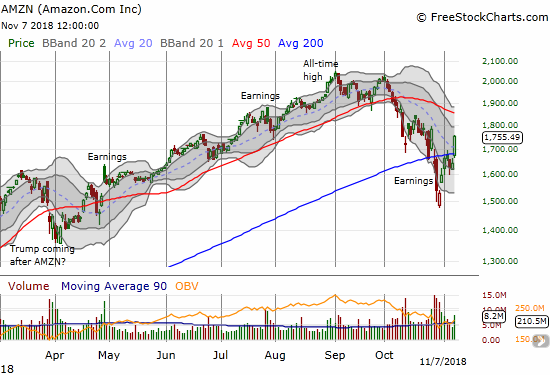
Amazon.com (AMZN)
AMZN is continuing an impressive post-earnings comeback. I had to rub my eyes twice when I saw its 113-point, 6.9% gain today. I was fortunate enough to open a fresh calendar call spread the previous day. Today’s gain triggered my sell point, but I definitely under-estimated the near-term upside potential!
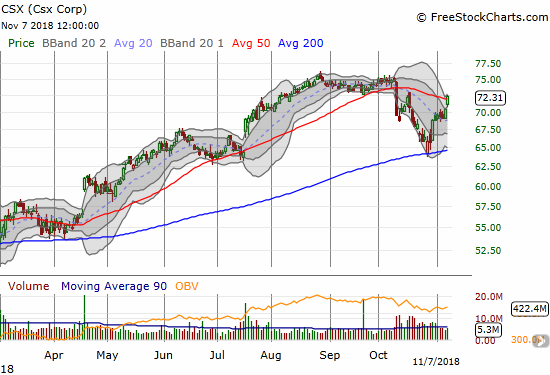
CSX Corporation (CSX)
CSX was one of my most aggressive positions that I accumulated during the oversold period. I took profits on today’s small 50DMA breakout. I am assuming the remaining upside opportunity is not big enough to risk continuing to hold call options which expire next Friday.
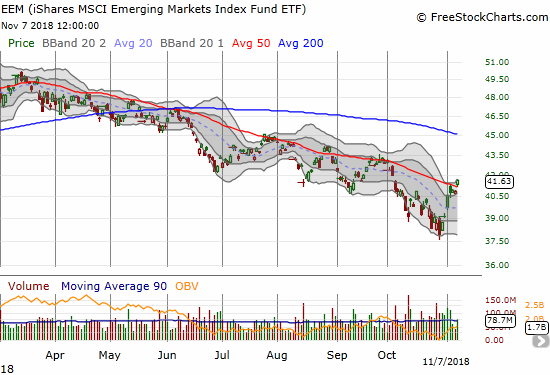
iShares MSCI Emerging Markets ETF (EEM)
I failed to add EEM to my shopping list during the oversold period. Fortunately, there is likely plenty of time to hop onto an emerging market recovery. EEM is 7.6% off its 19-month low, but it is well-defined by an on-going downtrend.
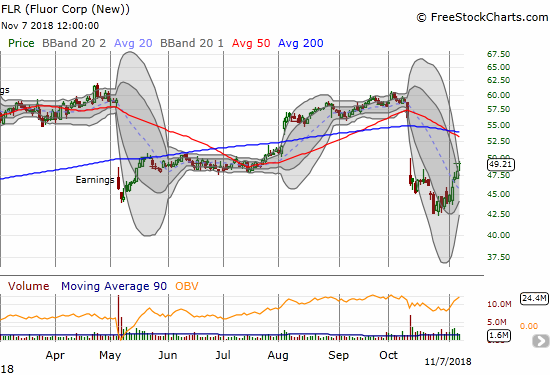
Fluor (FLR)
What I learned during FLR’s pre-earnings warning was enough to get me to buy call options ahead of earnings. The post-earnings drop was a disappointment, but the stock is now in recovery mode. Today’s 2.2% pop was enough to take me out of my position at a profit. (I still have a write-up outstanding on FLR!)
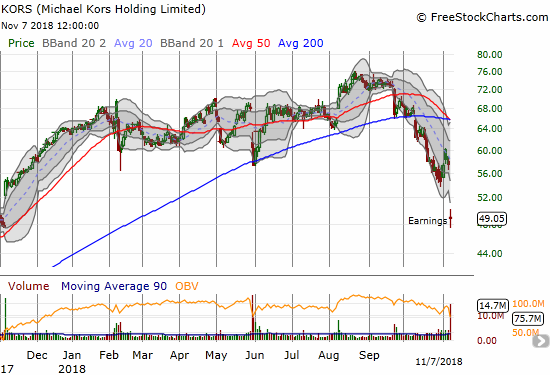
Kors Holdings (KORS)
KORS dropped 14.6% post-earnings. The stock nearly closed its gap up from November, 2017 earnings. KORS dropped Q3 earnings guidance but guided in-line for the year. So this looks like a golden buying opportunity. I will get in as soon as I see signs of strong buying like a move above today’s intraday high and/or the next post-earnings closing high.
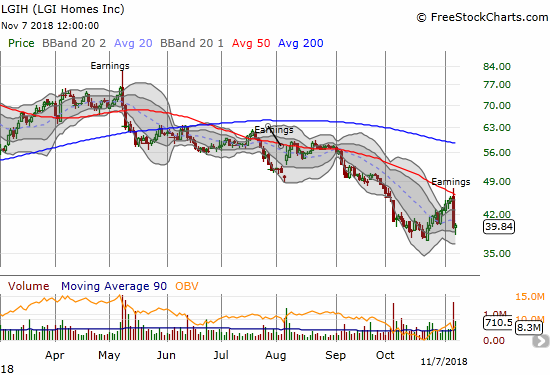
LGI Homes (LGIH)
LGIH ended the recent streak of home builders receiving positive post-earnings reactions. I will be warily watching to see whether the market returns to fading home builders. I will need to review LGIH’s earnings report for specific downside catalysts.
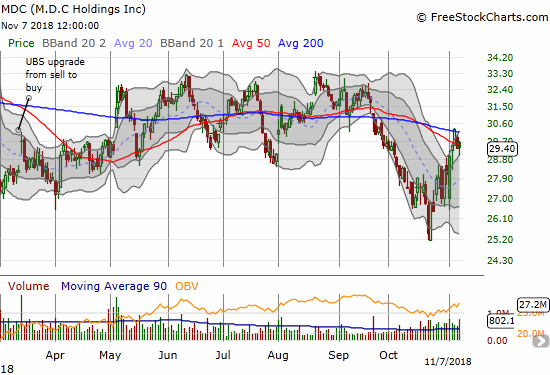
M.D.C. Holdings (MDC)
MDC was the last home builder I would have picked to lead the sector higher relative to technicals. Yet, here MDC is fresh off a challenge of 200DMA resistance. MDC even reversed all its losses from October.
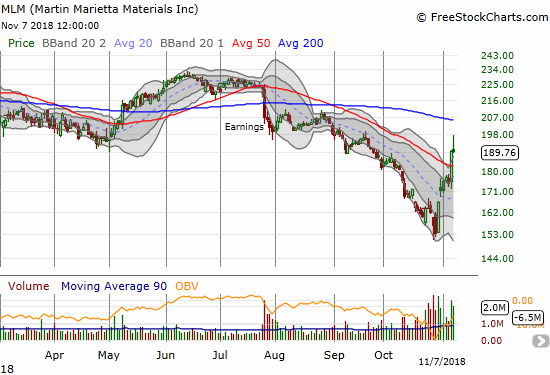
Martin Marietta Materials (MLM)
MLM was in the middle of a sharp V-shaped recovery from its 2 1/2 year low until today’s sharp fade from intraday highs. The upward momentum will now likely give way to churn and consolidation.
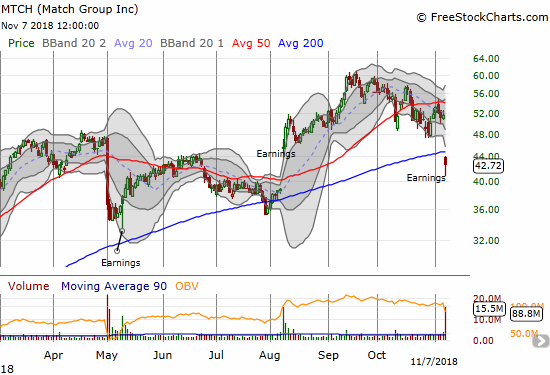
Match.com (MTCH)
Somehow MTCH kept itself above the market’s fray in October. The stock was no match for earnings though. The huge 17.0% post-earnings loss was enough to punch MTCH below its 200DMA for the first time in over 3 months. I am now looking for a reversal of August’s gap up before getting interested in buying the dip.
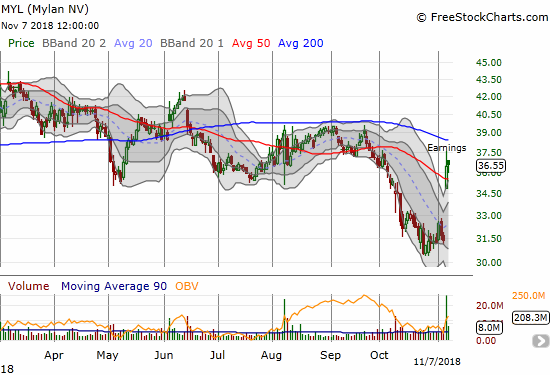
Mylan (MYL)
Much to my surprise, MYL did not even come close to hitting the $6 EPS target by March, 2018 that would have triggered a CEO bonus. The stock has now effectively gone nowhere for about 3 years with periodic bursts of excitement and disappointment. This week’s post-earnings pop saved the stock from what looked like a move to test the 2017 low. Still, MYL is down 13.6% year-to-date.
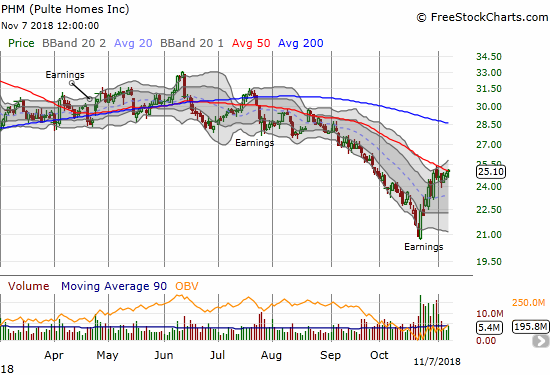
PulteGroup (PHM)
PHM is up 20.2% from its 21-month low. The stock took a rest right under 50DMA resistance and now looks ready to press higher. I am still hoping to get a dip to buy – at least 5%.
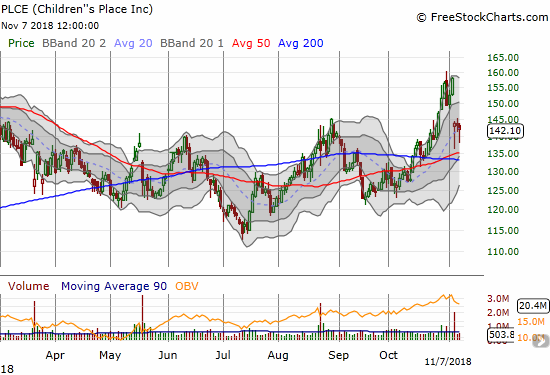
Children’s Place (PLCE)
PLCE is a great example of the short-term opportunities I look for in the wake of the angst of an oversold period. PLCE’s announcement of executive departures sent the stock reeling. Yet, the company included reassuring news on its financial performance…
“We delivered positive comp sales every month in Q3 resulting in a positive high single digit comp for the quarter. In light of our strong performance, we are reaffirming our Q3 EPS guidance. Importantly, our inventory is in great shape as we enter Q4.”
That was all I needed to get ready to buy. With the stock two points off the bottom, I first bought shares and put in a low bid for a call option. The subsequent rally surprised me as I did not expect buyers to show up in such force so quickly. I was able to take profits on both positions as PLCE returned to its opening price.
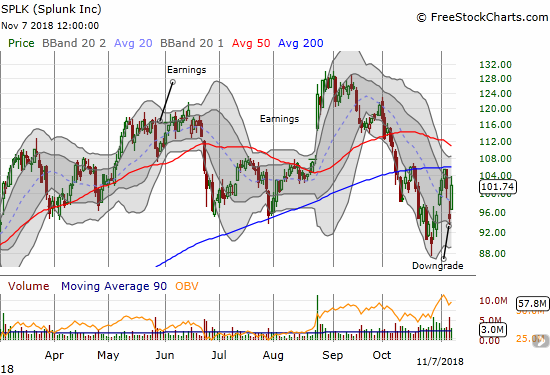
Splunk (SPLK)
SPLK delivered another kind of post-oversold angst buying opportunity. A simple downgrade to “market perform” was enough to send the stock reeling and a 2/3 reversal of its gains off the low from the last oversold period. I bought a single call option as I suspected I might get an opportunity to add more at lower prices. That opportunity did not come. Instead, SPLK surged the very next day with a 7.2% gain. Needless to say I took profits in the middle of the rally. I think the pop was a combination of the tailwind of a market rally and sympathy buying in the wake of strong post-earnings performances of other stocks in the sector like Tableau (DATA).
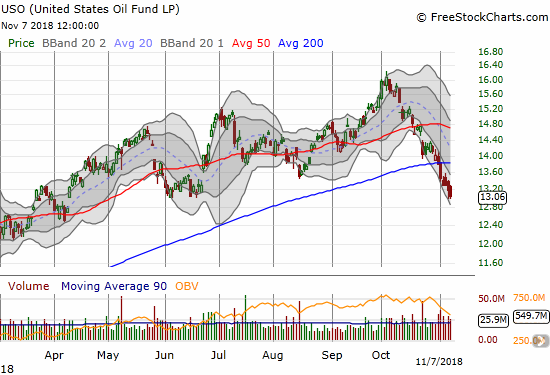
United States Oil (USO)
While November provides relief for the stock market, oil continues its sell-off. USO has yet to notch a daily gain in November. Its lower Bollinger Band (BB) channel is guiding the trading action ever lower.
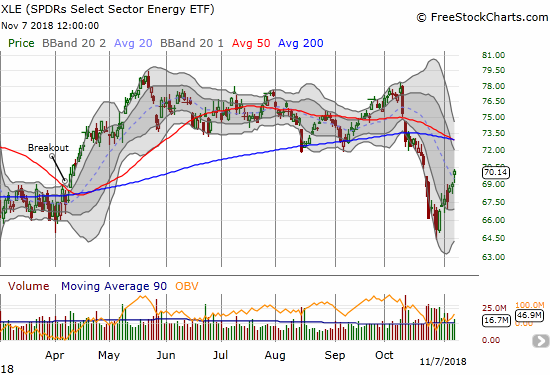
Energy Select Sector SPDR ETF (XLE)
XLE is keeping pace with the market’s post-oversold rally despite oil’s sell-off. I am wondering how long this can last…
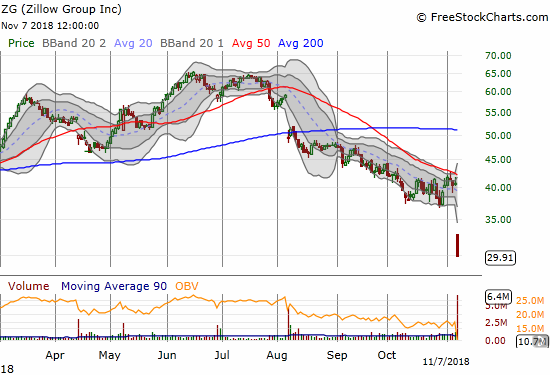
Zillow Group (ZG)
I guess I should have triggered a third round of my long Redfin (RDFN) versus short ZG pairs trade! ZG suffered a stomach-churning post-earnings 26.6% loss. At least unlike RDFN, ZG did not seem to say anything which tanked home builders. (Yet another earnings report I need to review closely).
— – —
FOLLOW Dr. Duru’s commentary on financial markets via email, StockTwits, Twitter, and even Instagram!
“Above the 40” uses the percentage of stocks trading above their respective 40-day moving averages (DMAs) to assess the technical health of the stock market and to identify extremes in market sentiment that are likely to reverse. Abbreviated as AT40, Above the 40 is an alternative label for “T2108” which was created by Worden. Learn more about T2108 on my T2108 Resource Page. AT200, or T2107, measures the percentage of stocks trading above their respective 200DMAs.
Active AT40 (T2108) periods: Day #5 over 20%, Day #2 over 30%, Day #1 over 40% (overperiod), Day #33 under 50% (underperiod), Day #49 under 60%, Day #102 under 70%
Daily AT40 (T2108)
")
Black line: AT40 (T2108) (% measured on the right)
Red line: Overbought threshold (70%); Blue line: Oversold threshold (20%)
Weekly AT40 (T2108)

*All charts created using freestockcharts.com unless otherwise stated
The charts above are my LATEST updates independent of the date of this given AT40 post. For my latest AT40 post click here.
Related links:
The AT40 (T2108) Resource Page
You can follow real-time T2108 commentary on twitter using the #T2108 or #AT40 hashtags. T2108-related trades and other trades are occasionally posted on twitter using the #120trade hashtag.
Be careful out there!
Full disclosure: long SSO, long AAPL calls, long IWM calls, long AUD/JPY
*Charting notes: FreeStockCharts.com stock prices are not adjusted for dividends. TradingView.com charts for currencies use Tokyo time as the start of the forex trading day. FreeStockCharts.com currency charts are based on Eastern U.S. time to define the trading day.