
AT40 = 11.9% of stocks are trading above their respective 40-day moving averages (DMAs) – (as high as 15.6%) 9th day of oversold period following 4-day oversold period
AT200 = 25.4% of stocks are trading above their respective 200DMAs (as high as 29.3%)
VIX = 24.7 (as high as 27.9)
Short-term Trading Call: bullish
Commentary
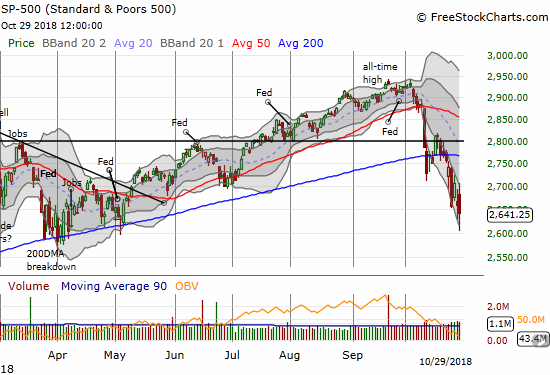
The trading day started off well but ended in a calamity as sellers took over up to the last 15 minutes or so of the close. As a result of another day of yo-yo trading action, I was expecting to see AT40 (T2108), the percentage of stocks trading above their respective 40-day moving averages (DMAs), close lower and present a new intraday low for this oversold period. Instead, I was pleasantly surprised to see AT40 held onto a GAIN for the day and closed up 2 percentage points. This pop delivered a bullish divergence from the S&P 500 (SPY) which lost another 0.7% on the day and closed near a fresh 6-month low. The intraday low got dangerously close to 2018’s closing lows.
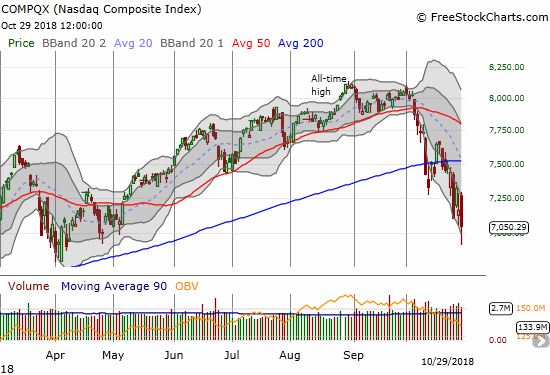
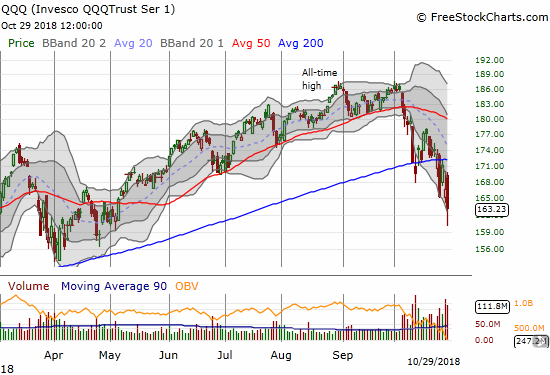
The NASDAQ and the Invesco QQQ Trust (QQQ) also lost on the day after initially strong rallies and steep intraday lows. Like the S&P 500, the NASDAQ got dangerously close to its closing lows of the year.
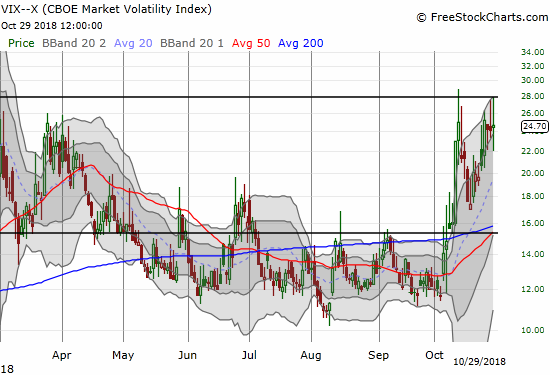
The volatility index, the VIX, also experienced a wide range on the day. Most importantly, it faded from an intraday high that fell back from the intraday high of the previous oversold period. (The horizontal line marks the intraday high of the VIX in 2012).
Adding a bit to my optimism over the bullish divergence is a very strong bounce in the Australian dollar (FXA) versus the Japanese yen (JPY) at the time of writing. This move creates its own bullish divergence with the stock market. AUD/JPY is trading right at 80 and a 6-day high. This strength augurs well for Tuesday’s trading at a minimum.
Monday evening technician Carter Worth appeared on CNBC’s Fast Money to deliver a cold splash of reality on the current correction. He used historical data since 1927 to show that the S&P 500’s 11% drawdown in October is very normal and unremarkable. He used a decade long trading channel to estimate a low target on the S&P 500 at 2300.
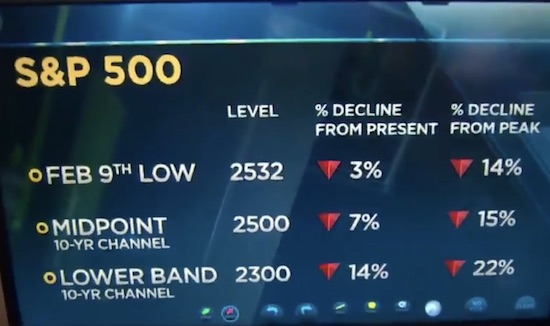
The S&P 500 closed in a correction today. If you're thinking about stepping in to buy here, you might want to listen to what Chart Master Carter Worth has to say first. pic.twitter.com/jPRtI0q1TR
— CNBC's Fast Money (@CNBCFastMoney) October 29, 2018
Worth’s analysis made me take another look at the 200DMA Signal I updated in the last Above the 40 post. While the overall historical record shows that the majority of sell-offs have delivered almost all their pain by the time the S&P 500’s 200DMA declines for 5 straight days (today was the fourth straight decline), I noticed a disturbing undercurrent. Of the six times the S&P 500 crossed correction territory (a 10% pullback) at the 200DMa trigger point of 5 days of declines, FIVE occurrences went on to deliver massive drawdowns from 21% to 49%! The only exception was the LAST such pullback that came with the 2015 flash crash and then the early 2016 sell-off. The data are almost enough to push me to downgrade my short-term trading call to cautiously bullish. My thoughts on these risks are still evolving, so I encourage readers to check out the above video of Worth’s analysis.
As has been my pattern, I used the rally to sell my latest SPY call options. I also sold my call options in Splunk (SPLK). I used the subsequent pullback to buy a new tranche of SPY call options. The intraday lows allowed me to double down. Unlike Friday’s trade, I was able to add to my ProShares Ultra VIX Short-Term Futures (UVXY) put options. The bullish divergence has put me in a more aggressive mood to pick up more stocks from my buying shopping list. I am also looking to hold my SPY calls past the next rally.
On the hedging side, I flipped put options on Caterpillar (CAT) intraday, shorted Illinois Tool Works (ITW) with call options to cap any losses, and bought calendar put spreads on Nvidia (NVDA) and Goldman Sachs (GS). These spreads are effectively hedges I am preparing for NEXT week. For good measure, I bought an out-of-the-money put option on Tesla (TSLA) (I was a bit late on that fade idea). All this hedging of course has the look of cautious bullishness, but I am not making the change as I am on the verge of becoming an aggressive buyer.
CHART REVIEWS
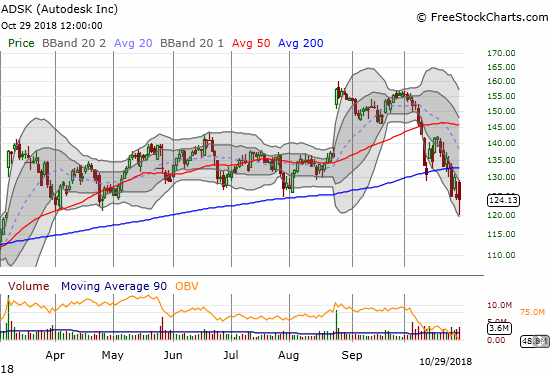
Autodesk (ADSK)
Last week ADSK broke down from 200DMA support, but if it can hold current support the stock goes on my (post-earnings) buying list for this oversold period.
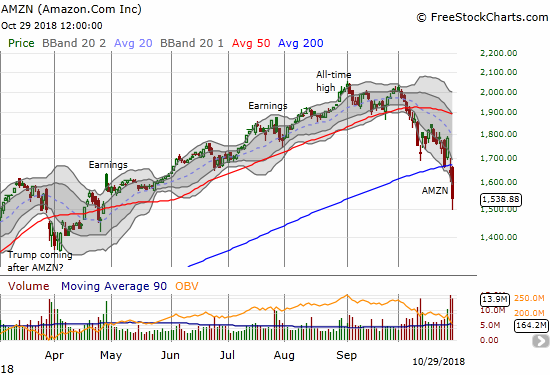
Amazon.com (AMZN)
I was clearly way too early on my post-earnings trade in AMZN. The stock continued its collapse with a 6.3% loss. The short-side of the calendar call spread will certainly expire worthless this week, but the long side has a LONG way to go next week!
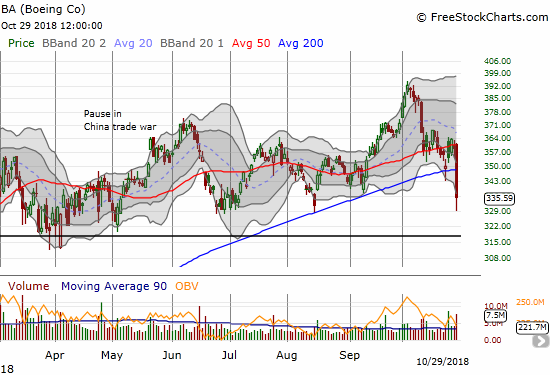
Boeing (BA)
BA is on my list of stocks to fade as a hedge, but I somehow passed it over today. The stock wiped out its post-earnings gain to close with a 6.6% loss and its first sub-200DMA close in about two years!
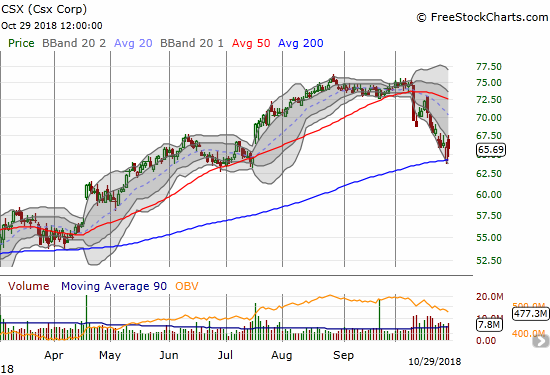
CSX Corporation (CSX)
I have long lamented missing the run-up in CSX. I am looking to this sell-off to deliver a golden buying opportunity. The stock is already tempting here as it holds 200DMA support and finished reversing the post-earnings gap up from July. Still, my main hesitation comes from an October post-earnings response that confirmed 20/50DMA resistance with a bearish engulfing pattern.
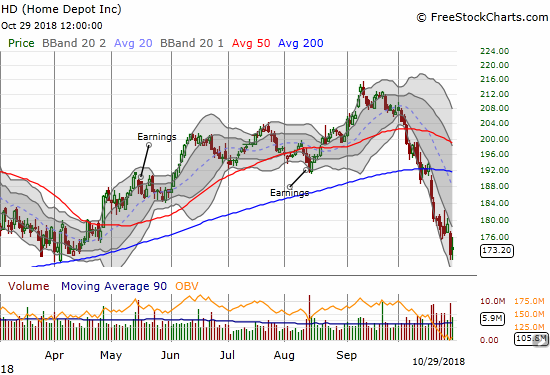
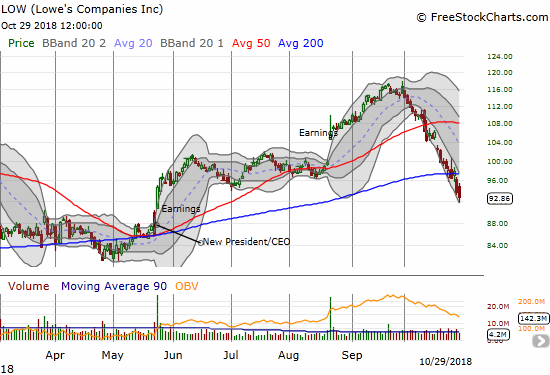
Home Depot (HD) and Lowe’s (LOW)
HD and LOW came with very seductive narratives ahead of the current market sell-off. The stocks were trading upward and counter to the sell-off and malaise in home builder stocks. October suddenly changed everything. HD is now struggling at its 2018 low and LOW confirmed a 200DMA breakdown with its 1.0% loss.
— – —
FOLLOW Dr. Duru’s commentary on financial markets via email, StockTwits, Twitter, and even Instagram!
“Above the 40” uses the percentage of stocks trading above their respective 40-day moving averages (DMAs) to assess the technical health of the stock market and to identify extremes in market sentiment that are likely to reverse. Abbreviated as AT40, Above the 40 is an alternative label for “T2108” which was created by Worden. Learn more about T2108 on my T2108 Resource Page. AT200, or T2107, measures the percentage of stocks trading above their respective 200DMAs.
Active AT40 (T2108) periods: Day #9 under 20% (oversold), Day #14 under 30%, Day #21 under 40%, Day #26 under 50%, Day #42 under 60%, Day #95 under 70%
Daily AT40 (T2108)
")
Black line: AT40 (T2108) (% measured on the right)
Red line: Overbought threshold (70%); Blue line: Oversold threshold (20%)
Weekly AT40 (T2108)

*All charts created using freestockcharts.com unless otherwise stated
The charts above are my LATEST updates independent of the date of this given AT40 post. For my latest AT40 post click here.
Related links:
The AT40 (T2108) Resource Page
You can follow real-time T2108 commentary on twitter using the #T2108 or #AT40 hashtags. T2108-related trades and other trades are occasionally posted on twitter using the #120trade hashtag.
Be careful out there!
Full disclosure: long UVXY puts, long SPY calls, long AMZN calendar call spread, short ITW and long calls, long GS calendar put spread, long NVDA calendar put spread, long TSLA put and call spread
*Charting notes: FreeStockCharts.com stock prices are not adjusted for dividends. TradingView.com charts for currencies use Tokyo time as the start of the forex trading day. FreeStockCharts.com currency charts are based on Eastern U.S. time to define the trading day.