

The Market Breadth Summary
- Equity markets remained under pressure as war weary sentiment amplifies uncertainty around geopolitics, inflation, monetary policy, and growth.
- Market breadth stayed weak, with AT50 hovering near oversold territory but not yet delivering a reliable bullish signal in the current context.
- The S&P 500 and NASDAQ show meaningful technical deterioration, including failed rebounds and persistent selling below key moving averages.
- Oil prices continue to act as the market’s central stress point, reinforcing inflation concerns and weighing on risk assets.
- The VIX trend suggests fear has accelerated, indicating that oversold conditions alone may not be enough to produce a durable bottom.
- Leadership groups such as semiconductors show damage, signaling broad-based market weakness.
Stock Market Commentary
Uncertainty is the theme for this market, extreme uncertainty in geopolitics, economic conditions, monetary policy, and domestic politics. The accumulated uncertainty has made the market war weary and exhausted buyers. This exhaustion dampens the potential for oversold conditions to deliver a meaningful bounce in the stock market. For example, the major indices have suffered five straight negative weekly closes. The NASDAQ has suffered losses in 10 of the last 11 weeks. All this persistent selling should exhaust sellers by now, not buyers.
The war has turned oil into the core irritant for financial markets. Elevated and rising oil prices along with a supply crisis raise the specter of inflation and a global economic slowdown. Until proven otherwise, oil’s path of least resistance points upward. Yet, I am wary of making predictions on direction of the market’s response to oil’s volatility. Instead, I am sticking to the technicals even tighter than usual. Price and volume action should continue to reveal market sentiment.
The Stock Market Indices
S&P 500 (SPY)
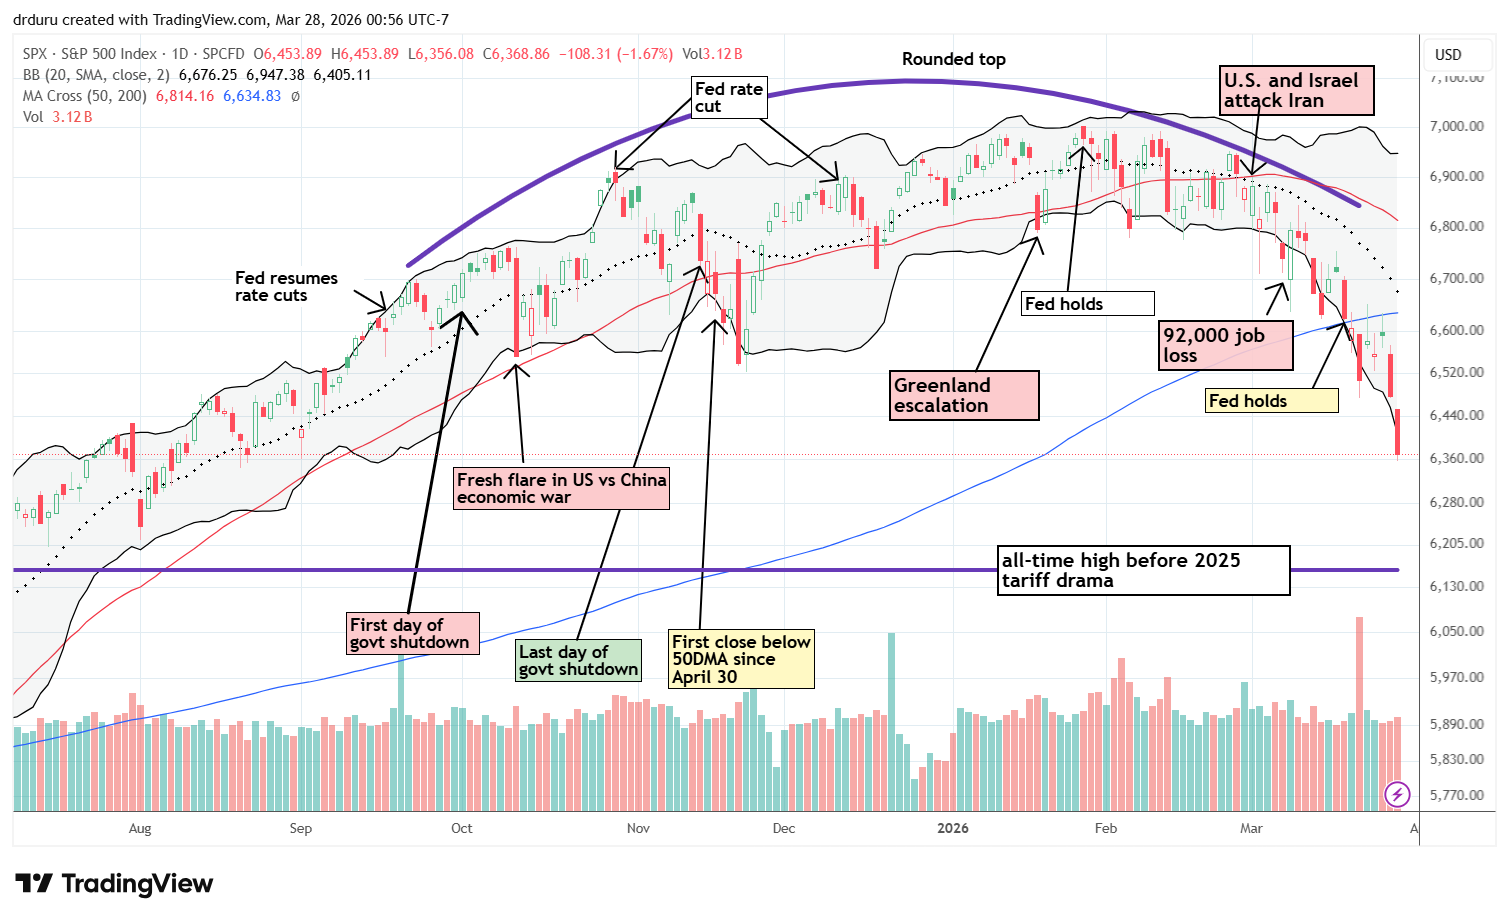
The S&P 500 confirmed its rounded top (the purple line below) with last week’s confirmed 200DMA breakdown. On Monday, the index rallied 1.1% and even briefly traded above its 200DMA. However, sellers quickly faded the price action to a close below resistance. Buyers made two more attempts to challenge 200DMA resistance before the accelerated selling of Thursday and Friday. Not even the President’s extension of the deadline given to Iran regarding the Strait of Hormuz provided relief to the market on Friday. The gap down at the open spoke volumes about how a war weary market is giving way to the pressures of uncertainty. At a near 8-month low, the index is deeply bearish.
The technical damage is significant. Even if the market immediately rebounds from its over-extension below the lower Bollinger Band (BB), buyers will need a lot of time to invalidate the topping pattern. The downside looks quite precarious given the few supports left before last April’s low. The all-time high before that April low looks like the most significant support left…around 6160.
NASDAQ (COMPQ)
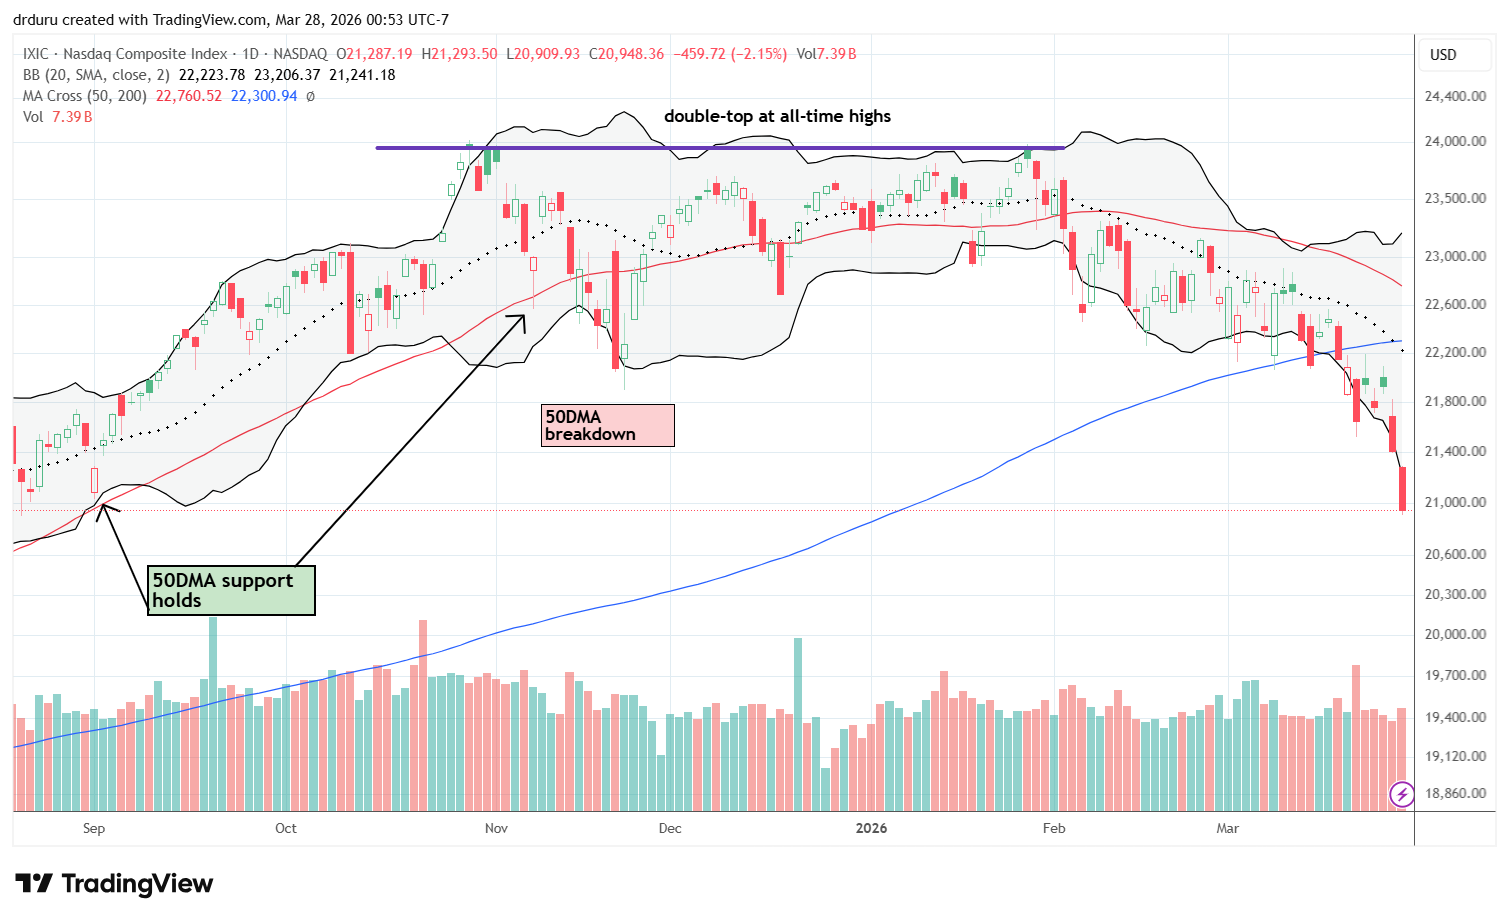
The NASDAQ continues to look worse than the S&P 500 does. The tech-laden index has been bearish for quite some time, including trading down 10 of the last 11 weeks. Unlike the S&P 500, the NASDAQ failed to test its 200DMA resistance. The NASDAQ stayed decisively below that resistance and accelerated lower to an 8-month closing low. The index is even in correction territory with a 13% pullback from its all-time high last October. That all-time high formed the first part of the double-top.
iShares Russell 2000 ETF (IWM)
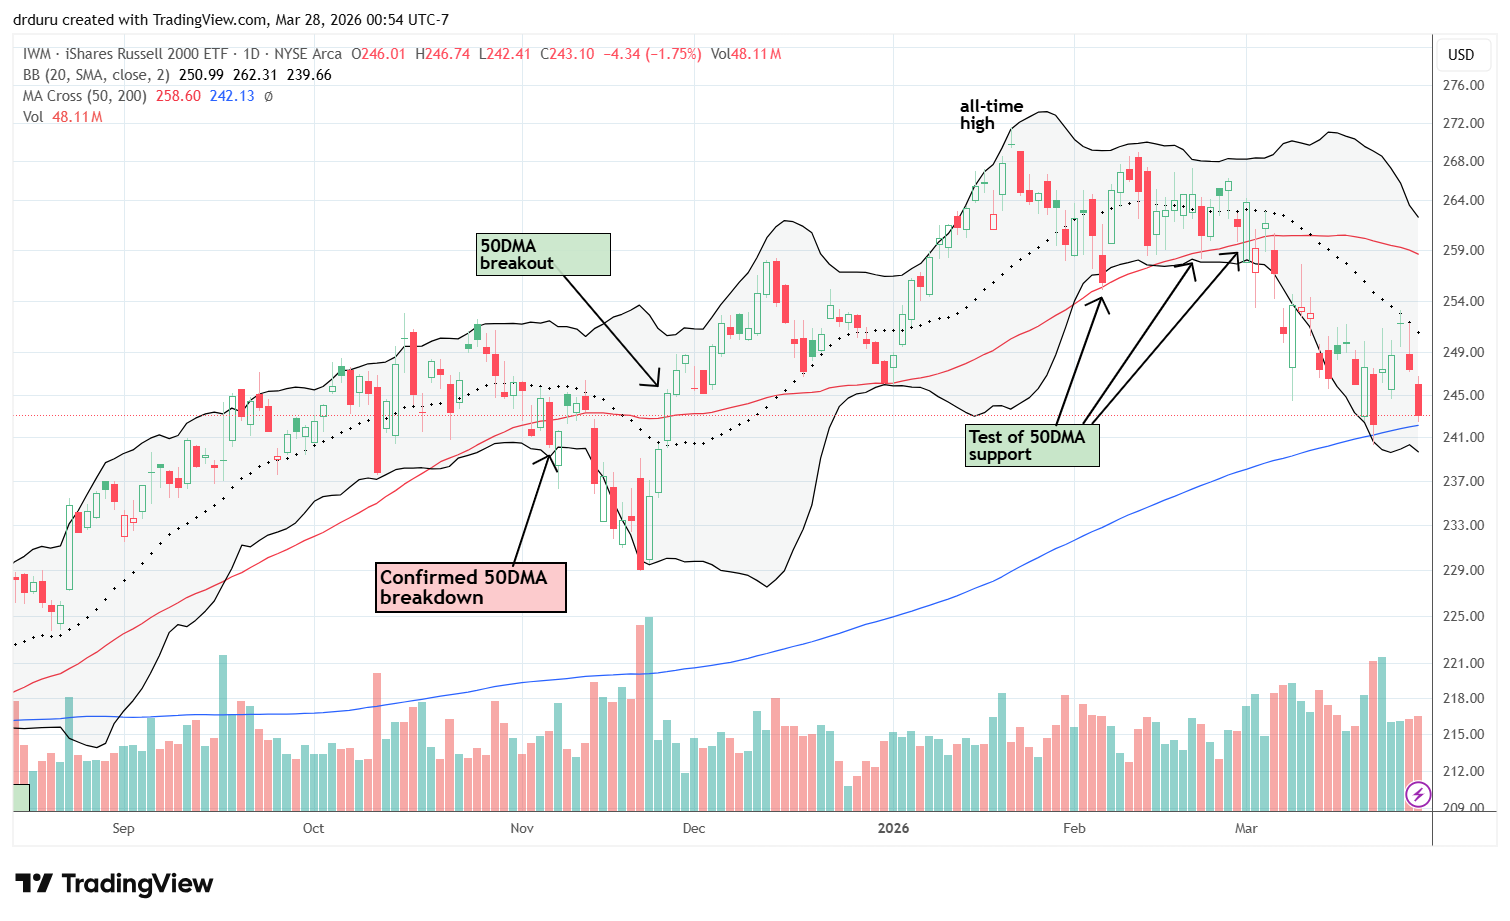
IWM somehow held up better than the other major indices. The ETF of small caps managed to close the week without breaching 200DMA support. IWM even avoided closing below its low from the previous week.
Yet, I got overconfident again with my IWM call option trade. I was holding the long side of a calendar call spread as IWM closed Wednesday with a test of 20DMA resistance (the dashed line). I held out for a breakout that never came. Thursday’s fade from 20DMA resistance brought the trade to a crashing end. Although IWM looks well-positioned for a successful test of 200DMA support, I decided to wait until next week to decide on a fresh trade. I will only continue to trade the call options as long as IWM remains above its 200DMA support.
The Short-Term Trading Call With the War Weary
- AT50 (MMFI) = 24.0% of stocks are trading above their respective 50-day moving averages
- AT200 (MMTH) = 42.7% of stocks are trading above their respective 200-day moving averages
- Short-term Trading Call: neutral
A week ago, I laid out the conditions for changing my short-term trading call on the market from neutral to bullish. Somehow, the stock market managed to avoid both conditions. I watched for either the S&P 500 to close above its 200-day moving average (DMA) resistance or for more deep selling to push market breadth to close in oversold territory. Instead, the market navigated right between those alternative scenarios.
AT50 (MMFI), the percentage of stocks trading above their respective 50DMAs, closed the week at 24.0%. My favorite technical indicator had three up days to start the week (mainly thanks to small caps). The bounce looked like a classic rebound from (close enough) oversold conditions. Yet, I could not get bullish because the S&P 500 consistently failed at 200DMA resistance. Market breadth reversed sharply in the final two days of the trading week. This failed rebound means I cannot conclude AT50 is again close enough to oversold. Now I need to see AT50 close below the 20% oversold threshold before a bullish trigger of the AT50 trading rules.
")
AT200 (MMTH), the percentage of stocks trading above their respective 200DMAs, looks even more concerning. After breaking out above its primary downtrend, AT200 faded sharply back to its low from the previous week. That low stands as a 9-month low. While I do not maintain trading rules for AT200, continued losses from here will make me very cautious about an ensuing oversold trading period.
")
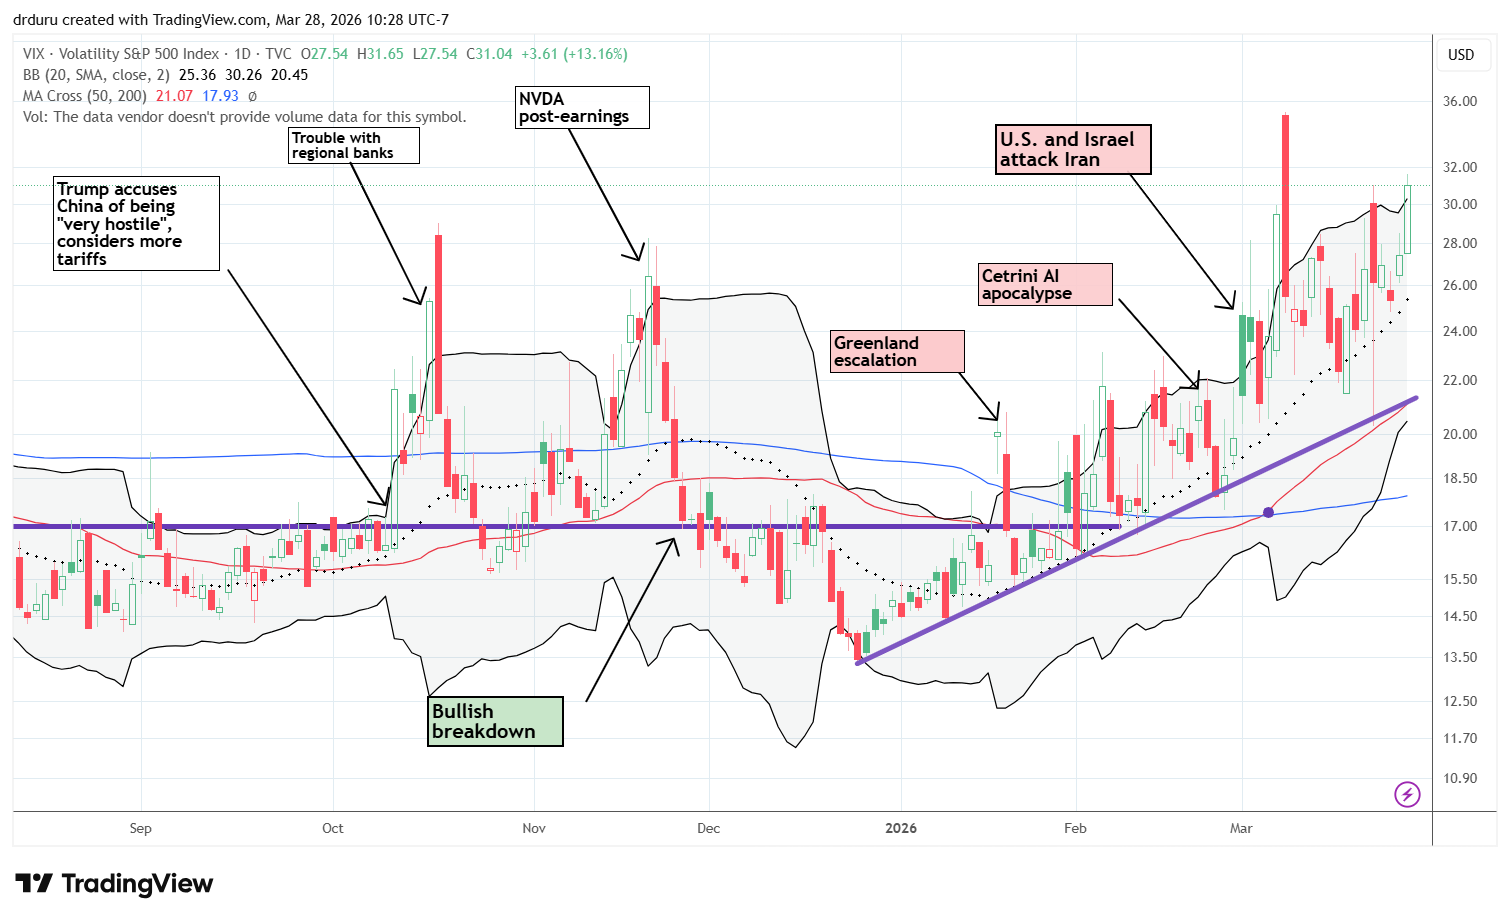
In other words, oversold is simply not enough for this war weary market. The volatility index (VIX) is now a key indicator paired with AT50. The chart below shows that the VIX’s year-long uptrend accelerated to the upside in March. Thus, the market’s sentiment about the war is in control. The VIX gained 13.2% on Friday and made a new closing high for the year. The volatility index last closed at this level back in April. This surge puts a trade above the year’s intraday high into play. Per the AT50 trading rules, an elevated VIX in oversold conditions puts most swing trades on hold until some kind of blow-off top. March 9th’s fade from an open at 35 to a close at 26 was a classic blow-off top. However, further escalation of the war truncated that buy signal. That episode will remind me that trades in a war weary market will likely be quite fragile.
In case you missed it…
I reviewed the uncertainty in monetary policy. The market’s rate expectations quickly flipped from debating over one or two rate cuts this year to the possibility of rate hikes.
United States Oil Fund (USO)
Description: United States Oil Fund, LP is an exchange-traded security designed to track the daily price movements of light, sweet crude oil.
Technical status: United States Oil Fund (USO) rose off 20DMA support and closed at a new high for this war cycle.
Trade commentary: I am now reviewing USO multiple times a day. This war weary market reacts quickly to oil. So USO has become the first place to understand the stock market. No matter the political and military headlines and declarations, oil is showing a persistent concern. USO ended the week at a closing high for this cycle and took the market down for the ride. USO last closed this high October, 2018. Note that while trading volume trended down for the week, it remains quite elevated relative to pre-war levels. USO is up 51.6% month-to-date.
")
iShares 20+ Year Treasury Bond ETF (TLT)
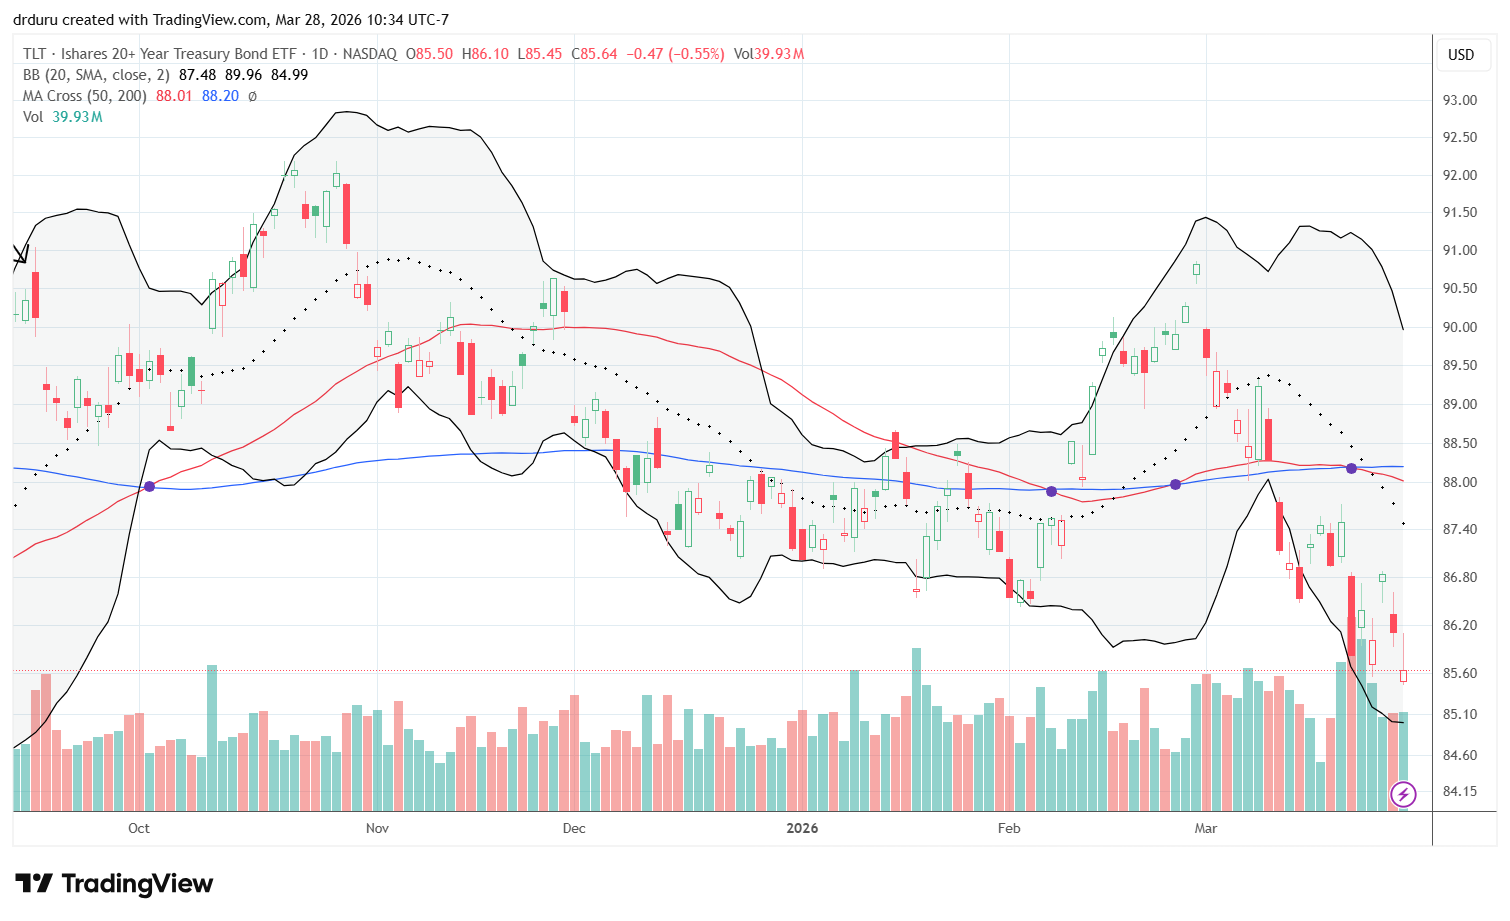
Description: The iShares 20+ Year Treasury Bond ETF seeks to track the investment results of an index composed of U.S. Treasury bonds with remaining maturities greater than twenty years.
Technical status: The iShares 20+ Year Treasury Bond ETF (TLT) sank to a new low for this cycle. The chart broke down to levels last seen around last July.
Trade commentary: My contrarian trade in TLT is not working. TLT’s decline all month reflects the dominance of inflation fears over safe haven bond flows. Moreover, escalating war and carnage in Iran and surrounding countries raises the specter of greatly expanded government spending. If a recession hits, I will not be surprised if TLT declines further as bond players anticipate budget-busting spending to try to prop up the economy. These treacherous dynamics have forced me to pause the contrarian buys!
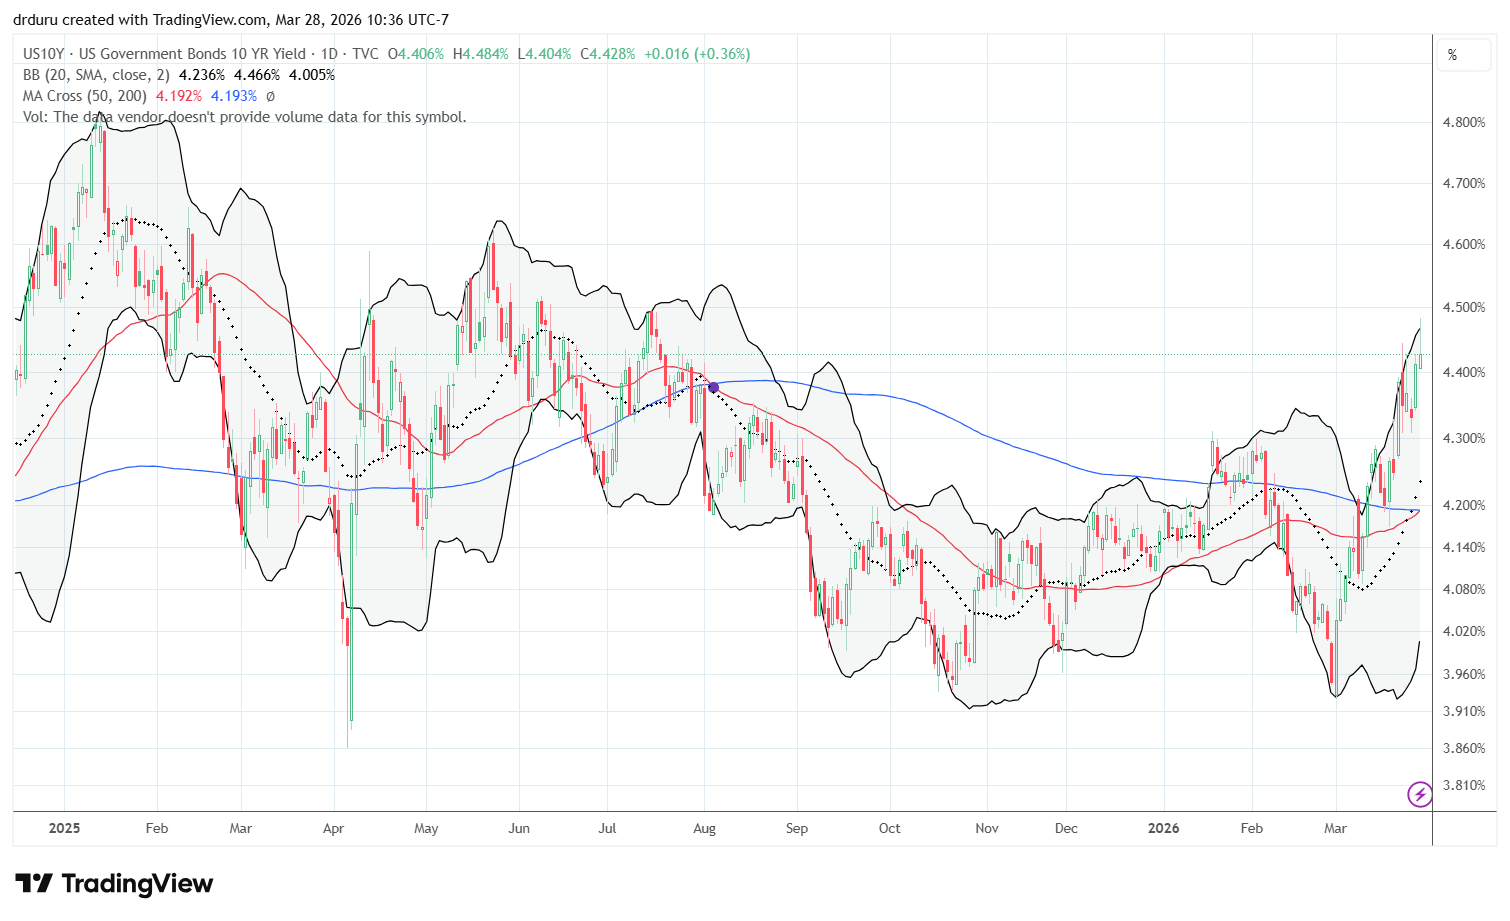
I have added the 10-year treasury bond to my watchlist. The stock market cares most directly about this maturity. Again, the direct correlation between rising bond yields and rising oil prices is no accident. Just like the VIX uptrend symbolizes the current trouble for stocks, an uptrend in the 10-year Treasury bond confirms more trouble ahead of stocks.
Invesco S&P 500 Equal Weight ETF (RSP)
Description: Invesco S&P 500 Equal Weight ETF (RSP) is based on the S&P 500 Equal Weight Index and invests at least 90% of its total assets in the securities that comprise the index.
Technical status: Invesco S&P 500 Equal Weight ETF (RSP) continued its struggle as it broke down below its 200DMA, falling to mid-2025 levels.
Trade commentary: RSP really drives home the view of poor trading conditions. Before March madness, non-tech stocks and small caps helped to buoy market breadth. RSP has not been the same since the war started against Iran. The steep downtrend for RSP dragged it into a 200DMA breakdown on Friday. Being equally weighted across S&P 500 stocks, RSP represents a kind of breadth indicator. Right now, RSP demonstrates the breadth of the selling pressure across the market’s largest stocks.
")
VanEck Semiconductor ETF (SMH)
Description: VanEck Semiconductor ETF (SMH) seeks to replicate as closely as possible the price and yield performance of an index tracking the overall performance of companies involved in semiconductor production and equipment.
Technical status: VanEck Semiconductor ETF (SMH) struggled against 50DMA resistance throughout the month before closing below its lower Bollinger Band at its low for the year.
Trade commentary: I kept waiting for SMH to break out above 50DMA resistance (the red line) and from there pull the rest of the market higher. My expectations were bolstered by the ongoing strength in semiconductor stocks in my list of bullish stocks from March 9th (a bullish engulfing moment). While these stocks as a group remain resilient, SMH finally gave in to the war weary market with a drop to a 3-month low. An old market adage claims that when the generals start getting shot (the market’s remaining leaders), a market bottom is at hand. However, with so much growing uncertainty surrounding the market, the beginning of the end of the selloff could be quite protracted. For example, SMH has no firm support until its 200DMA around $342.
")
NVIDIA Corporation (NVDA)
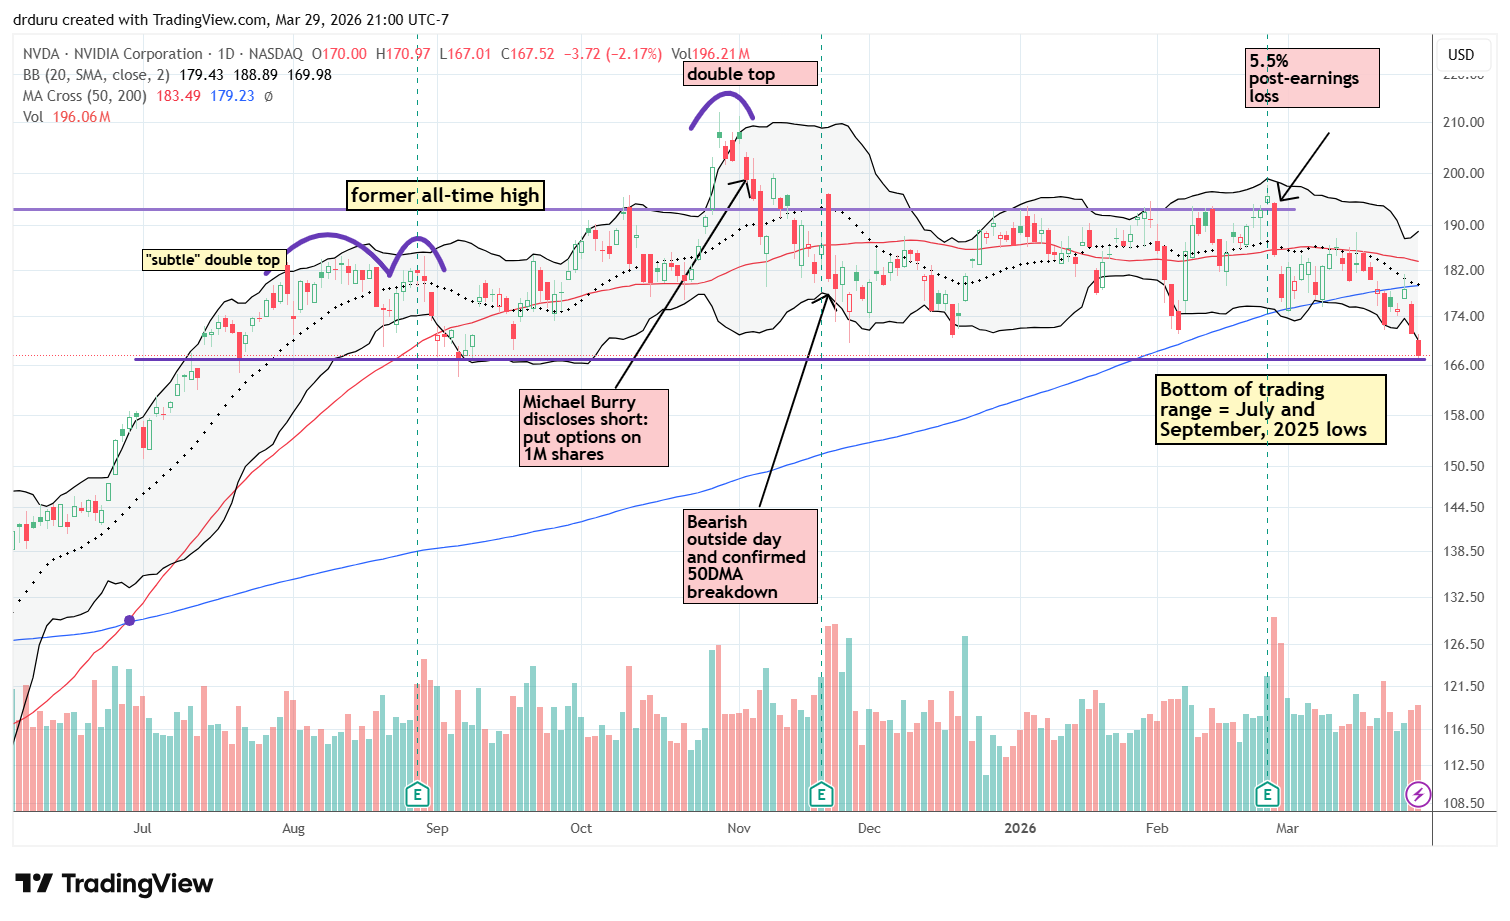
Description: NVIDIA Corporation designs graphics processing units (GPUs) and computing platforms used in gaming, data centers, artificial intelligence, and autonomous systems.
Technical status: NVDA confirmed a 200DMA breakdown and closed the week just above the bottom of a trading range in place since July.
Trade commentary: NVDA is the biggest holding in SMH with a 22.3% allocation. Somehow, its trading range since July did not prevent SMH from trending higher since then. However, NVDA’s 5.5% post-earnings loss started to weigh on SMH. Last week NVDA became one of the biggest generals getting shot. The stock’s confirmed 200DMA breakdown was the straw that broke SMH’s back. NVDA last traded below its 200DMA last May. A breakdown below its months long trading range would mark a deeper bearish profile for the stock market and tech stocks in particular. For now, NVDA is over-extended well below its lower Bollinger Band.
Micron Technology (MU)
Description: Micron is a world leader in innovative memory and storage solutions.
Technical status: Micron Technology Inc (MU) broke down below its 50DMA after a 3.8% post-earnings decline and he creation of a double top.
Trade commentary: The sharp rally in MU was one of several smaller forces helping to lift SMH (MU is SMH’s 6th largest holding with a 4.1% allocation). An abrupt end to the relentless trade in memory stocks contributed to pushing SMH into a breakdown. MU reported blockbuster earnings earlier in the month, but gapped down the next day anyway. The subsequent selling was exacerbated last week by a post from Alphabet discussing a technology that reduces the memory requirements for large language models.
MU is one of the many generals getting shot. War weary investors are eagerly preserving hard won profits. Note the heavy trading volume in MU since the post-earnings pullback.
")
Roundhill Magnificent Seven ETF (MAGS)
Description: The Roundhill Magnificent Seven ETF offers equal-weight exposure to the Magnificent Seven stocks: Alphabet, Amazon, Apple, Meta, Microsoft, Nvidia, and Tesla.
Technical status: The Roundhill Magnificent Seven ETF (MAGS) accelerated to the downside last week capping a year-long decline and a near 9-month low.
Trade commentary: It is bad enough that the generals are getting shot. The Magnificent Seven stocks – Alphabet, Amazon (AMZN), Apple (AAPL), Meta Platforms (META), Microsoft (MSFT), Nvidia, and Tesla (TSLA) – peaked in October of last year. These stocks have trended down as a group ever since. The selling accelerated into the end of the week. The resulting 5.0% weekly loss is the biggest yet of this downtrend. While MAGS looks over-extended with a gap down at the open below the lower Bollinger Band, a war weary market may continue selling upticks in MAGS. Those who failed to take profits earlier in this downtrend could be in a rush to preserve what remains.
")
Meta Platforms (META)
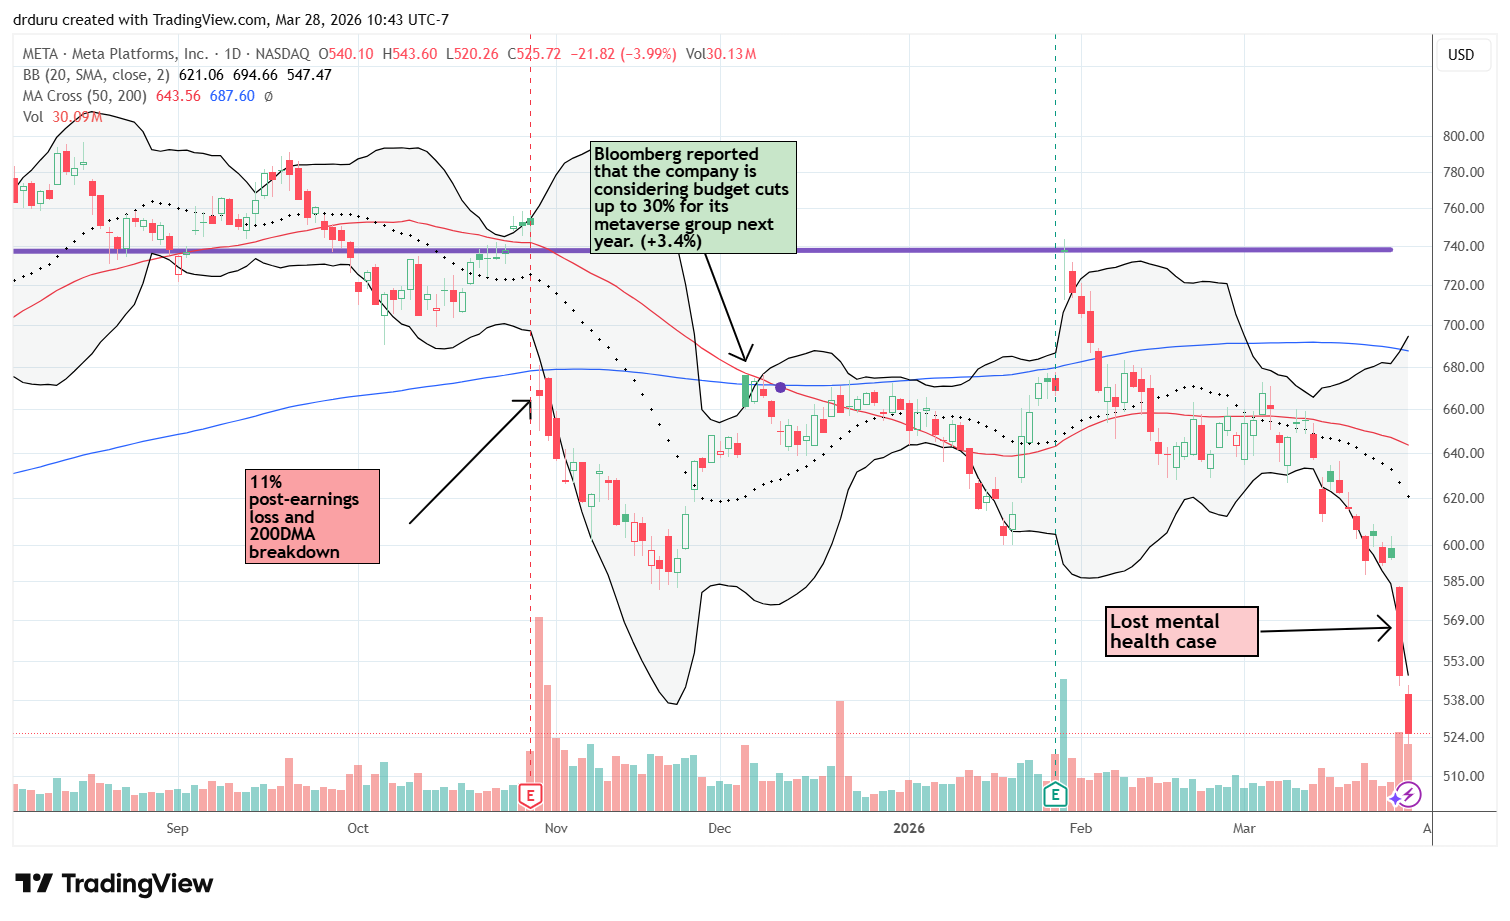
Description: Meta reports financial results in two segments: Family of Apps, which includes Facebook, Instagram, Messenger, WhatsApp, and other services, and Reality Labs, which includes virtual and augmented reality-related consumer hardware, software, and content.
Technical status: Meta Platforms (META) plunged sharply and fell below its lower Bollinger Band. The stock approached its April, 2025 lows.
Trade commentary: META printed a tricky top. I never dared to short the stock even as I kept pointing out the various topping signs. The first telling sign was a top two months ahead of the NASDAQ’s top. The last telling sign came after the stock immediately faded from a 10.4% post-earnings surge. That fade quickly turned into a 200DMA breakdown. Last week’s loss in the courts in a social media addiction trial sealed the deal. META lost 8.0% the day after news and sellers kept up the pressure with another 4.0% drop on Friday. META’s plunge was a major force in the accelerated selling for MAGS. The stock is now even more over-extended than the ETF. If not for the legal setback, META would be at the top of my buy list. The stock is now approaching its April low of $484.
Alphabet (GOOG)
Description: Alphabet is a collection of businesses, the largest of which is Google.
Technical status: Alphabet Inc (GOOG) failed at 20DMA resistance and traded close to its 200DMA after an accelerated decline below its lower Bollinger Band.
Trade commentary: For months, I have been itching to get back into Google. The pullback is finally here. Assuming Alphabet is not nearly as liable as Meta, I went ahead and nibbled on some shares as “close enough” to 200DMA support. In the short-term, the stock is extremely over-extended with the four last trading days closing at or well below its lower Bollinger Band. Moreover, Friday’s close took GOOG right back to its price right before October earnings. If GOOG crashes through 200DMA support, I may sit on my hands for a while. For example, a 200DMA breakdown could precede a fill of the gap from September’s 9.0% surge on a “less bad than expected” anti-trust ruling.
")
iShares Expanded Tech-Software Sector ETF (IGV)
Description: The iShares Expanded Tech-Software Sector ETF seeks to track the investment results of an index composed of North American equities in the software industry and select North American interactive media and services companies.
Technical status: The iShares Expanded Tech-Software Sector ETF (IGV) tested its previous 18-month low and traded below its lower Bollinger Band.
Trade commentary: I nibbled on IGV because it tested the previous low from February. The February low set an 18-month closing low just below the April, 2025 intraday low. Downside risks remains, but I do not want to miss the next rebound from or through this area. Like so much of tech and the general market, IGV closed the week over-extended to the downside below its lower Bollinger Band.
")
Amplify Cybersecurity ETF (HACK)
Description: HACK is the first cybersecurity ETF and provides a way to invest in companies within the cybersecurity industry.
Technical status: Amplify Cybersecurity ETF (HACK) broke down below its 50DMA and then quickly fell, posting a 4.1% drop.
Trade commentary: I thought cybersecurity stocks would be more resilient in the face of the AI panic. However, HACK topped out last year with the rest of tech. AI-driven news last week added pressure. This time Anthropic did not need to distribute a press release. The panic followed reports of a new model with powerful cybersecurity features. Since I am already buying IGV, I did not add HACK to the list. However, if the ETF falls toward the April lows, around $65, I will get more interested.
")
SoFi Technologies (SOFI)
Description: SoFi Technologies is a financial technology company and online bank that provides lending, financial services, and technology platform products.
Technical status: SoFi Technologies Inc (SOFI) kept selling off through March, setting a near 10-month low with a close well below its lower Bollinger Band.
Trade commentary: SOFI is an example of how little the market cares about good news right now. The CEO bought shares twice – once in early March and again in mid-March – for a total of about $1.5 million. Yet, the market barely reacted. I bought SOFI after the second insider purchase, but I soon stopped out. I would rather preserve capital for better opportunities when the oversold rebound finally arrives.
")
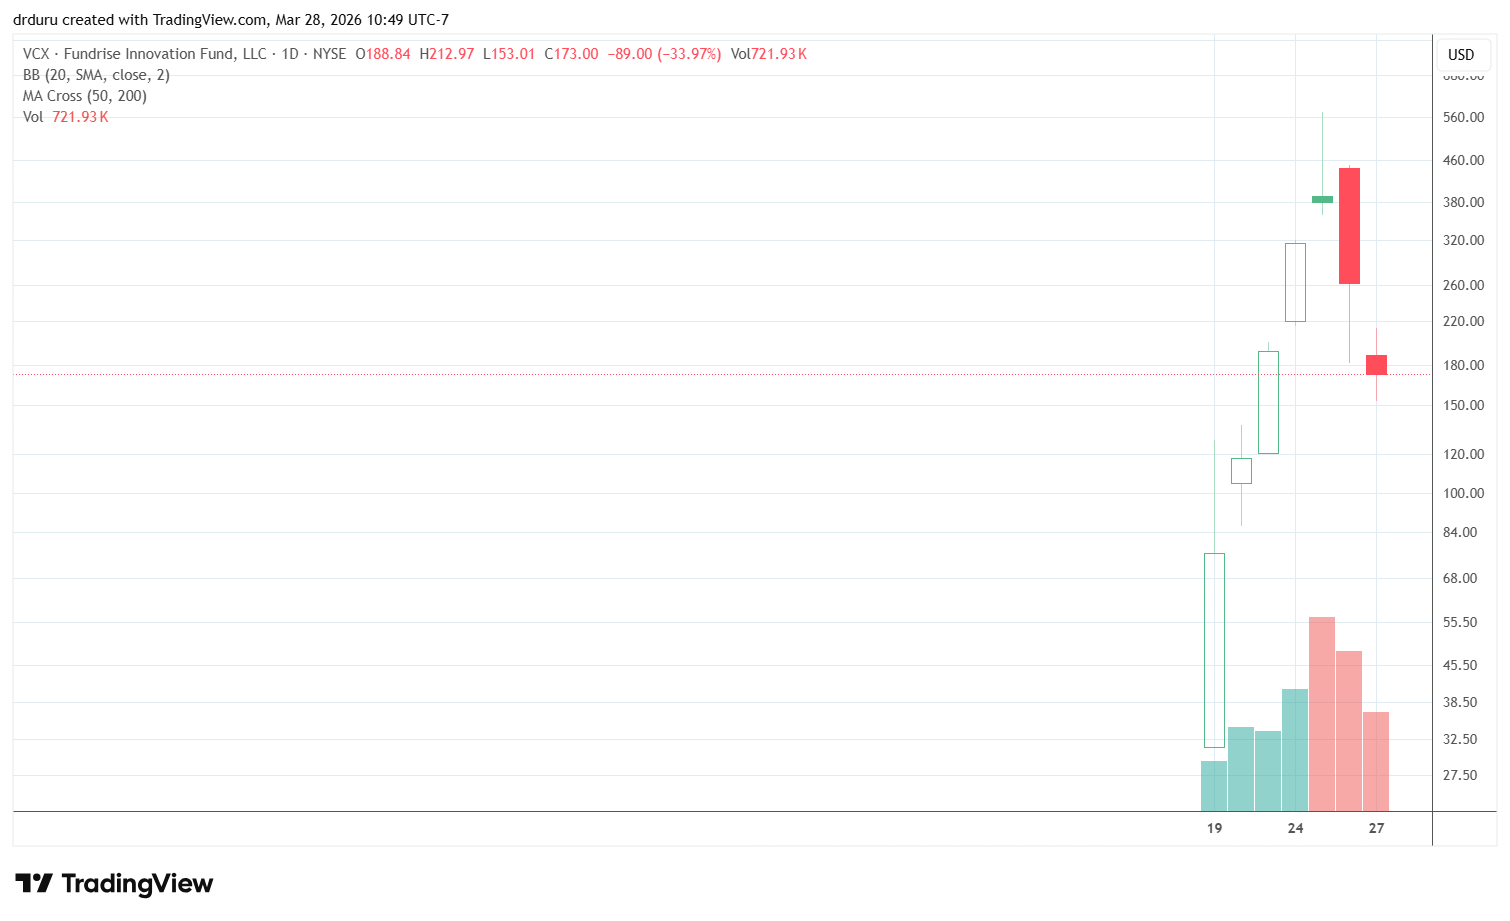
Fundrise Innovation Fund (VCX)
Description: The Fundrise Innovation Fund is designed to deliver long-term growth from a diversified portfolio of technology companies and focuses on potentially high-growth private technology businesses.
Technical status: Fundrise Innovation Fund (VCX) went parabolic, then broke violently lower. The reversal confirmed an end to the run-up.
Trade commentary: VCX is a textbook lesson in the dangers of parabolic moves. You never know exactly when the frenzy will end, but you can expect a painful sell-off after the run-up exhausts buyers. VCX exploded higher in just a few days and topped out with a sharp reversal. I do not know where fair value lies for VCX. Still, I highly doubt it is anywhere near the peak prices. Anthropic and Data Bricks are the fund’s top two holdings and are prime drivers of the frenzy. I would love to own either one but not a current prices.
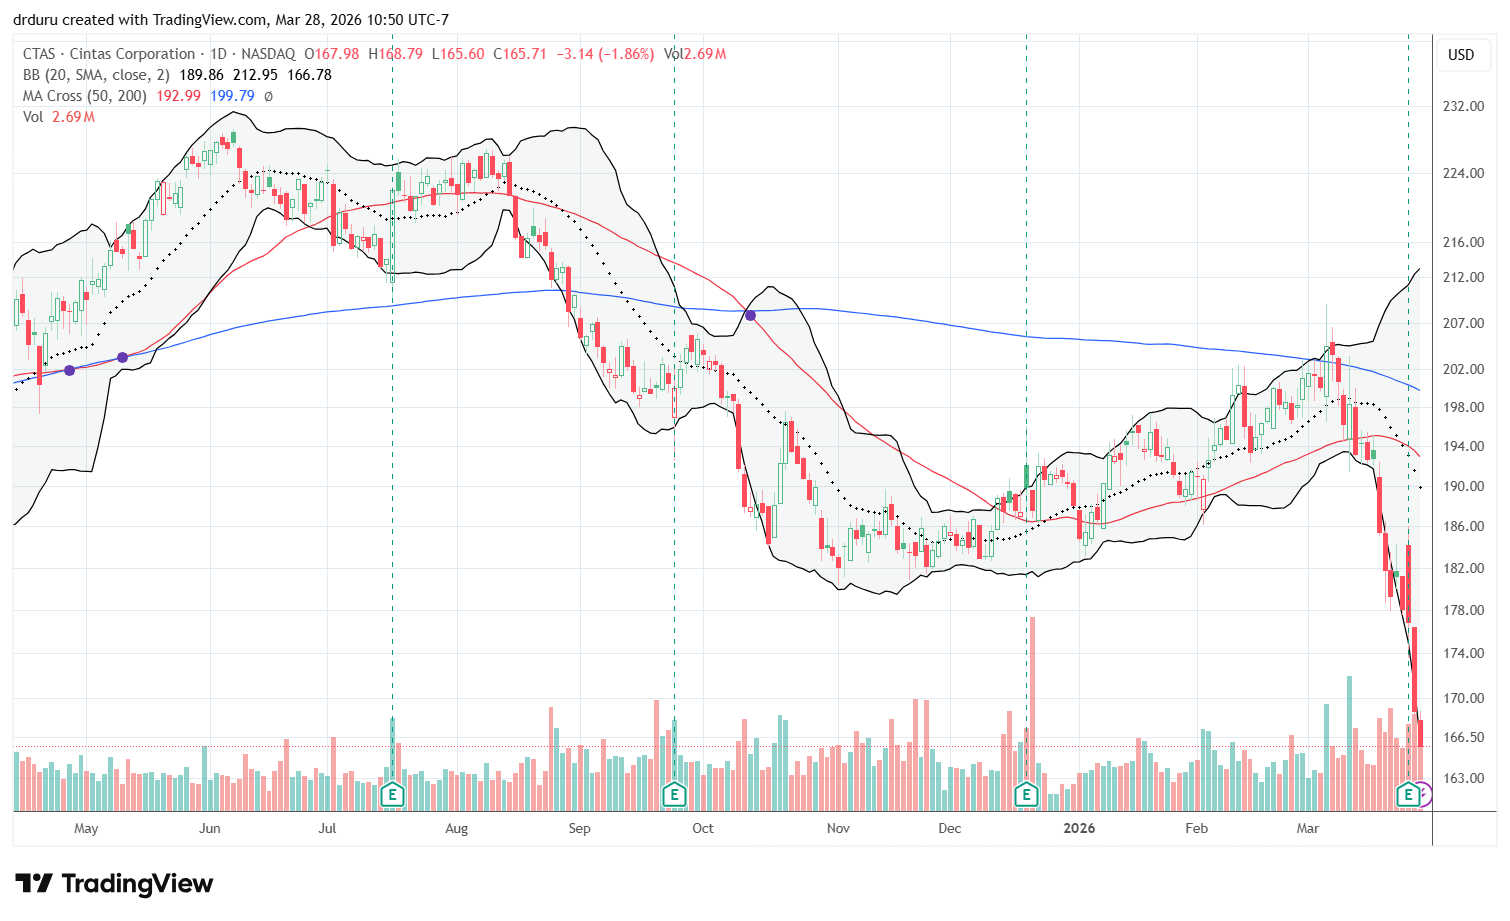
Cintas Corporation (CTAS)
Description: Cintas provides corporate identity uniforms and related business services.
Technical status: Cintas Corporation (CTAS) peaked at the end of 2024, failed at its all-time high, formed a double top, and then sold off back toward May 2024 levels after a strong post-earnings fade.
Trade commentary: CTAS is telling a warning story about the economy and especially the labor market. CTAS has been a fantastic long-term stock, but the stock topped out in November, 2024. The $180 level held as support until last week’s earnings reaction sent the stock to a near 2-year low. When a historically strong stock rolls over, I take notice….and get concerned. Still, the company’s CEO is not concerned per this quote from the Seeking Alpha transcript of the earnings conference call:
“…our customer base is quite resilient. So if anything, our — growth from our current customers has slightly improved. Wearer levels are — we see the jobs reports, but are meaning that they’re not as robust as what we would like. But nevertheless, our customers are still quite resilient and hanging on to their people. And we just see an amazing opportunity to sell other items, cross-sell other items into those — into that customer base, but things are pretty steady.”
Red Robin Gourmet Burgers (RRGB)
Description: Red Robin Gourmet Burgers is a casual dining restaurant chain founded in 1969 that operates through its wholly owned subsidiary, Red Robin International, Inc.
Technical status: Red Robin Gourmet Burgers Inc (RRGB) stayed in a long post-pandemic downtrend and moved back toward its all-time lows after a 33.0% post-earnings fake-out.
Trade commentary: I gave up on RRGB a little over two years ago. The stock has swung wildly since then, both higher and much lower than the $7.50 or so where I gave up. A high short interest has made the stock prone to sharp rallies and gut-wrenching collapses. This latest trip to sub-$3 prices provides an ample reminder of the importance of recognizing an investment thesis gone wrong.
")
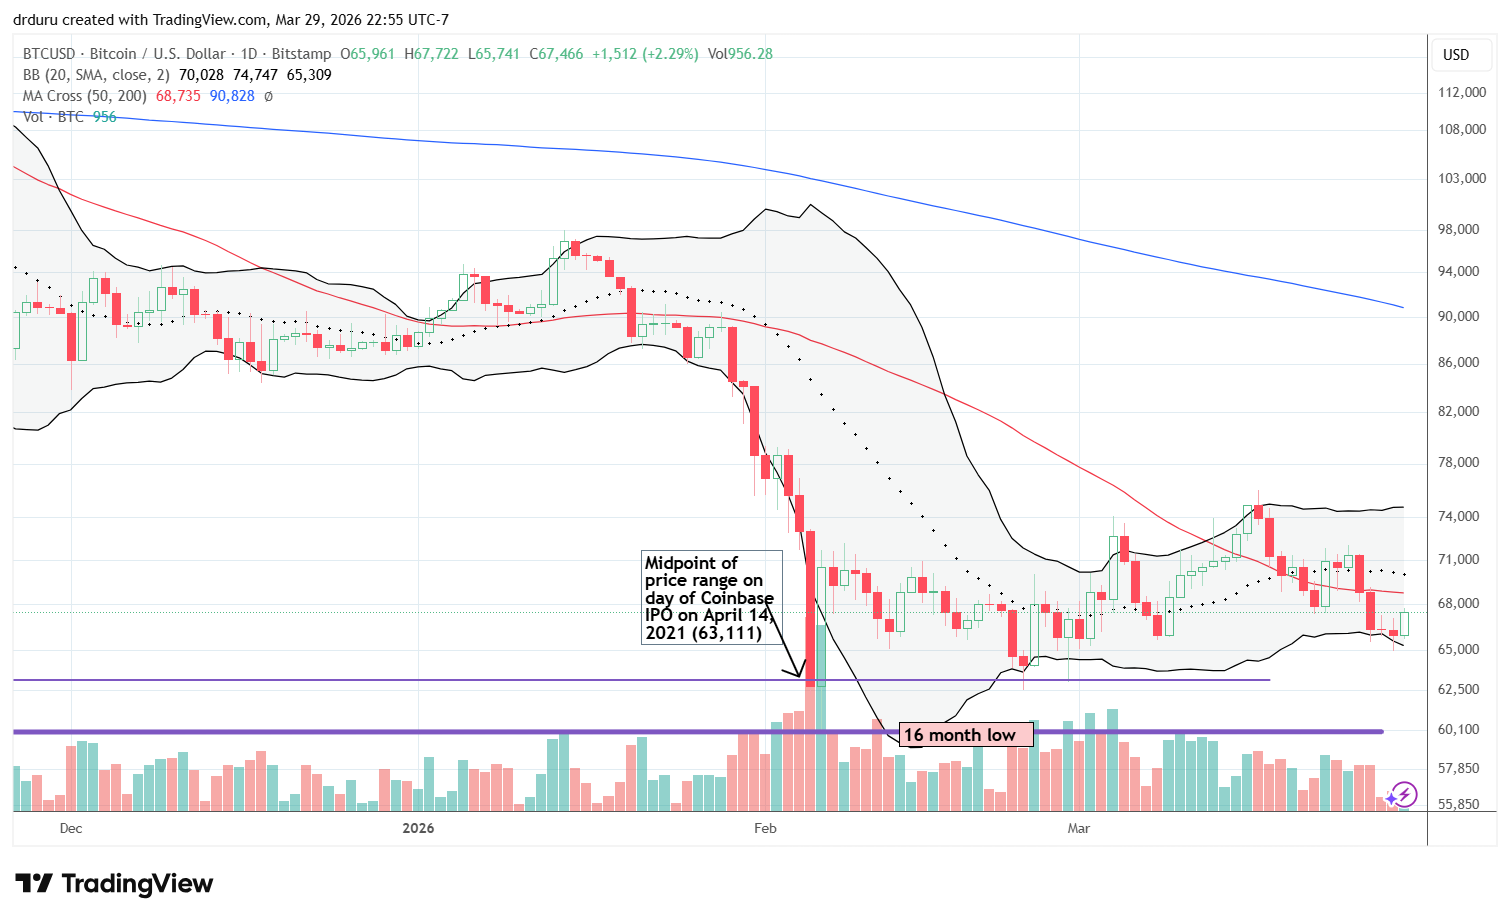
Bitcoin (BTC/USD)
Technical status: The Bitcoin (BTC/USD) bottom is threatened by a fresh 50DMA breakdown.
Trading Commentary: Bitcoin is once again struggling to hold the bottom that conveniently coincided with its price from the Coinbase (COIN) IPO. Based on the January 50DMA breakdown, this latest 50DMA breakdown worries me. At the time of writing, Bitcoin is clinging to support from the prior low. I will interpret a bounce from here combined with a 50DMA breakout as a signal for a more sustained bottom.
Be careful out there!
Footnotes
Subscribe for free to get email notifications of future posts!
“Above the 50” (AT50) uses the percentage of stocks trading above their respective 50-day moving averages (DMAs) to measure breadth in the stock market. Breadth defines the distribution of participation in a rally or sell-off. As a result, AT50 identifies extremes in market sentiment that are likely to reverse. Above the 50 is my alternative name for “MMFI” which is a symbol TradingView.com and other chart vendors use for this breadth indicator. Learn more about AT50 on my Market Breadth Resource Page. AT200, or MMTH, measures the percentage of stocks trading above their respective 200DMAs.
Active AT50 (MMFI) periods: Day #175 over 20% (overperiod), Day #8 under 30% (underperiod), Day #11 under 40%, Day #14 under 50%, Day #22 under 60%, Day #148 under 70%
Source for charts unless otherwise noted: TradingView.com
Full disclosure: long IWM shares, long SPUU, long GOOG, long IGV, long TLT, long USO puts, long SMH, long MSFT, long TSLQ, long MAGS, long BTC/USD
FOLLOW Dr. Duru’s commentary on financial markets via StockTwits, BlueSky, and even Instagram!
*Charting notes: Stock prices are not adjusted for dividends. Candlestick charts use hollow bodies: open candles indicate a close higher than the open, filled candles indicate an open higher than the close.
* Blog notes: this blog was partially written based on the heavily edited transcript of the following video that includes a live review of the stock charts featured in this post. I used ChatGPT to process the transcript.