Stock Market Commentary
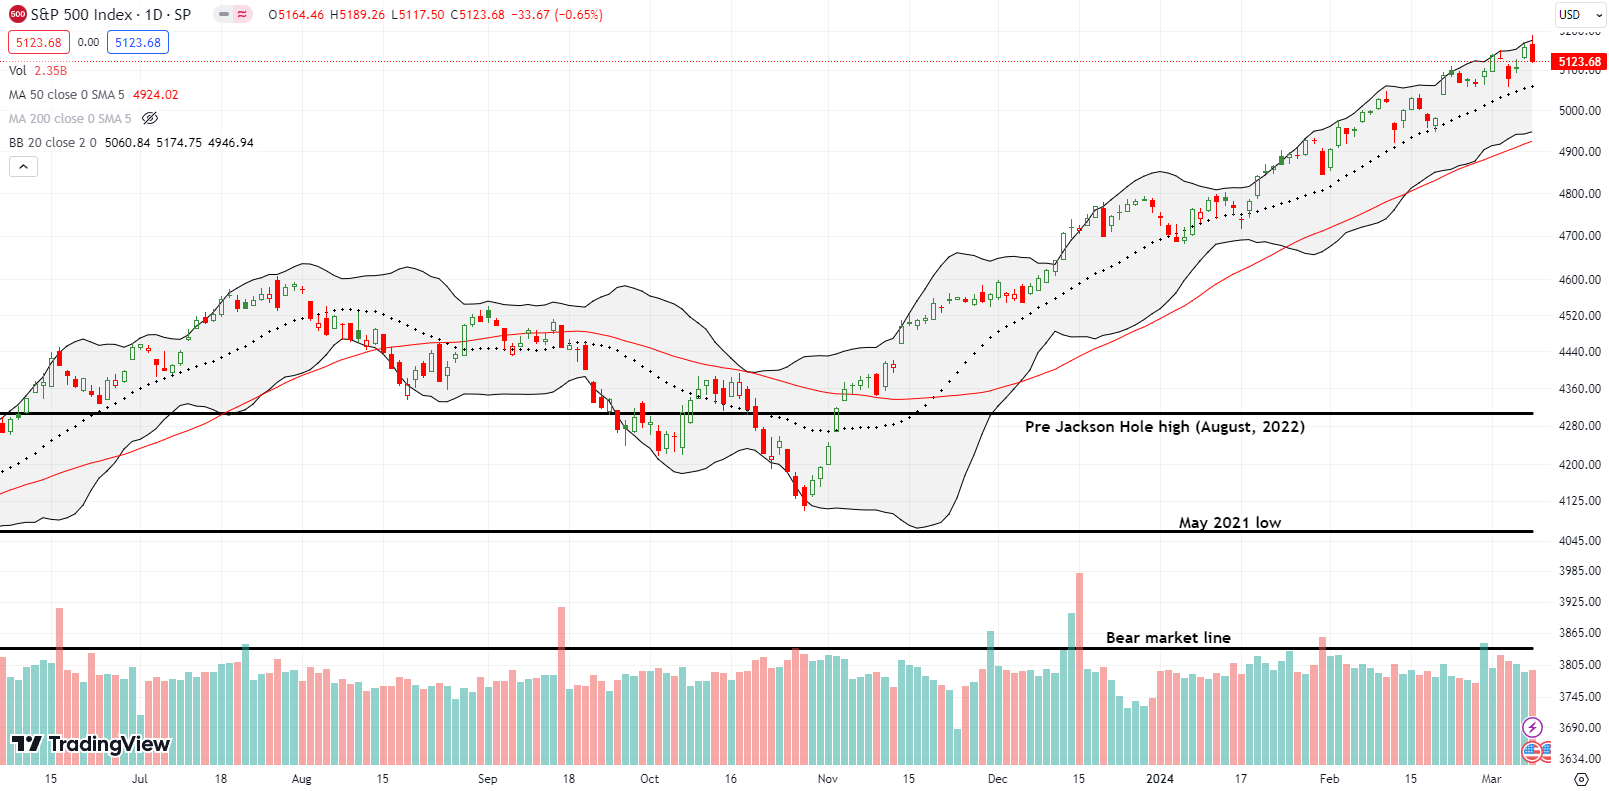
Is another tease for the bears underway? The current bullish rally has included so many temporary bearish signals that I had to stop using baseball metaphors to call strikes. Now, the latest bearish signal looks like the most ominous yet. In the wake of February’s job report, price action delivered a wicked reversal from all-time highs especially for tech stocks and most intensely for semiconductor stocks. When preceded by an uptrend, a bearish engulfing pattern creates a topping pattern as the last motivated buyers rush into a stock, push it to a new intraday (all-time) high, and finally leave a vacuum of buying. The path of least resistance next points downward. After sellers fill the vacuum, the stock or index closes below the previous day’s low. The charts below provide classic examples of this infamous topping pattern.
If bulls recharge and invalidate this signal just as resolutely as they have done most others since December, this episode will turn into just one more tease for the bears. History favors the bulls as March is one of the year’s mildest months for drawdowns. Last year’s March meltdown from the regional banking crisis stood out as a historic extreme.
The Stock Market Indices
The S&P 500 (SPY) lost 0.7% on the day after being up as much as 0.6%. While these read like small numbers, especially relative to a massive 4+ month rally, the end result is still a bearish engulfing topping pattern. This topping pattern is made a little more ominous given the reversal from all-time highs. This latest invite for the bears looks like another tease for the bears given the persistent uptrend and the quick invalidation of past bearish setups. Incredibly, the S&P 500 has only closed below its uptrending 20-day moving average (DMA) (the dotted line below) a total of THREE days since the October breakout. This streak is truly awesome to behold.
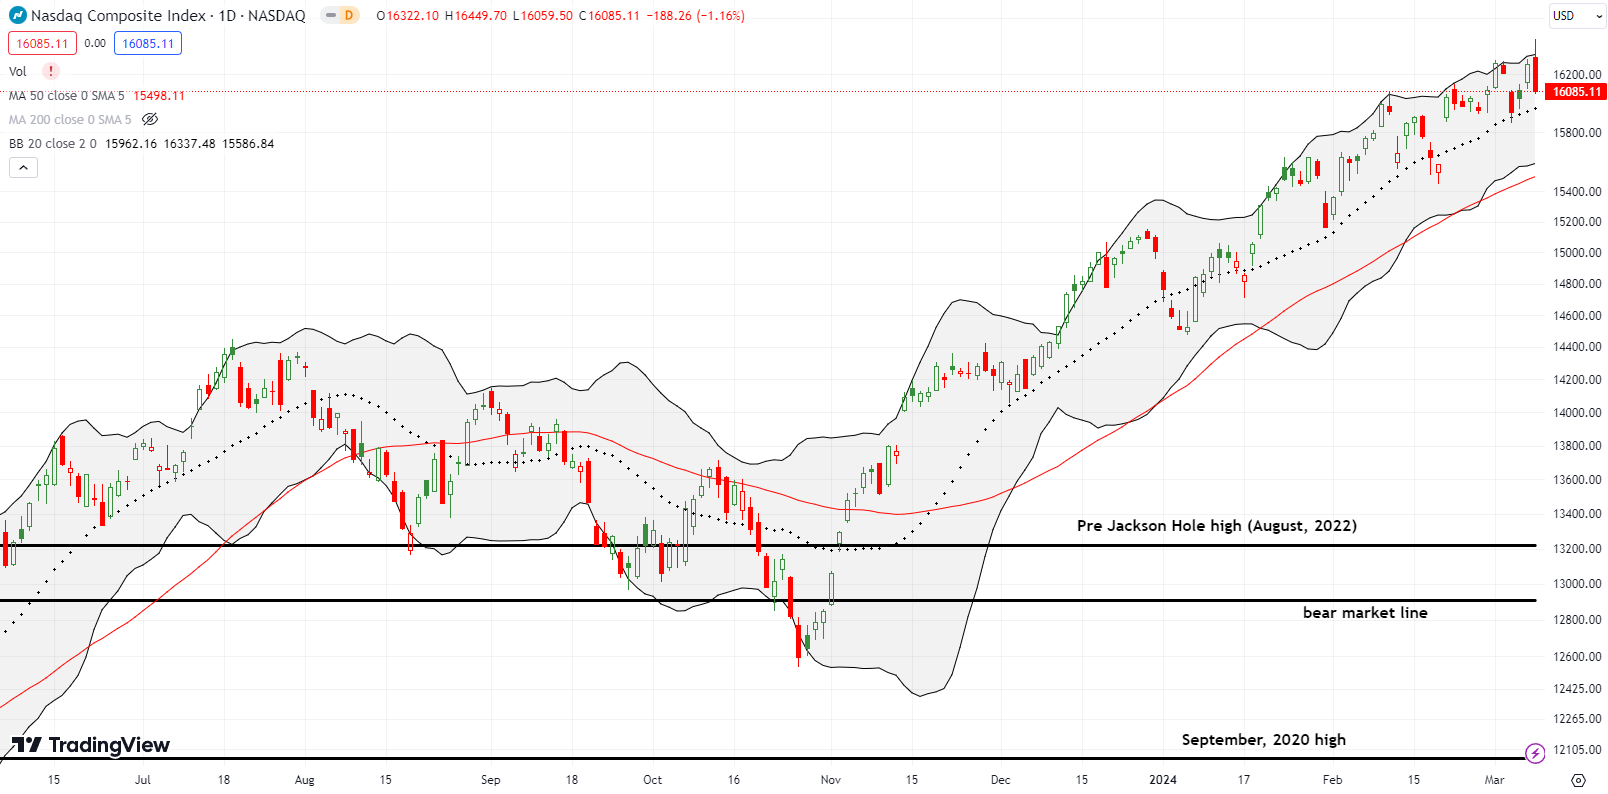
The NASDAQ (COMPQ) printed a much more convincing bearish engulfing topping pattern than the S&P 500 did. The tech-laden index lost 1.2% after being up as much as 1.1%. For an additional tease, the NASDAQ closed right on top of the shooting star topping pattern from a month ago that preceded one of the few bearish wins, albeit shallow and brief. I decided to lean against the bears here and buy a QQQ call spread to play an eventual rebound away from the 20DMA and toward the upper Bollinger Band (BB). The trade worked earlier in the week, so now I am basically acquiescing to the flow on this one. I discuss major caveats later in this post.
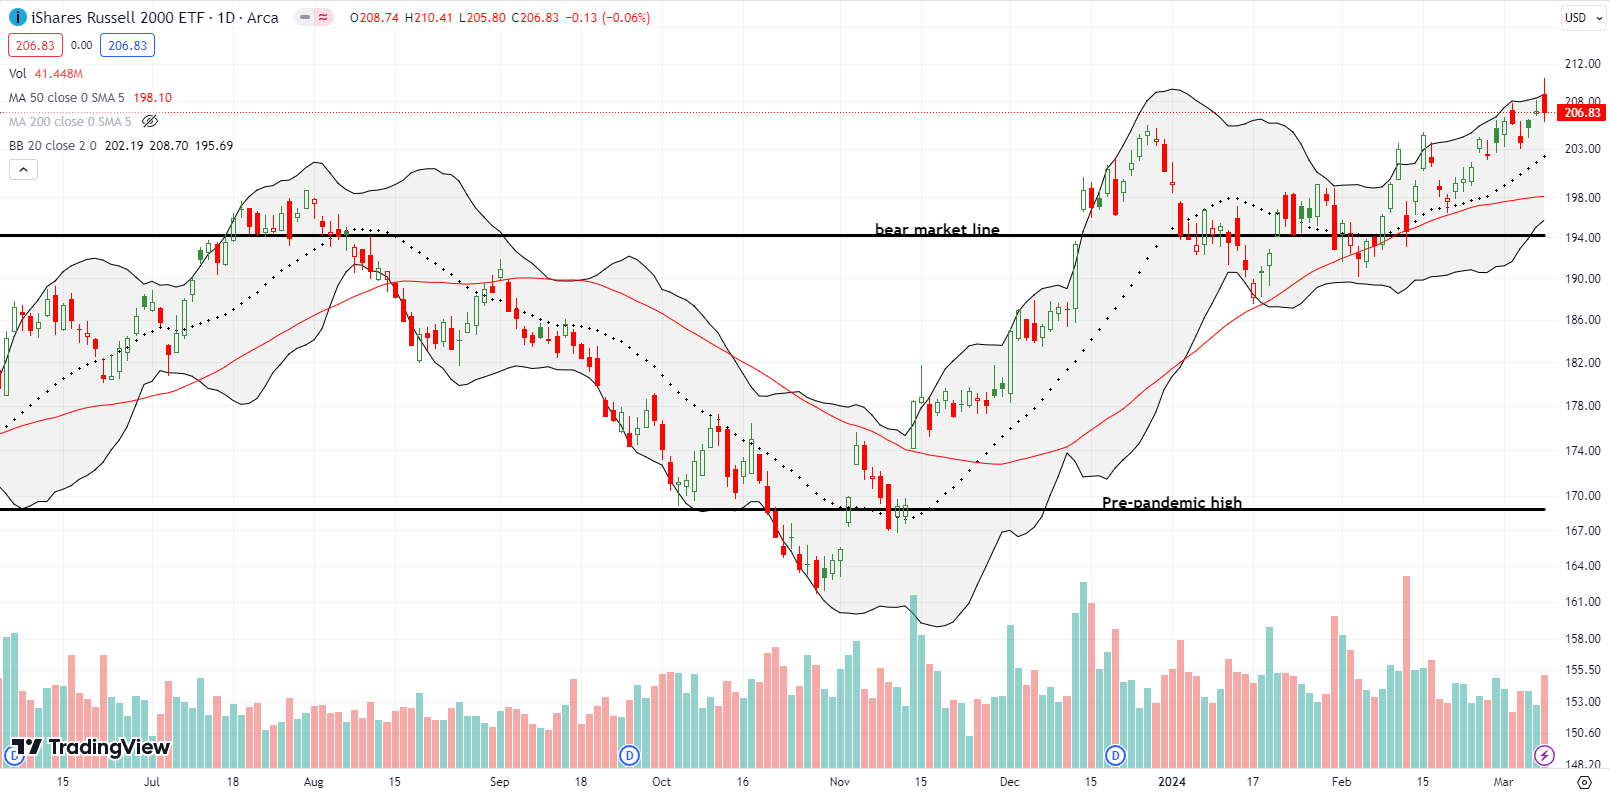
The iShares Russell 2000 ETF (IWM) did not quite tease the bears with a bearish engulfing pattern given it closed essentially flat on the day. Still, it was up as much as 1.7% before reversing sharply. I had the right idea but poor timing as I sold my latest tranche of IWM call options on Thursday at a small loss. Waiting until expiration day with a job report coming up felt too risky. Instead, I rolled into a call spread expiring this coming Friday. If the bears actually follow-through this coming week, I expect IWM to quickly fall back to 20DMA support.
The Short-Term Trading Call With Another Tease for the Bears

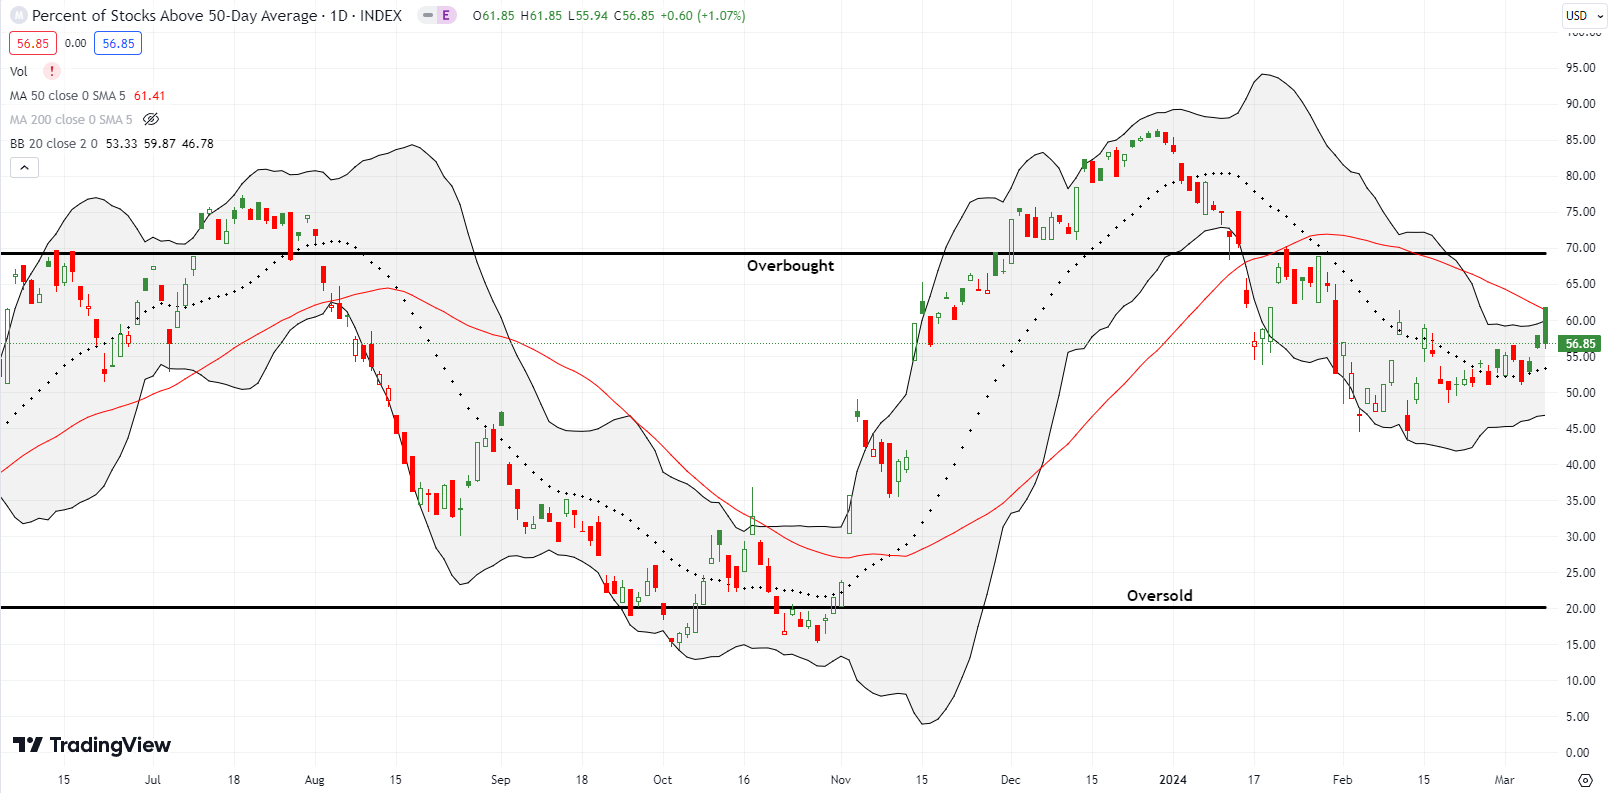
- AT50 (MMFI) = 56.9% of stocks are trading above their respective 50-day moving averages
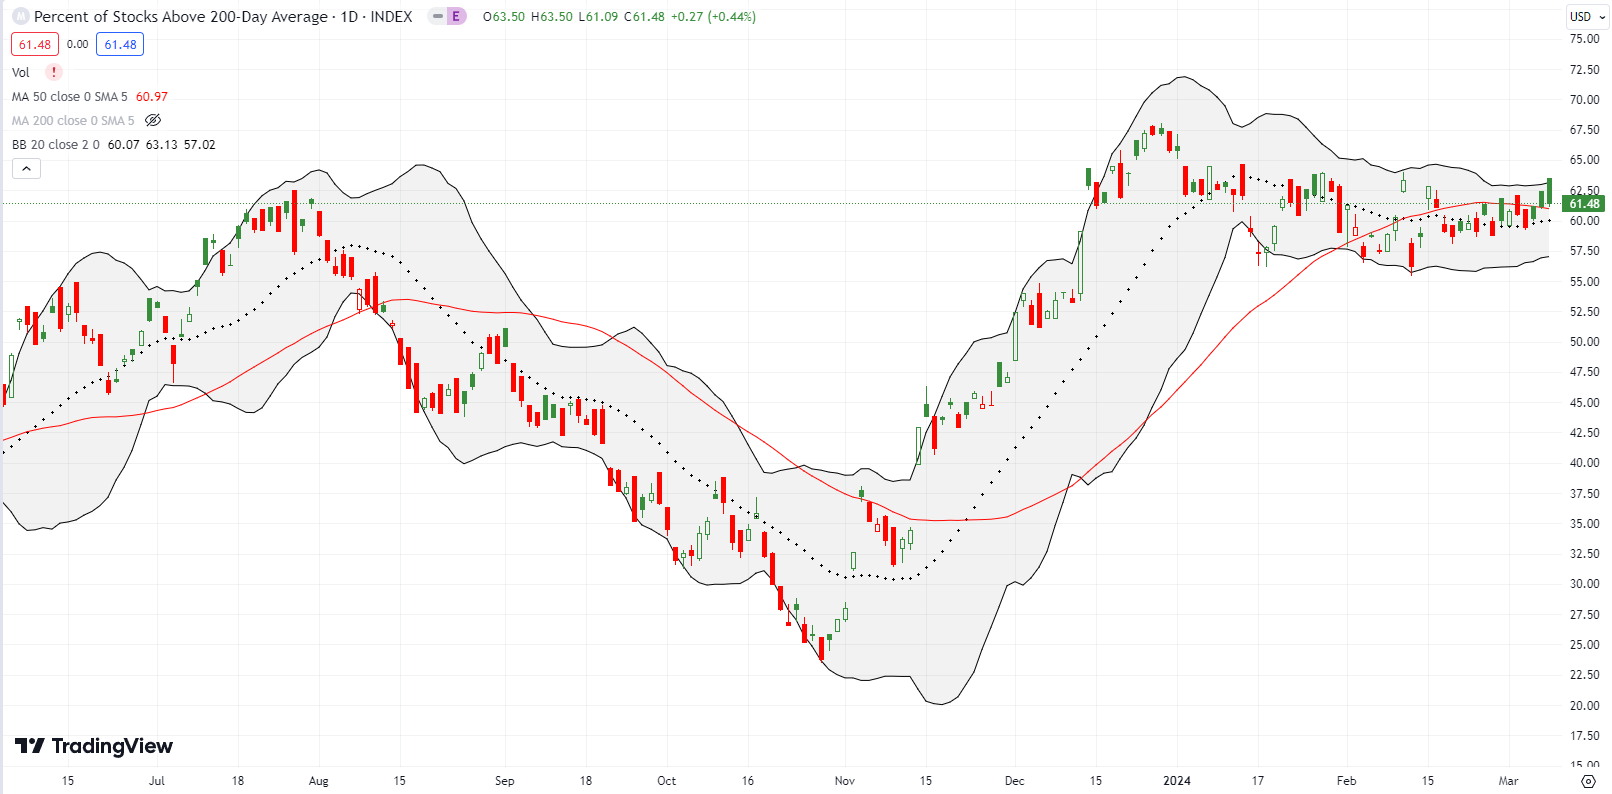
- AT200 (MMTH) = 61.5% of stocks are trading above their respective 200-day moving averages
- Short-term Trading Call: skeptical
AT50 (MMFI), the percentage of stocks trading above their respective 50DMAs, closed at 56.9%. My favorite technical indicator broke out to levels last seen in late January before fading back to a flat close. Absent the latest bearish technicals, the overall trend for AT50 points to a sneaky retest of the overbought threshold at 70%. This latest tension between the bullish and bearish truths in the market made me pivot my trading to little bets on the bullish side (low risk but low potential gain) and what I think are big bets on the bearish side. Given the recent magic of all-time highs, this tease of the bears almost looks like a wash-rinse-repeat cycle!
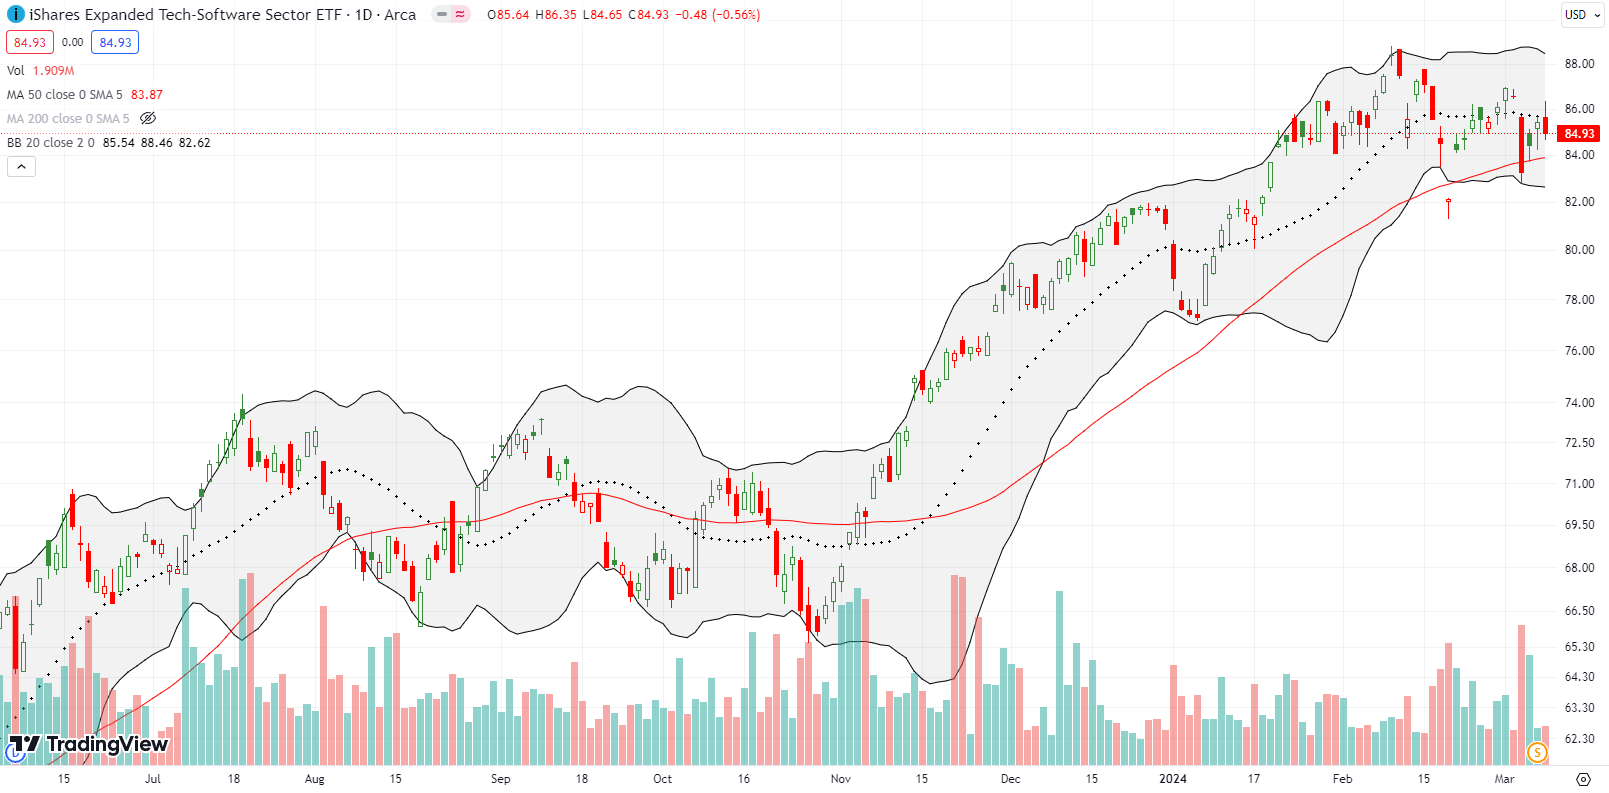
For my big bearish bet, I picked on the iShares Expanded Tech Software Sector ETF (IGV). I shorted shares with a presumed upside risk of about 4.3% on a rally back to the recent high. That high looks suspicious because it both stopped just short of the all-time high and created a widening under-performance with the NASDAQ. To the downside, I am targeting an eventual pullback that retests the lows of 2024, about 8.9% away. The 1:2 risk/reward ratio is not great, but I do not want to try leveraging with options because this bet could take weeks and maybe months to play out.
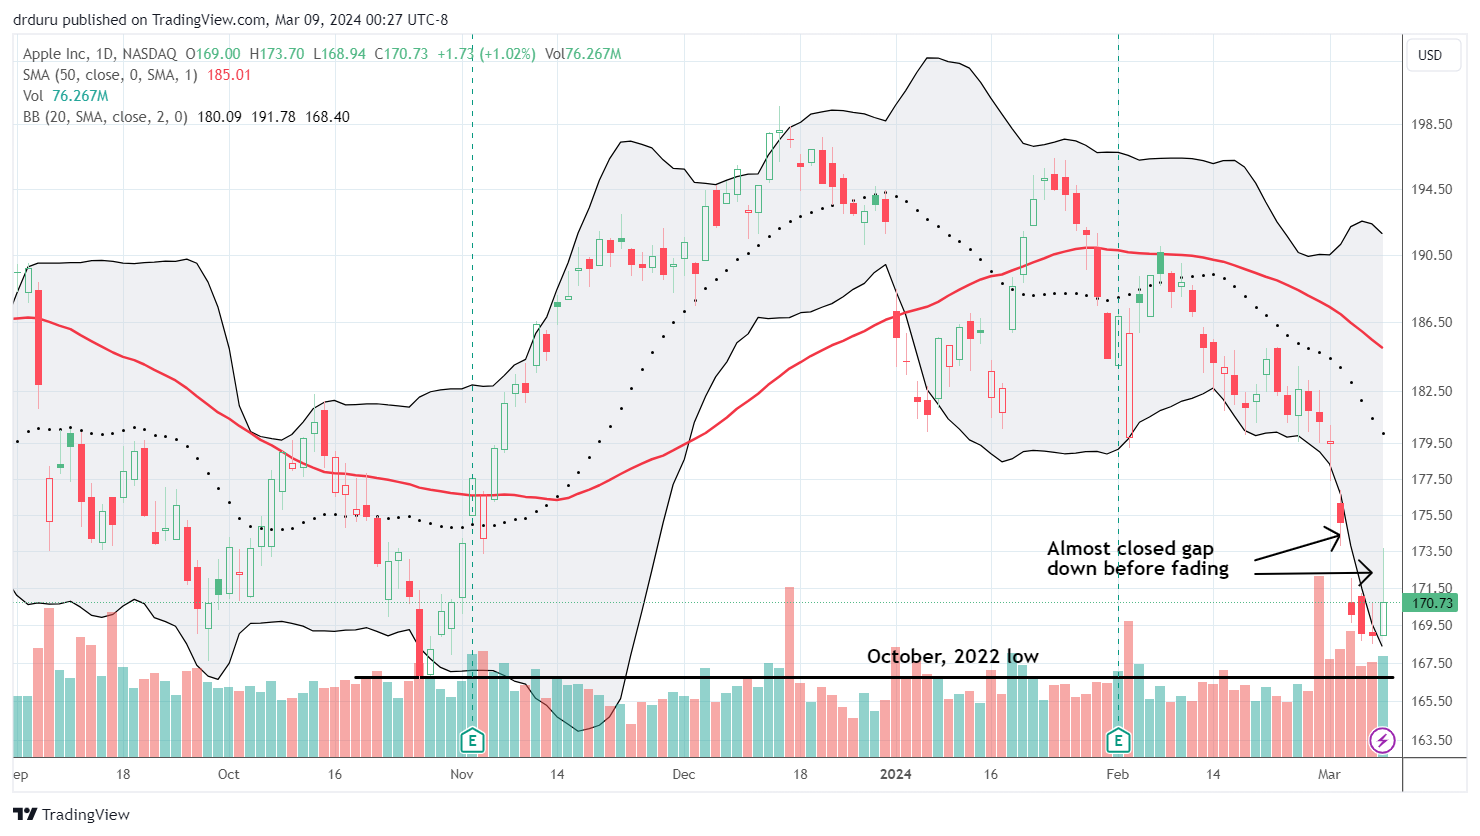
Speaking of under-performance to the NASDAQ, Apple Inc (AAPL) has been downright sickly this year. Normally, I assume AAPL’s weakness is the market’s weakness; not so this year. AAPL is down a surprising 11.3% and last week even came close to testing the October, 2022 lows. This AAPL weakness is a true tease for the bears because AAPL has yet to trigger alarm bells for the rest of the market.
I thought Monday’s gap down and 2.5% loss was an extreme reaction to news of a huge fine by the European Commission over “app store abuses.” After all, in the past, investors have quickly looked through such bad news; presumably passive investors just kept pouring money into AAPL no matter what. Yet, AAPL gapped down again the next day and lost another 2.8%. I made a second bet. By the time AAPL sprung to life on Friday, I had to sell my call options at a loss. In retrospect, I should have started with a calendar call spread, but I was over-confident. I swung one more time on Friday, this time using a calendar call spread.
Note that these trades are not part of the Apple Trading Model (ATM) because the stock is below its 50-day moving average (DMA) (the red line). Instead, I am betting on a relief rally with AAPL fans looking at this return to the October lows as a tasty buying opportunity.
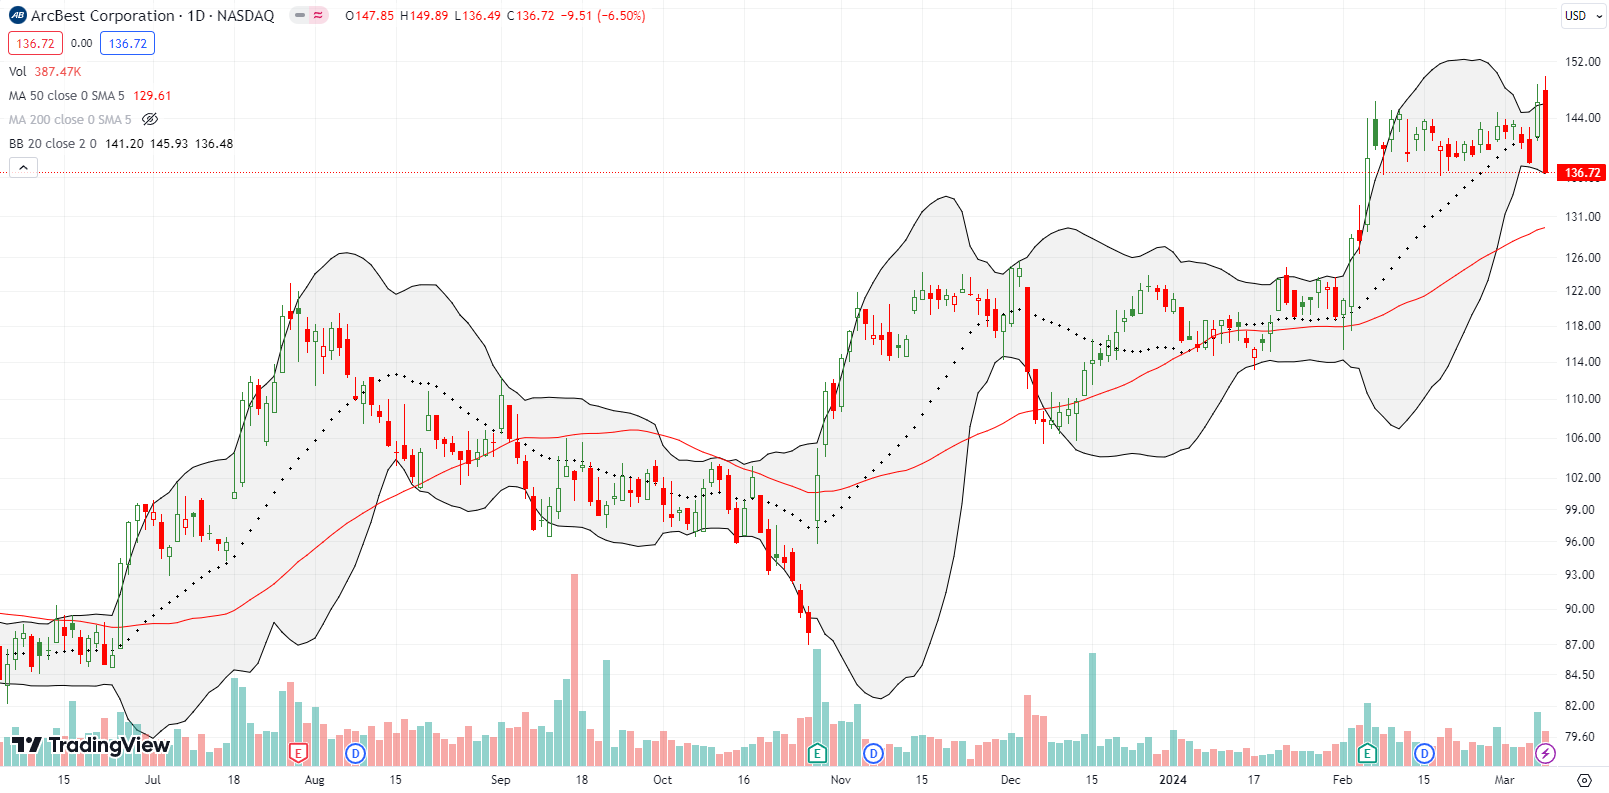
Integrated logistics company ArcBest Corporation (ARCB) delivered one of the more wicked reversals among the stocks I scanned. ARCB did not make the bearish engulfing scan in swingtradebot because the move going into the reversal was not a clear uptrend. Regardless, the swift reversal from a breakout to an all-time high to a close right at the bottom of the recent trading range looks bearish. The 6.5% loss looks even worse given it invalidated a bullish resolution to a Bollinger Band (BB) squeeze. If ARCB survives this bearish flip without going a lot lower first, the tease for the bears will truly be in effect!
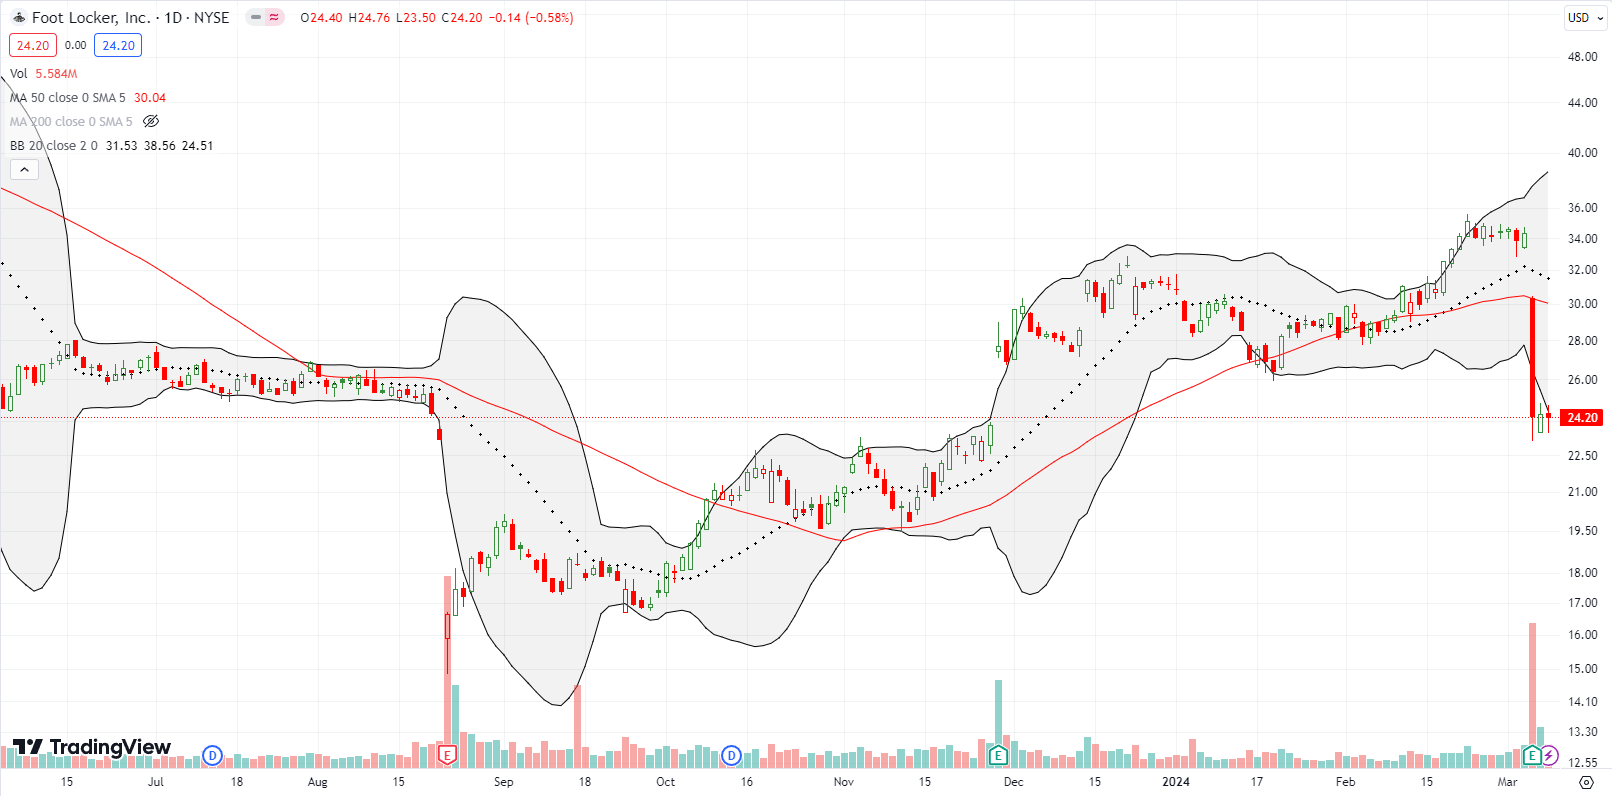
Foot Locker, Inc (FL) delivered one more blow against what looked like a strengthening trend for retail stocks. FL imploded 29.4% post-earnings. The stock gapped down right to its 50DMA and kept falling from there. The bearish breakdown was about as clear and clean as you can get. FL even closed the gap up from its previous earnings report last November (amazing how that happens). I am watching closely. A higher close increases the odds of some kind of relief rally, and a fresh tease for the bears. A lower close resumes the bearish momentum with a lot of room for deeper losses.
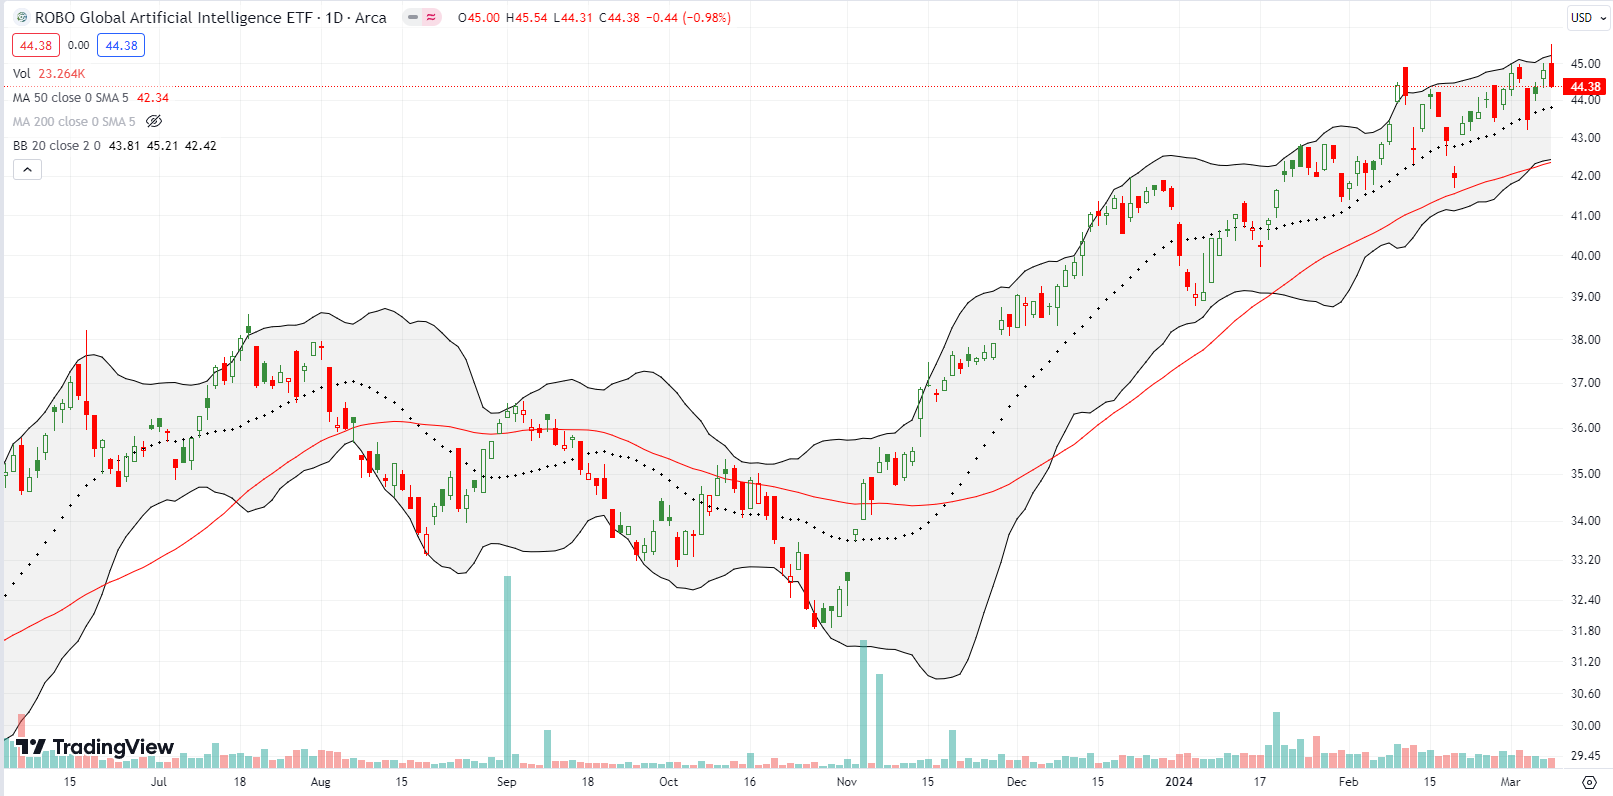
A friend pointed out ROBO Global Artificial Intelligence ETF (THNQ) after we marveled over the ominous bearish implications of NVIDIA’s (NVDA) wicked reversal and bearish engulfing topping pattern. NVDA ranked #2 on the list based on its Friday volume surge. THNQ includes too many consumer names for my liking, but at least it has a profile that offers a less volatile way to participate in the generative AI trade. THNQ is on my list to accumulate over time into a substantial long-term position. In the meantime, THNQ also flashed a bearish engulfing topping pattern after first breaking out to a near 2 1/2 year high.
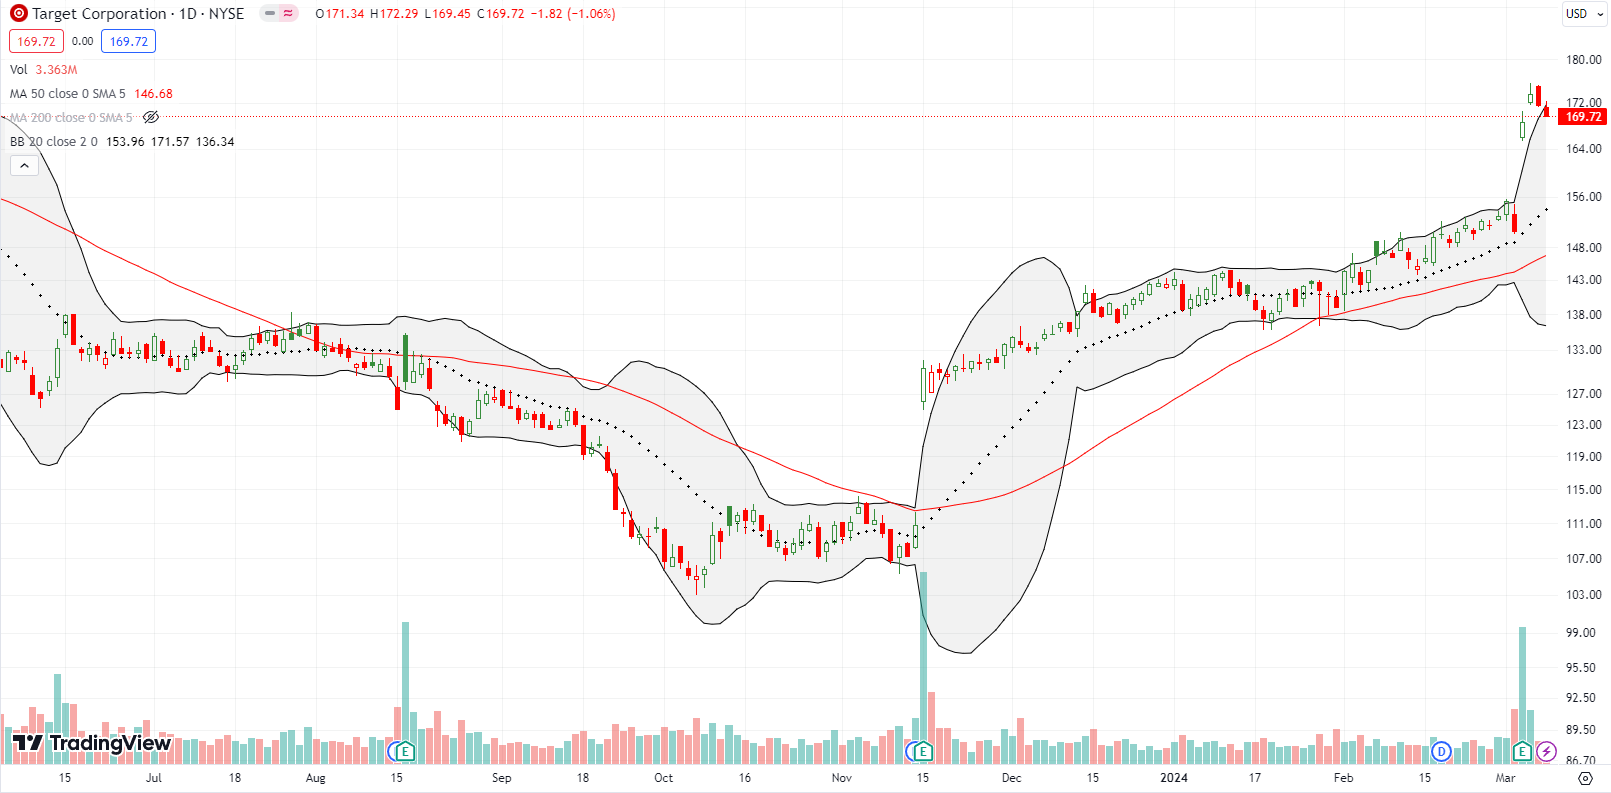
Target Corporation (TGT) held up its end of the retail breakout bargain. The (formerly?) maligned retailer put on a second consecutive post-earnings show with a 12.0% surge. Buyers followed through with one more up day before sellers brough the stock back to and under the upper BB. TGT trades at a 52-week high but remains 100 points below its all-time high.
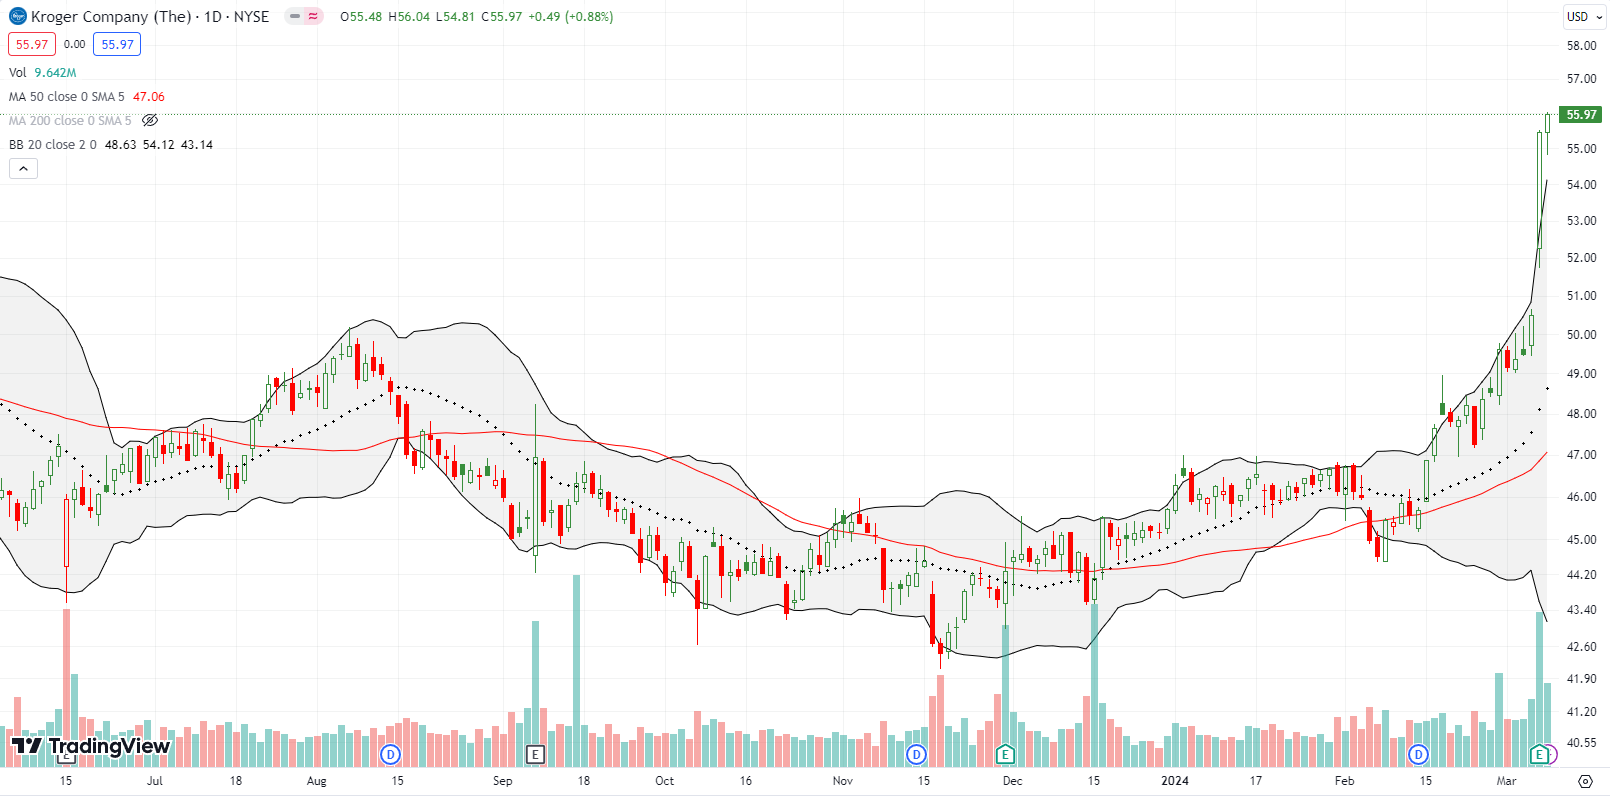
Supermarket chain The Kroger Company (KR) seemed to come out of nowhere with its own post-earnings surge. KR gained 9.9% post-earnings and closed the week at a near 2-year high. The stock spent most of the past two years in a slow developing trading range. I owned KR some time ago for the dividend but sold it for a small profit after impatiently waiting for signs of life. KR has another 13% to gain before reaching its all-time high and now only pays a 2.1% dividend yield.
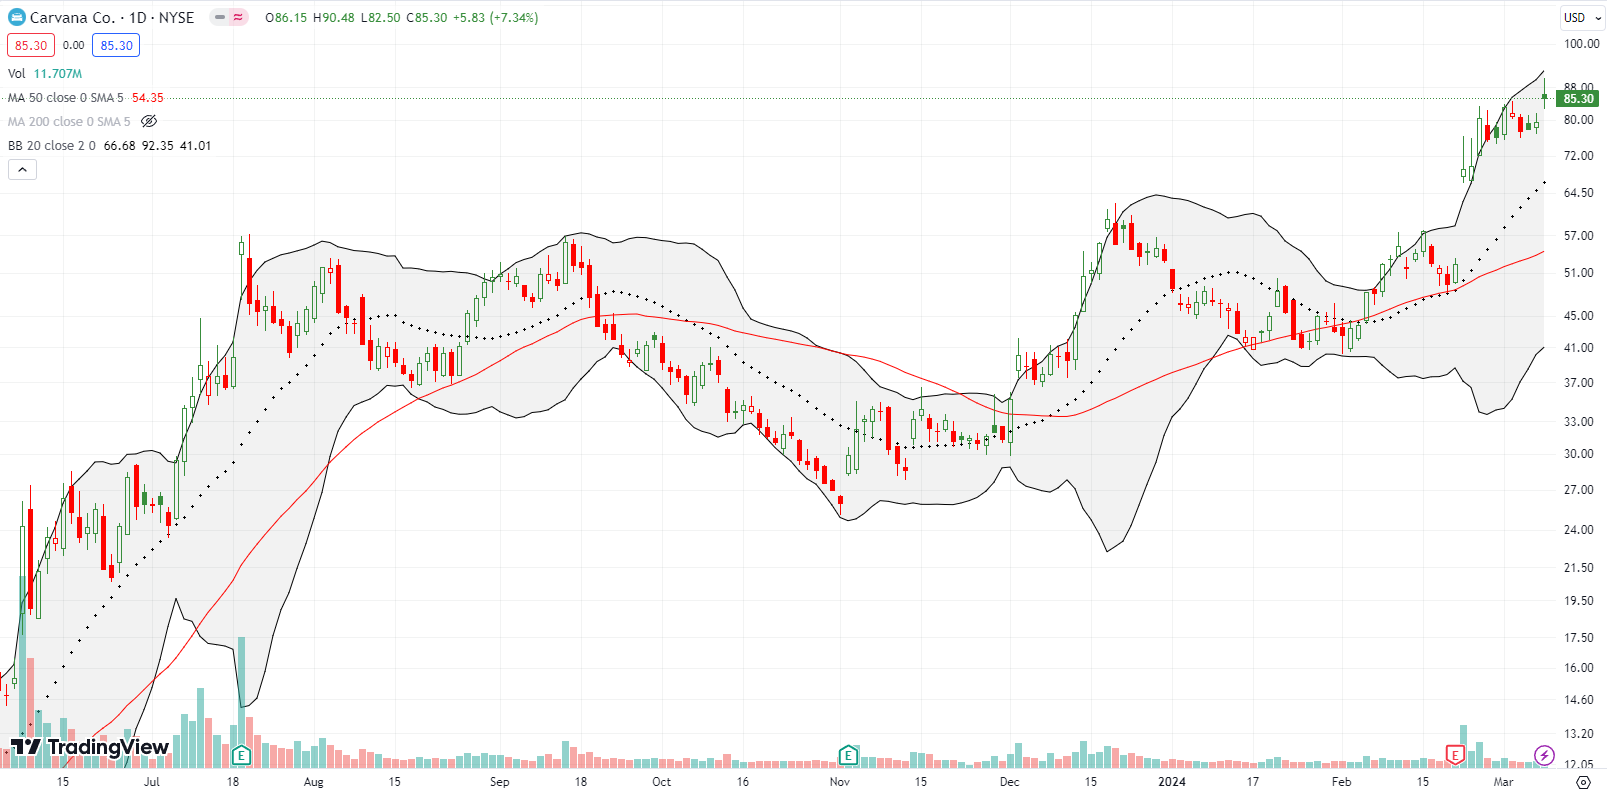
I have been overly skeptical of Caravana Co (CVNA) since it bottomed near $3/share in early 2023. The stock has been a true tease for the bears ever since. I featured CVNA as my top pick for a bearish bet after the previous week’s bearish shooting star. CVNA surged on Friday by 7.3% after an analyst upgrade. The fresh breakout invalidates the previous topping pattern.
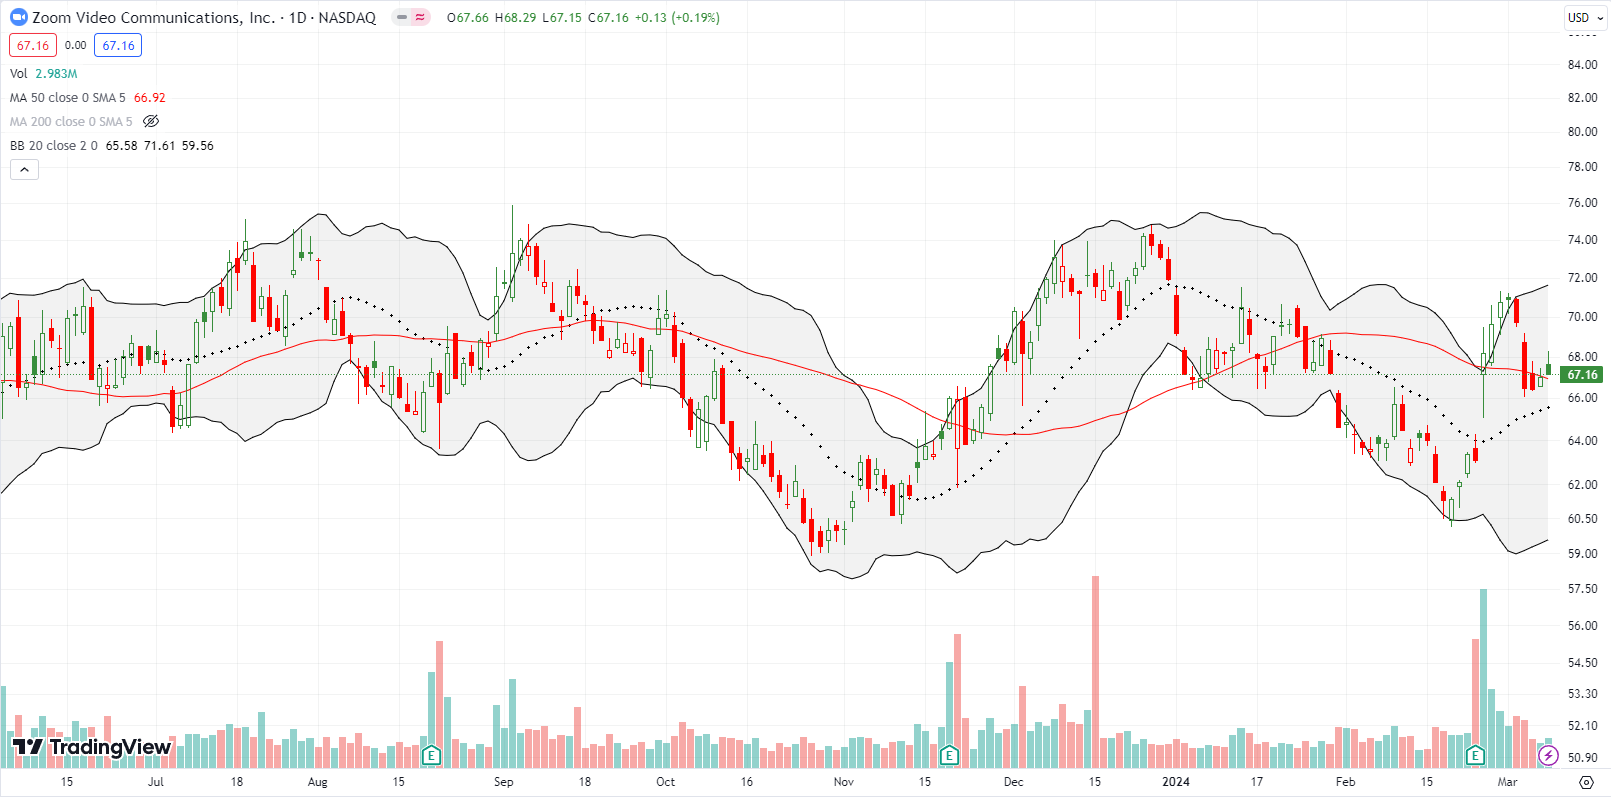
Two weeks ago I asked what’s wrong with Zoom Video Communications, Inc (ZM). ZM soon responded with an 8.0% post-earnings gain and close above 50DMA resistance. Sellers eventually regained control and returned the stock below 50DMA support. With the 20DMA back in an uptrend, I took a speculative shot on Friday on a ZM call option. If the market follows through on another tease for the bears, I will target a ZM breakout to a new post-earnings high.
Be careful out there!
Footnotes
Subscribe for free to get email notifications of future posts!
“Above the 50” (AT50) uses the percentage of stocks trading above their respective 50-day moving averages (DMAs) to measure breadth in the stock market. Breadth defines the distribution of participation in a rally or sell-off. As a result, AT50 identifies extremes in market sentiment that are likely to reverse. Above the 50 is my alternative name for “MMFI” which is a symbol TradingView.com and other chart vendors use for this breadth indicator. Learn more about AT50 on my Market Breadth Resource Page. AT200, or MMTH, measures the percentage of stocks trading above their respective 200DMAs.
Active AT50 (MMFI) periods: Day #73 over 20%, Day #71 over 30%, Day #69 over 40%, Day #17 over 50% (overperiod), Day #29 under 60%, Day #40 under 70%
Source for charts unless otherwise noted: TradingView.com
Full disclosure: long IWM call spread, long QQQ call spread, long AAPL calendar call spread, long CVNA put spread, long ZM call, short IGV
FOLLOW Dr. Duru’s commentary on financial markets via StockTwits, Twitter, and even Instagram!
*Charting notes: Stock prices are not adjusted for dividends. Candlestick charts use hollow bodies: open candles indicate a close higher than the open, filled candles indicate an open higher than the close.


Addendum to this post, a big sell signal for NVDA…and the caveats https://youtu.be/Pa826lZfUxM