Stock Market Commentary
A curious break in the trading action unfolded as financial markets wrestled with two “disappointing” inflation reports. Both the CPI (consumer price index) and wholesale inflation (the producer price index or PPI) came in slightly higher than “expected” (headline and core). The data just tell me expectations are unrealistic or at best imprecise. The antsy anticipation for rate cuts from the Fed feeds into the market’s high expectations. These expectations have fueled a now near 5-month rally. A curious break in inflation’s downtrend forces the bulls to at least take a pause.
Bond yields went higher all week with the inflation reports fueling bond selling. On the other hand, the stock market quickly moved on from Tuesday’s CPI report with a rally to new all-time highs. It looked the regular and eerily programmatic march higher for the major indices. Stocks got in sync with bond market worries as Thursday’s reaction created a small pullback in stocks with more follow-through on Friday. Stickier wholesale inflation is troubling since it suggests a longer runway for sticky consumer inflation. Still, the stock market has shown a consistent habit of getting over inflation setbacks and returning its focus to signs of imminent rate cuts. Thus, the coming week’s Federal Reserve meeting is yet one more telling juncture in the market’s obsession with monetary policy.
The Stock Market Indices
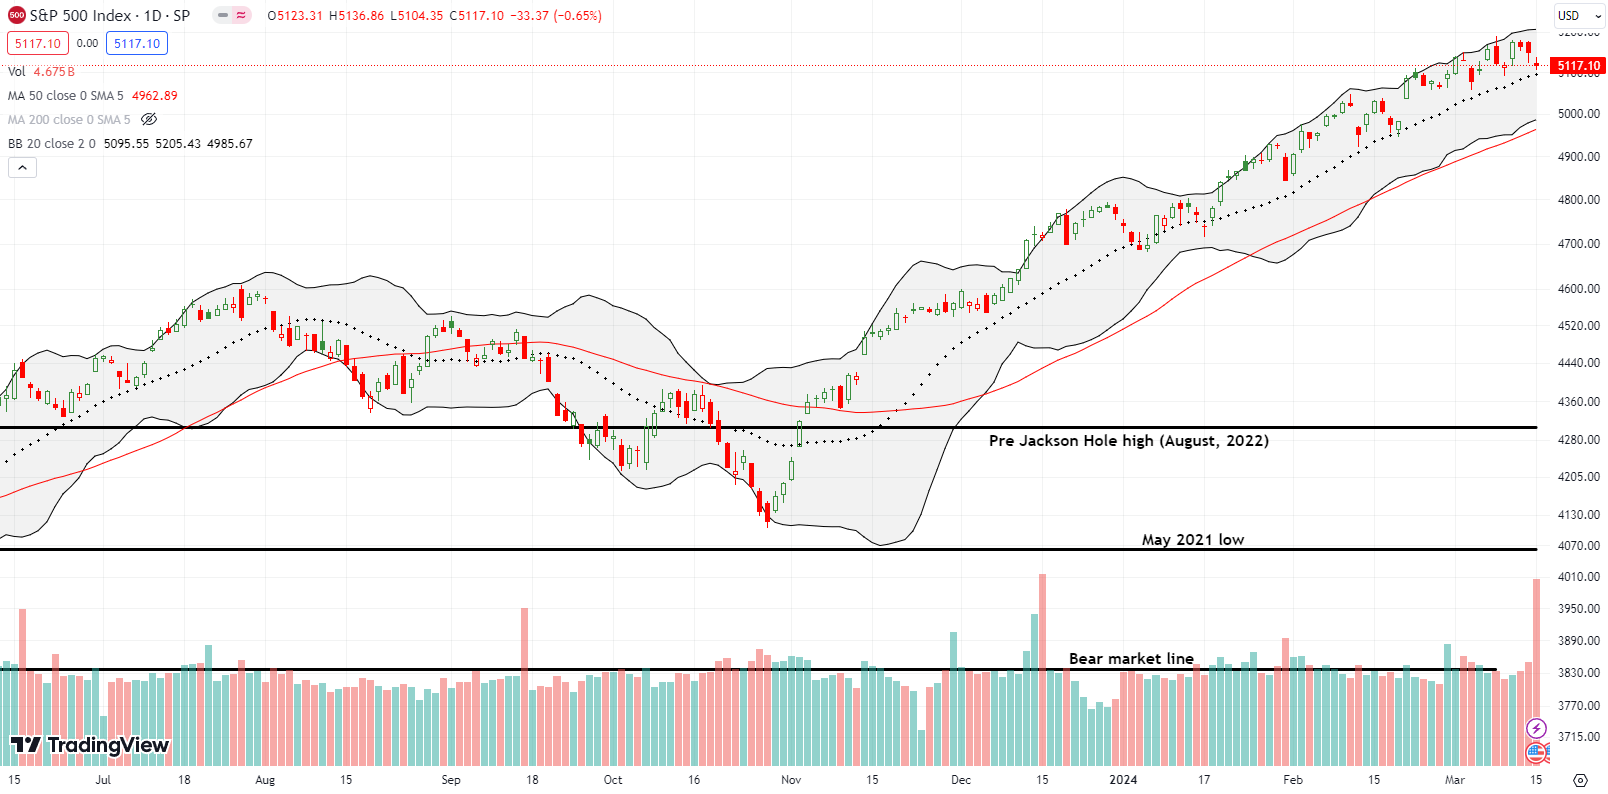
The S&P 500 (SPY) actually made no net progress for the week. It is the second such week in a row, but only the fourth week in the last 20 where the index has failed to make progress. This curious break in the trading action looks like the start of rally fatigue (remember, money is finite in the short-term). However, given the 20-day moving average (DMA) (the dotted line below) continues to hold strong as support, this stasis looks unremarkable to the casual observer. Since I am skeptical of the rally, I am keeping in mind the context of the latest topping pattern. Bulls this week fell just short of invalidating the last topping pattern. (March 18, 2024 addendum: I bought an SPY call spread for a quick bounce off 20DMA support. At the time of typing, I SPY jumped 0.8%, partially thanks to NVDA’s strong open, and I took profits).
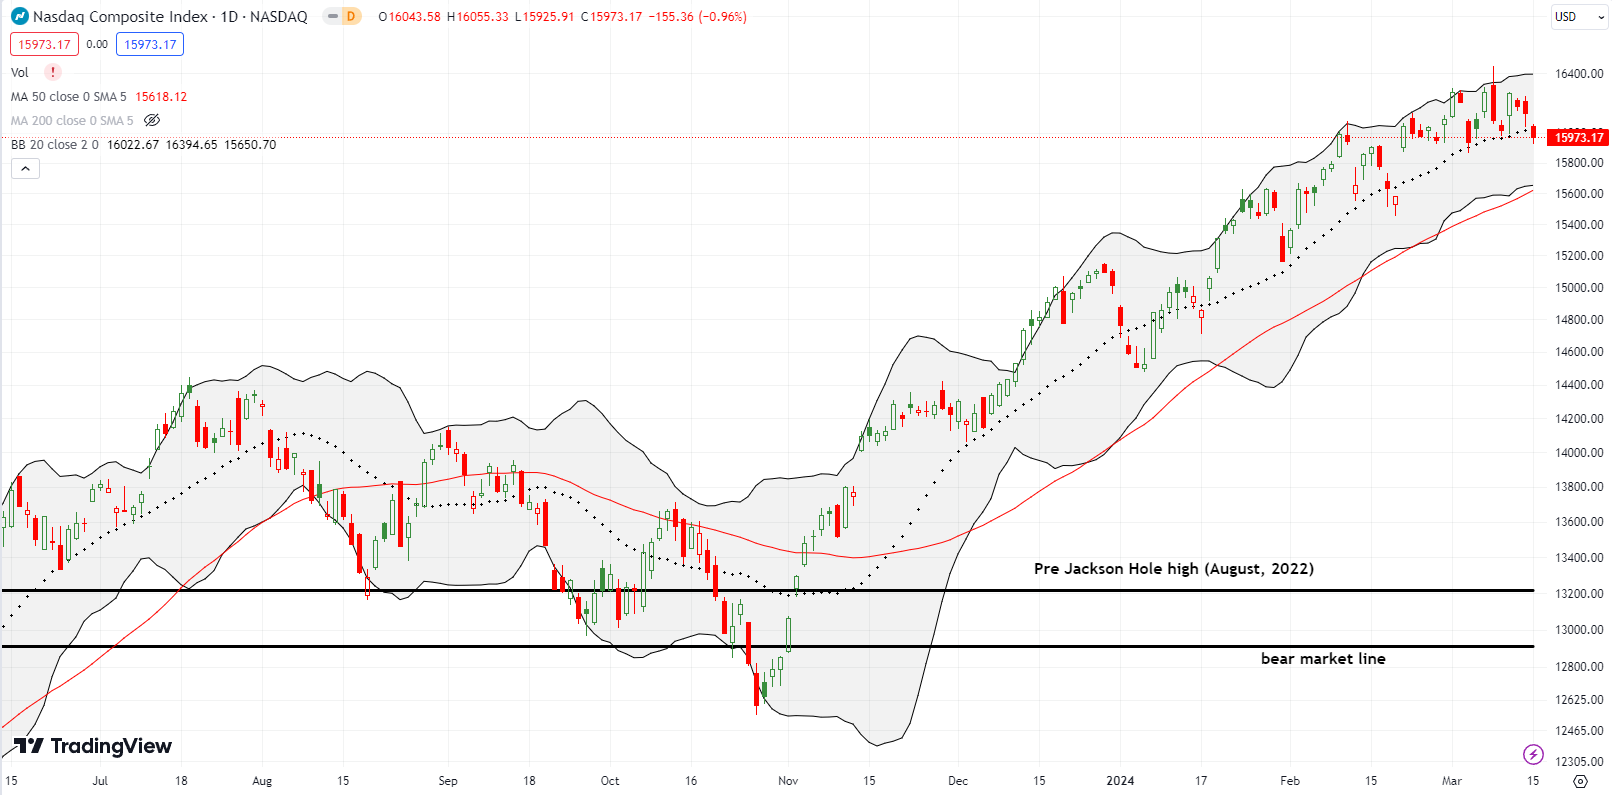
The NASDAQ (COMPQ) never came close this week to invalidating its topping pattern. In fact, Friday’s close below the 20DMA validated the topping pattern. The tech laden index is even right back to where it was at the last topping pattern that preceded a decent amount selling and the last 20DMA breakdown. In other words, if bears are curious enough, they can easily push the NASDAQ to a long overdue test of 50DMA support (the red line). My call spread on QQQ to play the predictable bounce off 20DMA support worked well for one day. I got greedy and failed to profit while waiting for follow-through – very poor execution for a rally skeptic!
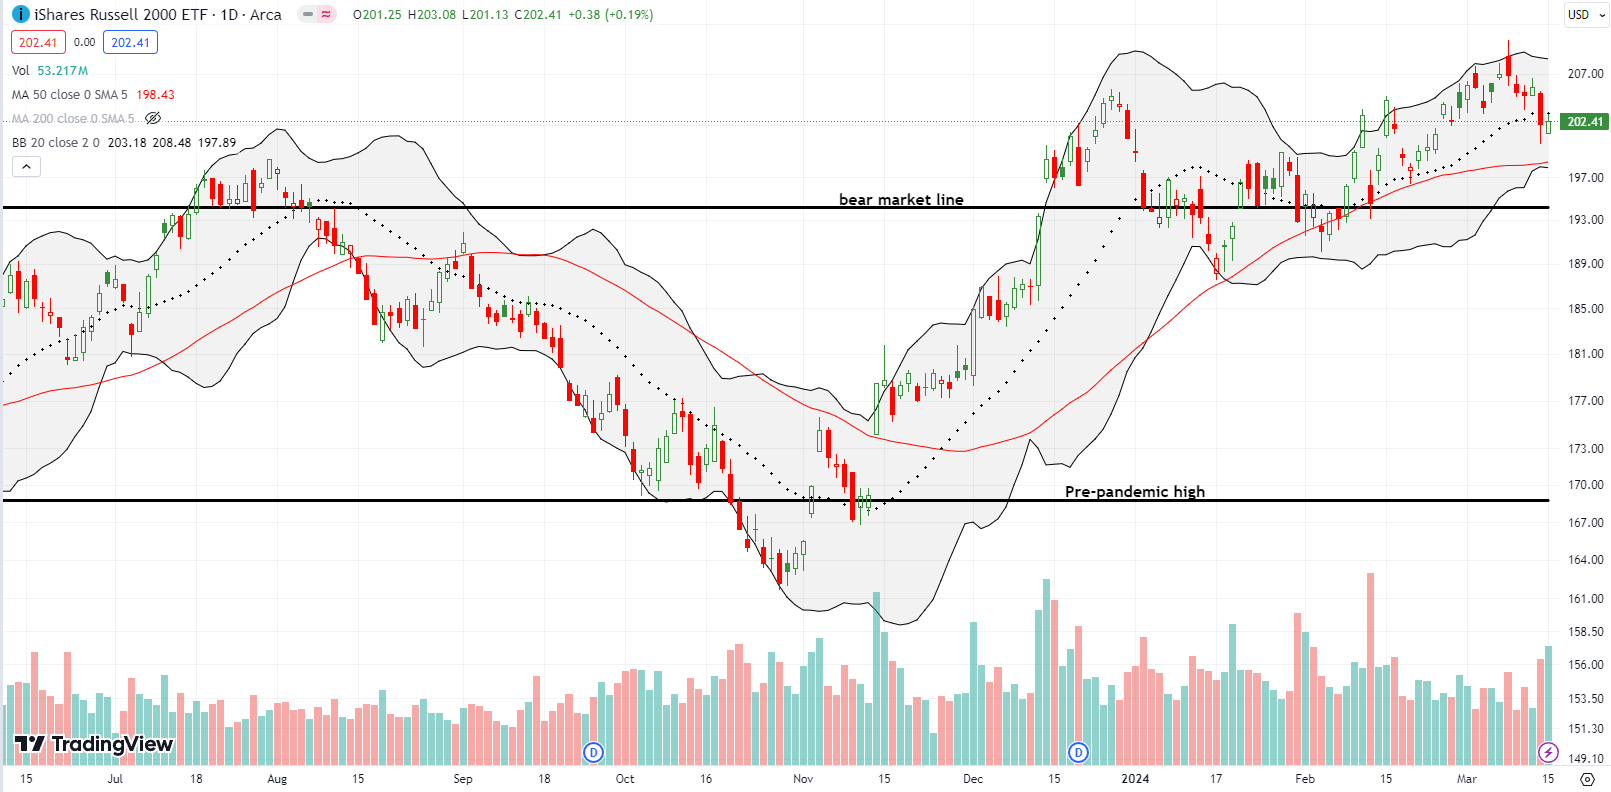
The iShares Russell 2000 ETF (IWM) behaved just as I suspected. In the last Market Breadth post, I claimed “if the bears actually follow-through this coming week, I expect IWM to quickly fall back to 20DMA support.” Sellers almost pulled off a test of 50DMA support on Thursday, but the ETF of small caps mounted a small comeback right at the price from the close of 2023 (imagine that). Still, like the NASDAQ, IWM confirmed its topping pattern. My last call options expired worthless, and I took one more swing in case this week’s Fed meeting actually inspires the buyers one more time (not likely in my humble opinion). Call it a hedge against my skepticism.
The Short-Term Trading Call With A Curious Break
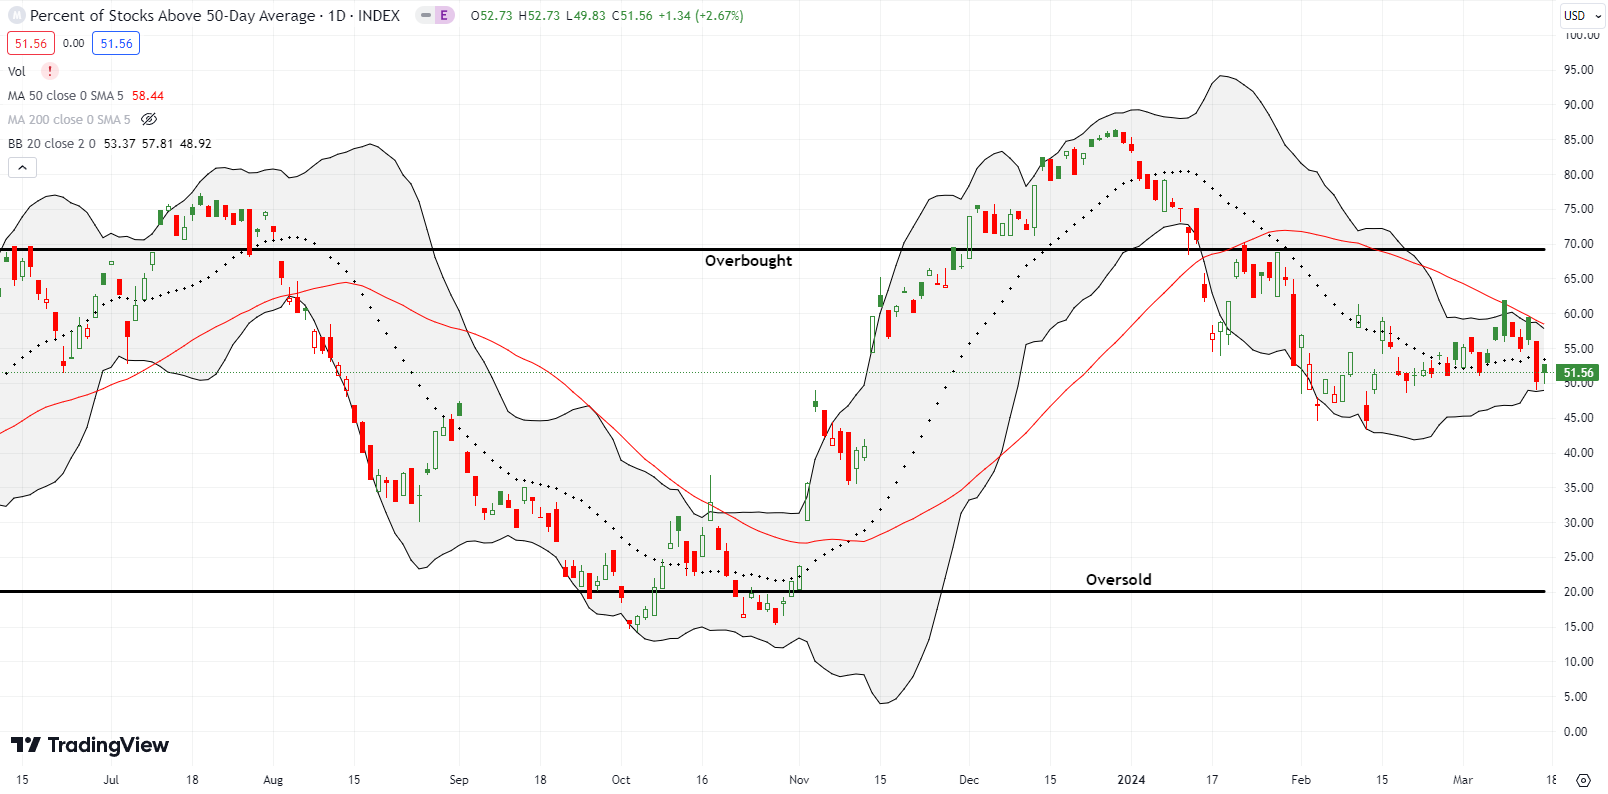
- AT50 (MMFI) = 51.6% of stocks are trading above their respective 50-day moving averages
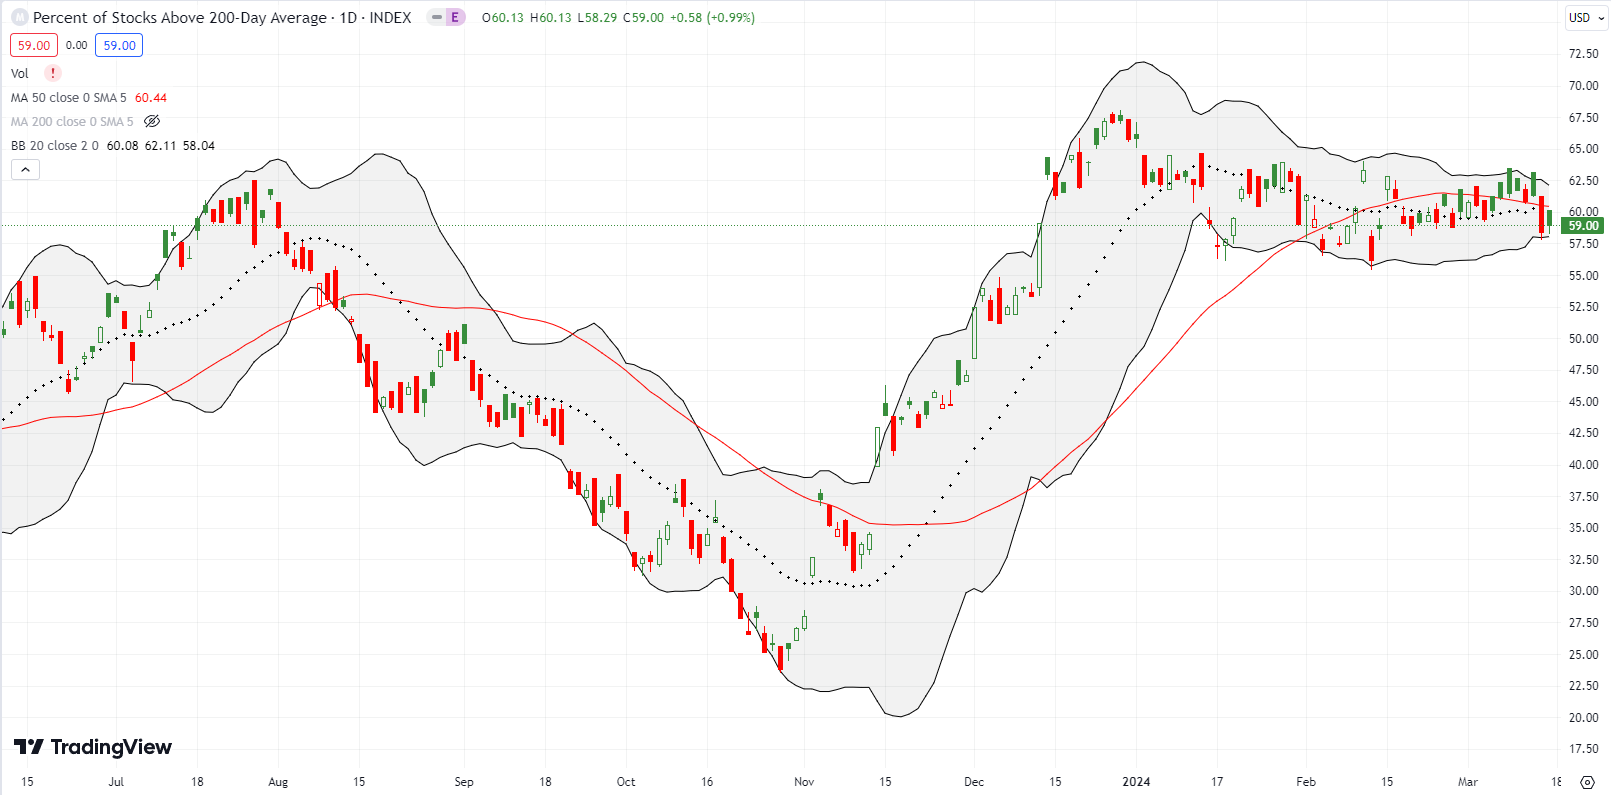
- AT200 (MMTH) = 59.0% of stocks are trading above their respective 200-day moving averages
- Short-term Trading Call: skeptical
AT50 (MMFI), the percentage of stocks trading above their respective 50DMAs, closed at 51.6%. Thursday’s plunge of 6 percentage points ended the breakout for my favorite technical indicator. Prior to the plunge, AT50 looked ready to make a fresh run to the overbought threshold. This latest weakness in market breadth and the curious break in the trading action refreshed my skepticism about the market rally.
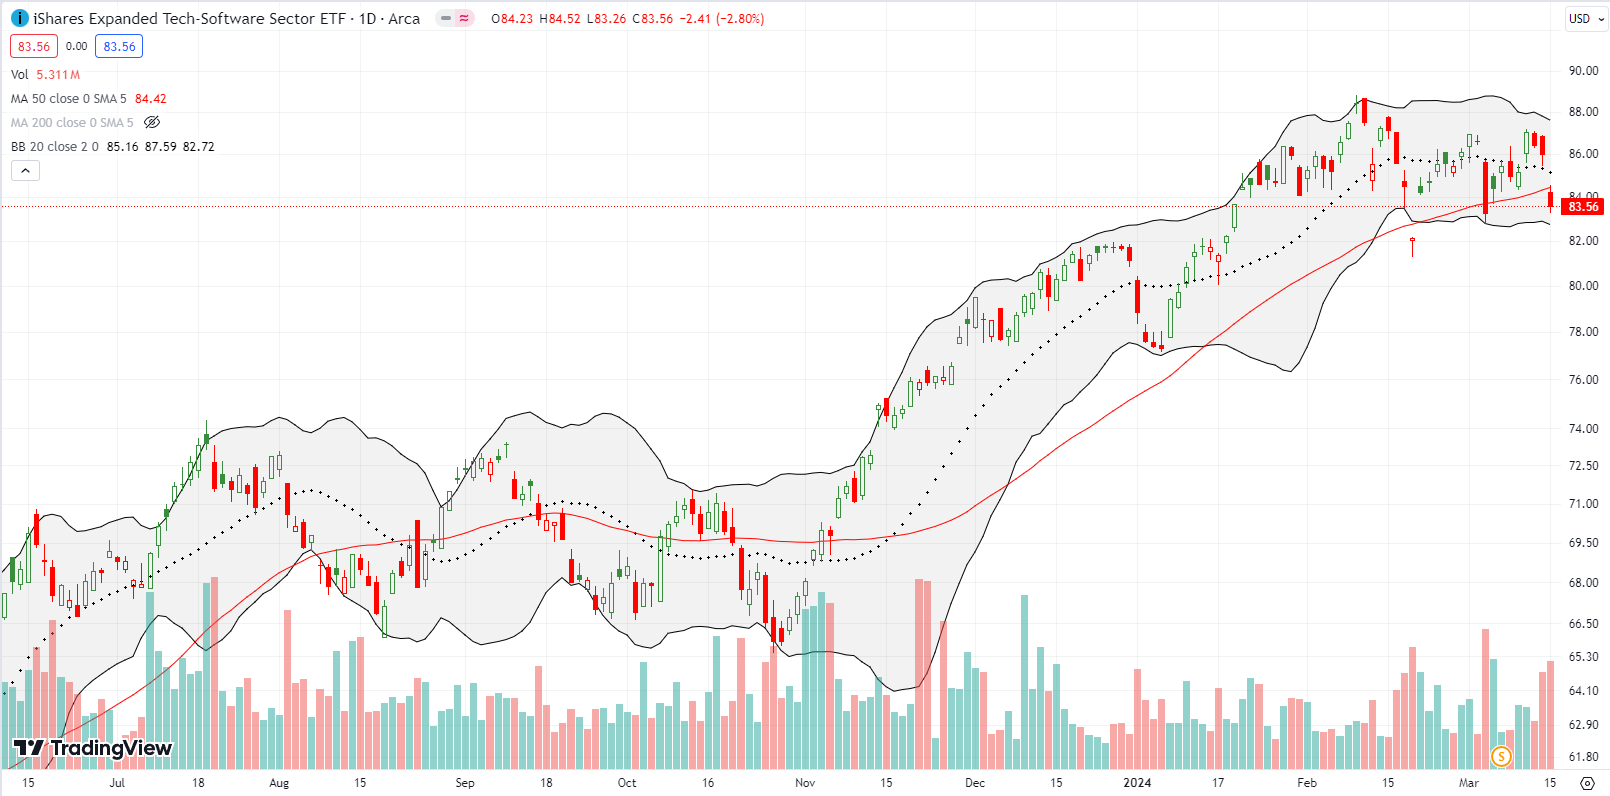
Recall that the iShares Expanded Tech Software Sector ETF (IGV) is the biggest target for my skepticism. IGV ended the week with a 2.8% loss and 50DMA breakdown. A 13.7% post-earnings loss in Adobe (ADBE), the 7th largest component in IGV, helped grease the skids. IGV’s 20DMA is now turning downward and suggesting a sustained change in fortunes. Note I am slightly conflicted since Microsoft (MSFT) is the largest component of IGV but one of my key members of the generative AI trade.
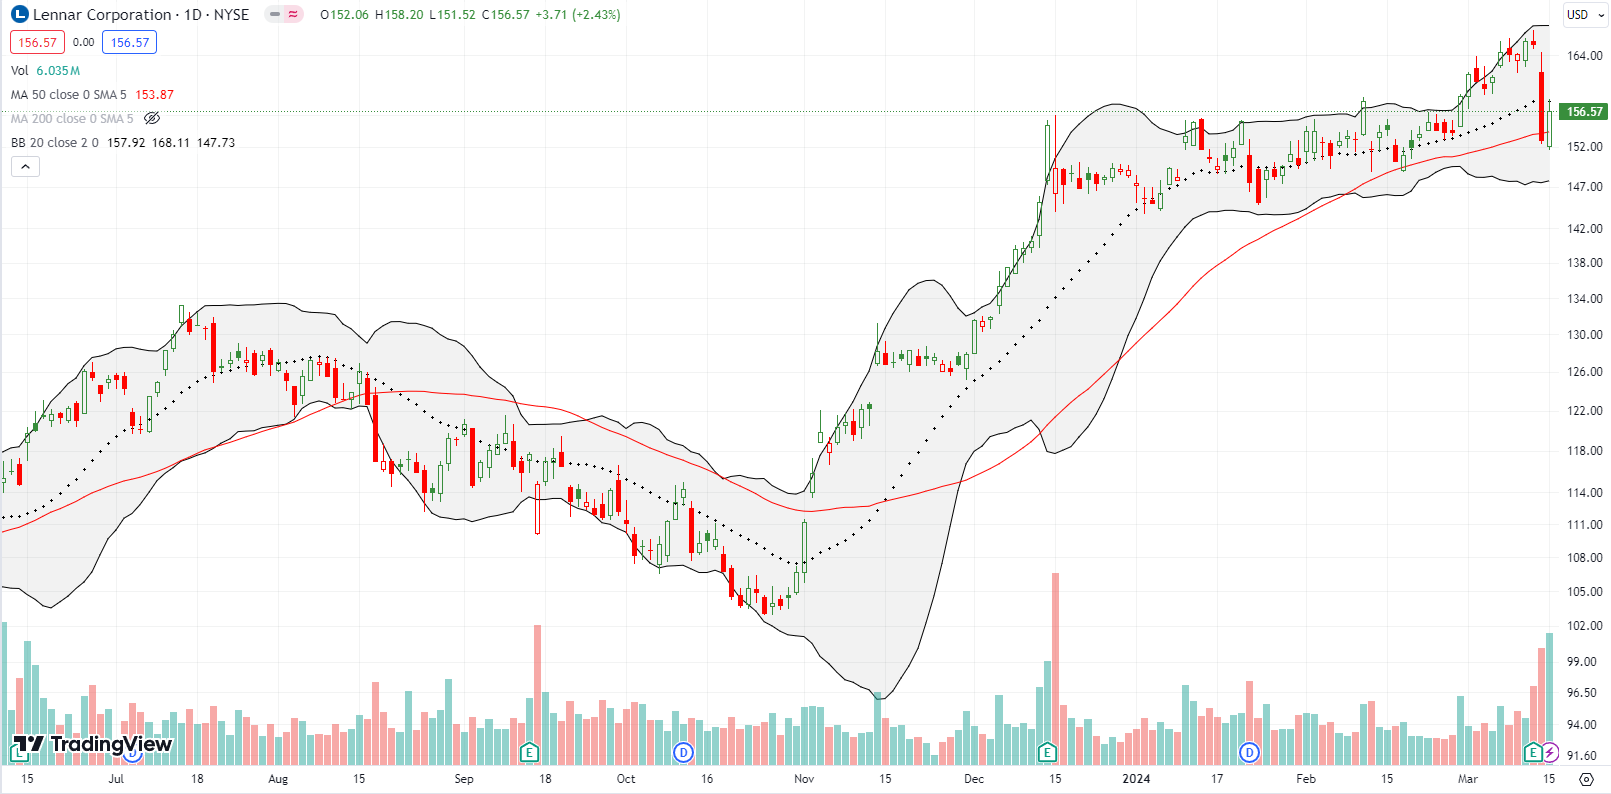
The trade in home builders looks toppy all over again. This curious break in the trading action came after Lennar Corporation (LEN) disappointed investors to the tune of a 7.6% post earnings loss and 50DMA breakdown. A surge in bond yields further pressured the sector. For some reason, buyers returned to the sector on Friday even though bond yields remained flat. LEN rebounded 2.4% and escaped a confirmation of a bearish turn in its technicals.
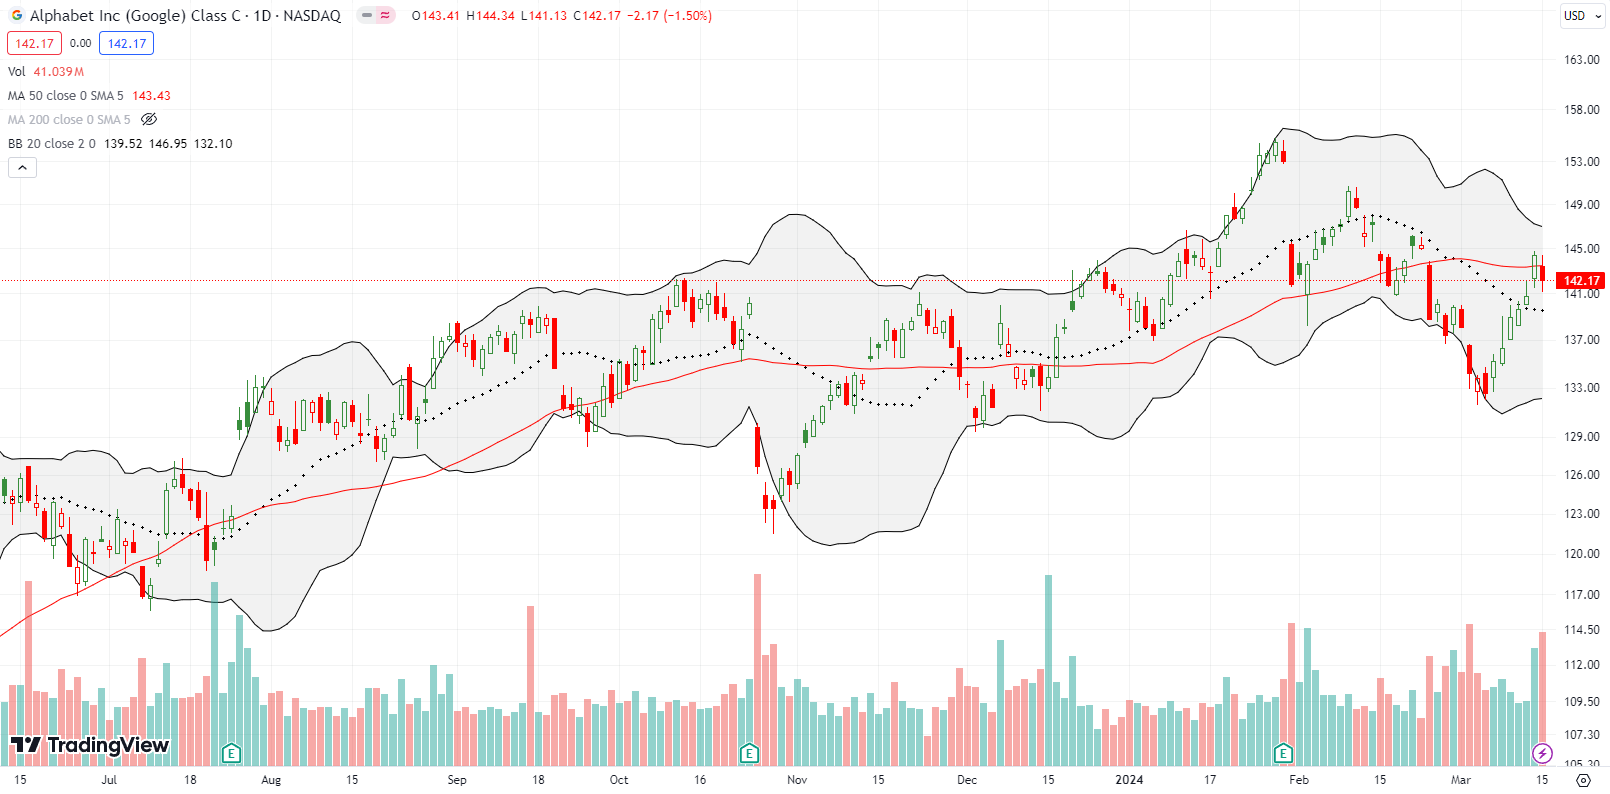
Alphabet Inc (GOOG) pulled off a rinse and repeat move. GOOG sold off at the beginning of the generative AI trade due to a poor rollout of Bard, the predecessor to Gemini. I bought that over-reaction and profited soon after. Gemini stumbled out the gate in December after Alphabet was exposed for fakes during its demo. Another gaffe happened in February, and the company was forced into yet another embarrassing admission, this time about AI-generated images:
“So what went wrong? In short, two things. First, our tuning to ensure that Gemini showed a range of people failed to account for cases that should clearly not show a range. And second, over time, the model became way more cautious than we intended and refused to answer certain prompts entirely — wrongly interpreting some very anodyne prompts as sensitive.
These two things led the model to overcompensate in some cases, and be over-conservative in others, leading to images that were embarrassing and wrong.”
The following Monday, GOOG plunged 4.6% and suffered a 50DMA breakdown. I concluded once again that the market over-reacted. Given I sensed a repeat of trading history, I moved a little too fast in accumulating a position. Fortunately a late rally over the past two weeks saved my positions. I closed out with profits on Thursday and Friday as GOOG contended with 50DMA resistance. The rebound was a classic technical bounce. The timing was very fortunate given my positions expired on Friday. Now I wait for the next dip, sell-off, or breakout.
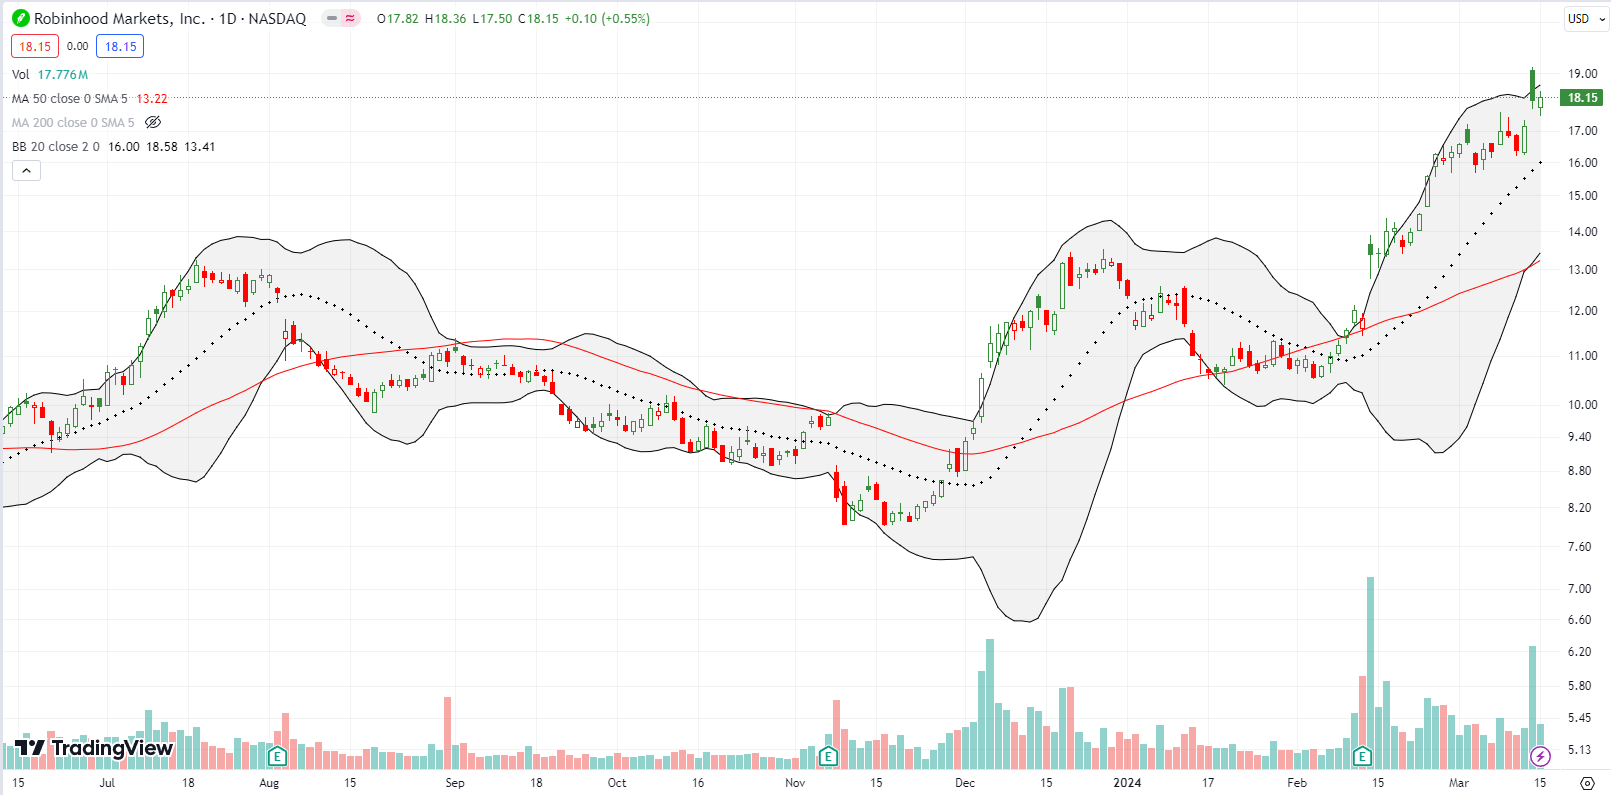
Two weeks ago I made a fresh case for Robinhood Markets, Inc (HOOD) as a better (short-term) play on crypto trading than Coinbase Global, Inc (BASE). My trade worked out after Robinhood announced its February operating statistics, and HOOD opened up 12.1% on Thursday. A down market day dragged on the price action, and I had to settle for a lower exit price. If I had shares instead of a call spread, I could have closed out this particular trade more efficiently. HOOD remains in a bullish position after tiny follow-through on Friday.
COIN is up 5.8% since the open of trading after my HOOD post. HOOD is up 6.3% over the same time frame. I still think HOOD has the go-forward advantage as a more diversified trading platform even though it does not carry the full range of alternative crypto coins that COIN dares to carry.
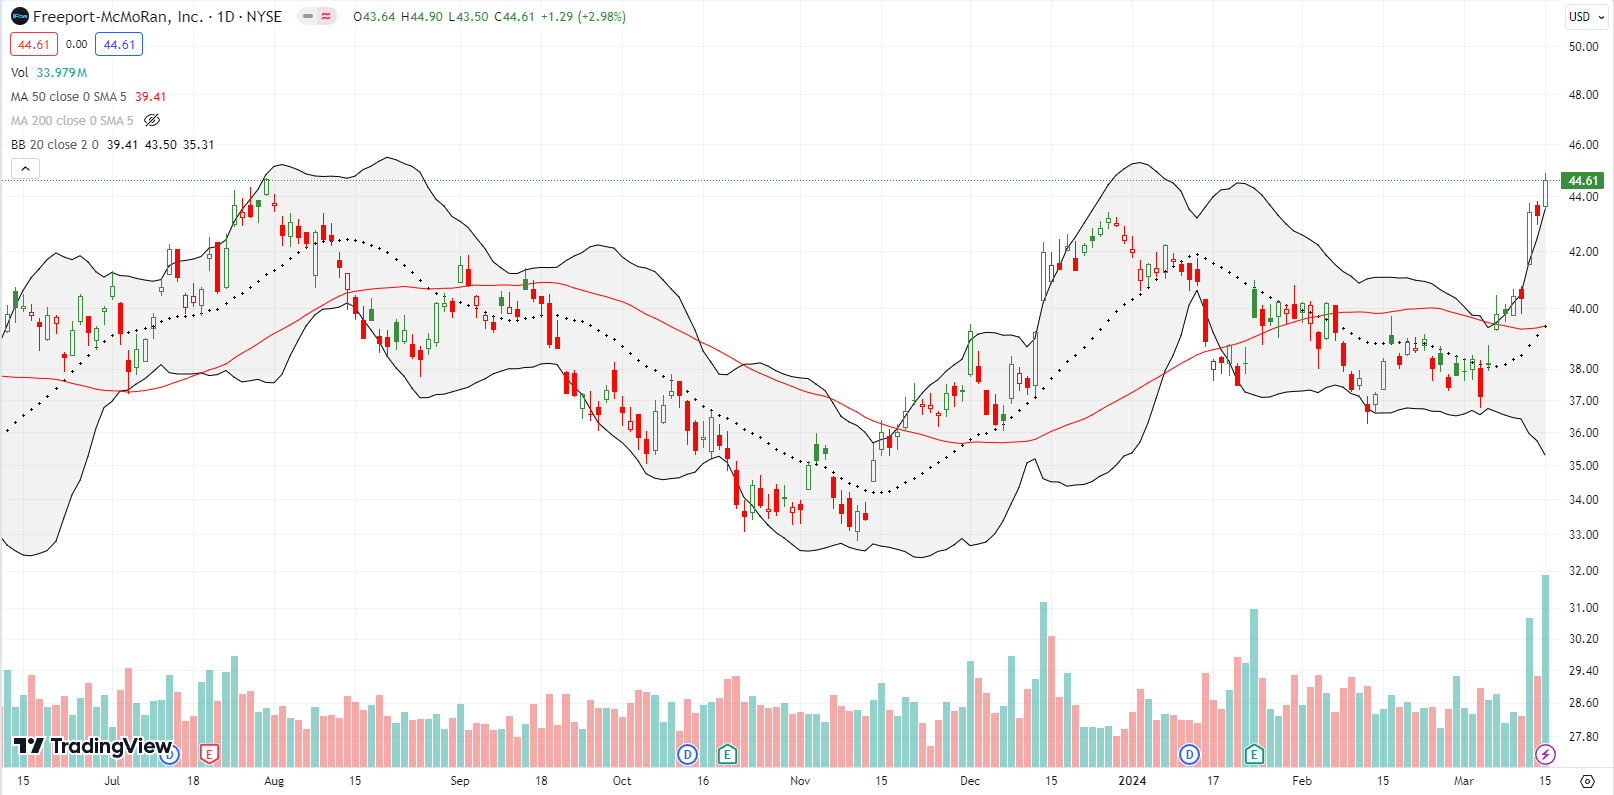
There is so much talk about economic weakness in China that last week’s surge in copper completely took me by surprise; copper is supposed to be a leading indicator of the health of industrial production. Freeport-McMoRan, Inc (FCX) went parabolic after starting the week with a confirmation of its earlier 50DMA breakout. FCX closed the week right at resistance from last summer (see the left side of the chart below). I now want to buy the dips in FCX. I am also eyeing the iron ore miners for some buyable sign of fresh life.
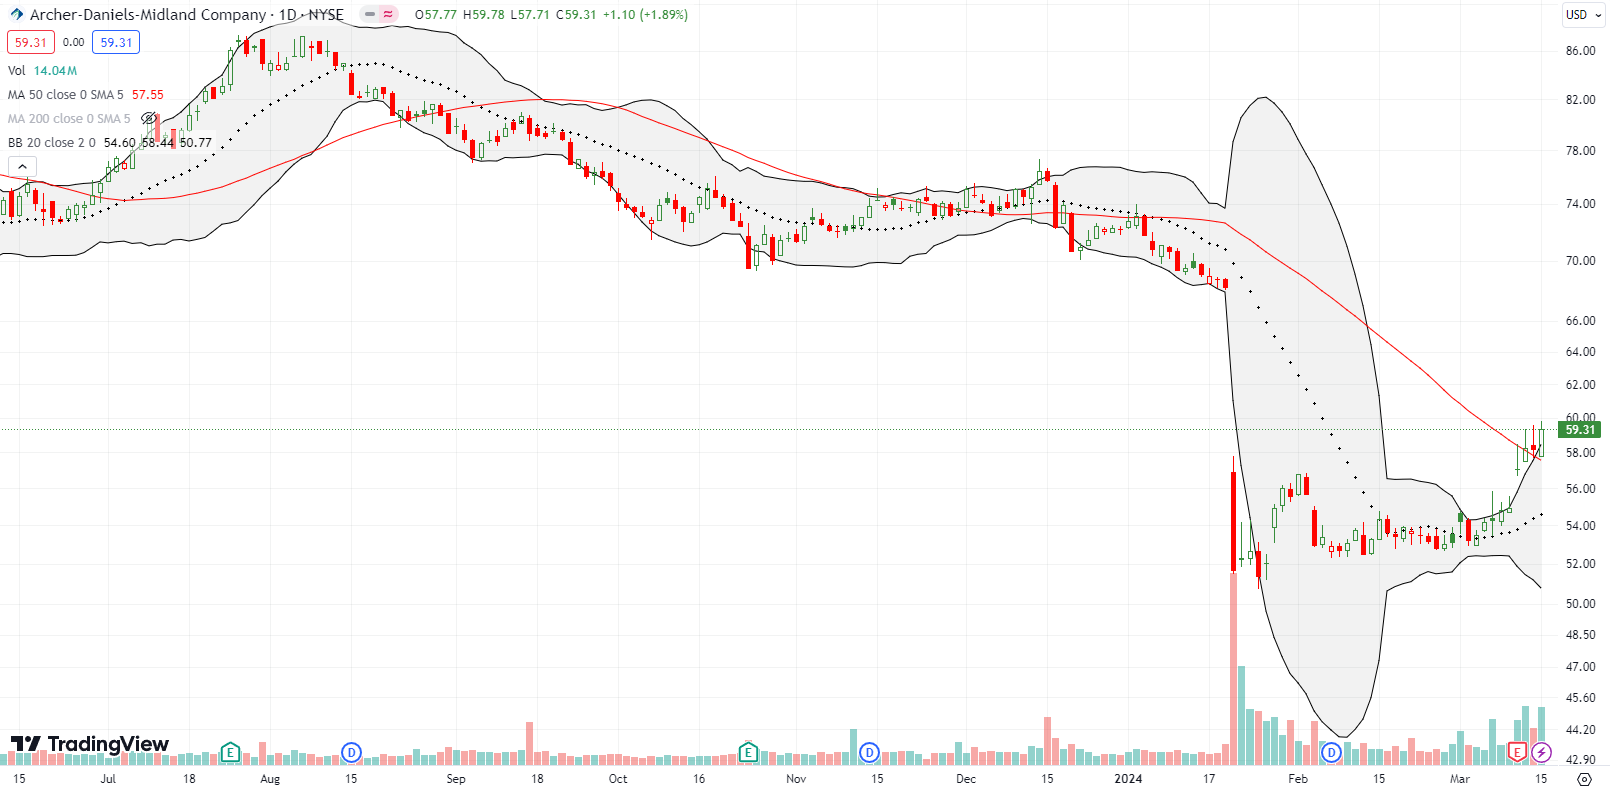
Archer-Daniels-Midland Company (ADM) experienced its own 50DMA breakout…but from a deep trough. In late January, I made the case for buying ADM despite the collapse from an accounting scandal. ADM managed to avoid a new low from there. Last week, ADM pulled off a 3.9% post-earnings relief rally. Buying interest remains strong with higher volume and a confirmed 50DMA breakout. Now I can raise my stop on ADM from a new low to a fresh 50DMA breakdown. However, I am pretty sure I am going to hold ADM for much longer as the healing process unfolds.
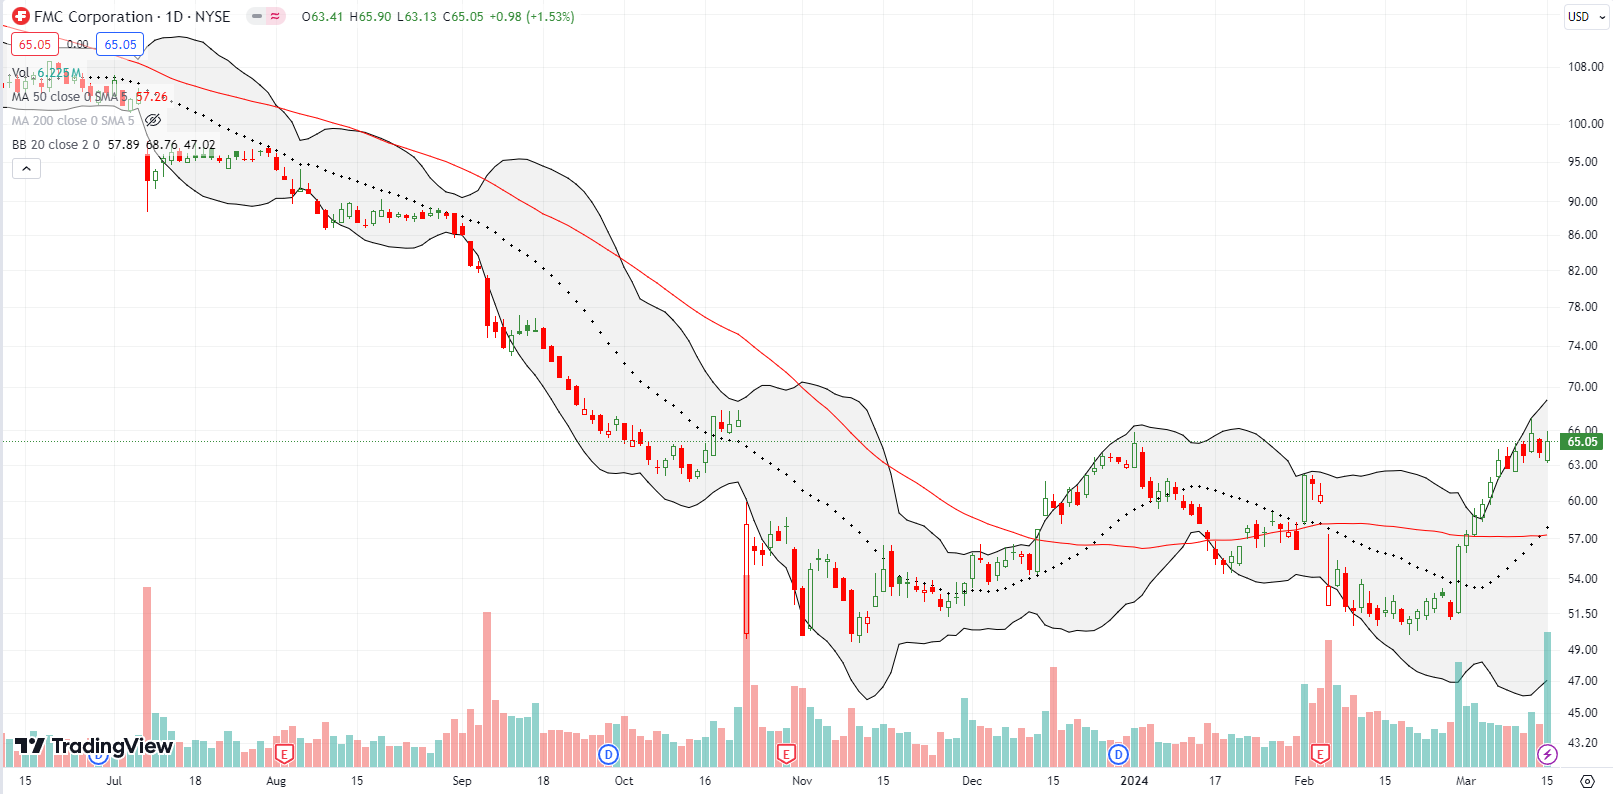
FMC Corporation (FMC) is another agricultural company and stock trying to make a bottom. FMC caught my attention last December after a 50DMA breakout flagged the potential opportunity. At the time I was looking for catch-up plays at the early stage of the current bull market run. The breakout did not last long, but FMC never made a new low even after an 11.5% post-earnings loss. Now FMC is close, once again, to filling the post-earnings gap down from October. Hopefully this third 50DMA breakout is the charm.
Be careful out there!
Footnotes
Subscribe for free to get email notifications of future posts!
“Above the 50” (AT50) uses the percentage of stocks trading above their respective 50-day moving averages (DMAs) to measure breadth in the stock market. Breadth defines the distribution of participation in a rally or sell-off. As a result, AT50 identifies extremes in market sentiment that are likely to reverse. Above the 50 is my alternative name for “MMFI” which is a symbol TradingView.com and other chart vendors use for this breadth indicator. Learn more about AT50 on my Market Breadth Resource Page. AT200, or MMTH, measures the percentage of stocks trading above their respective 200DMAs.
Active AT50 (MMFI) periods: Day #78 over 20%, Day #76 over 30%, Day #74 over 40%, Day #22 over 50% (overperiod), Day #34 under 60%, Day #45 under 70%
Source for charts unless otherwise noted: TradingView.com
Full disclosure: long IWM call spread, short IGV, long ADM, long FMC, long SPY call spread
FOLLOW Dr. Duru’s commentary on financial markets via StockTwits, Twitter, and even Instagram!
*Charting notes: Stock prices are not adjusted for dividends. Candlestick charts use hollow bodies: open candles indicate a close higher than the open, filled candles indicate an open higher than the close.


1 thought on “A Curious Break in the Trading Action – The Market Breadth”