Stock Market Commentary
There is a deepening irony in my on-going bearishness on the stock market. The sector most visibly responsible for the anti-bearish animal spirits leaning against poor market breadth is the same sector I remain unapologetically bullish about: Artificial Intelligence (AI). The ironic contrast was in full display last week as the bullish rallying cry went out “All Hail, NVIDIA.” The heralded semiconductor company reported another round of impressive earnings just in time to end the latest shallow dip in the major indices. As I scrambled to put into play a fresh set of (short-term) AI bullish trades, I realized that my bearish trading call on the market needs a modification. Before I explain the changes, let’s take a look at my favorite three major indices.
The Stock Market Indices
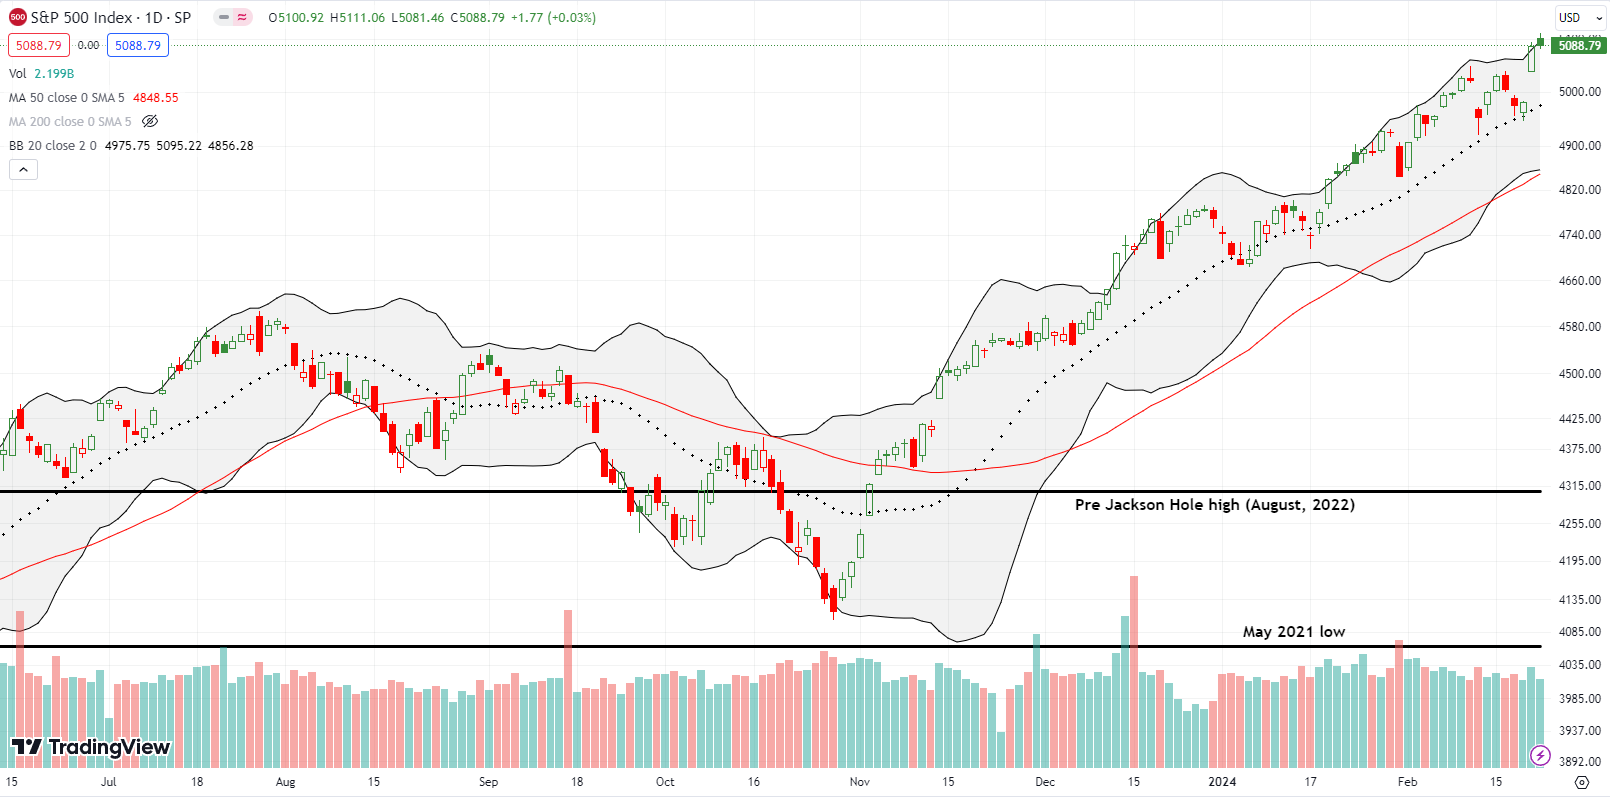
The S&P 500 (SPY) hailed NVIDIA with a picture-perfect bounce off support at its 20-day moving average (DMA) (the dotted line below). The index gained 2.1% and closed at a new all-time high. Sellers faded Friday’s follow-through buying and left the index essentially flat with its all-time high. The consistency of 20DMA support throughout this run-up has been truly impressive.
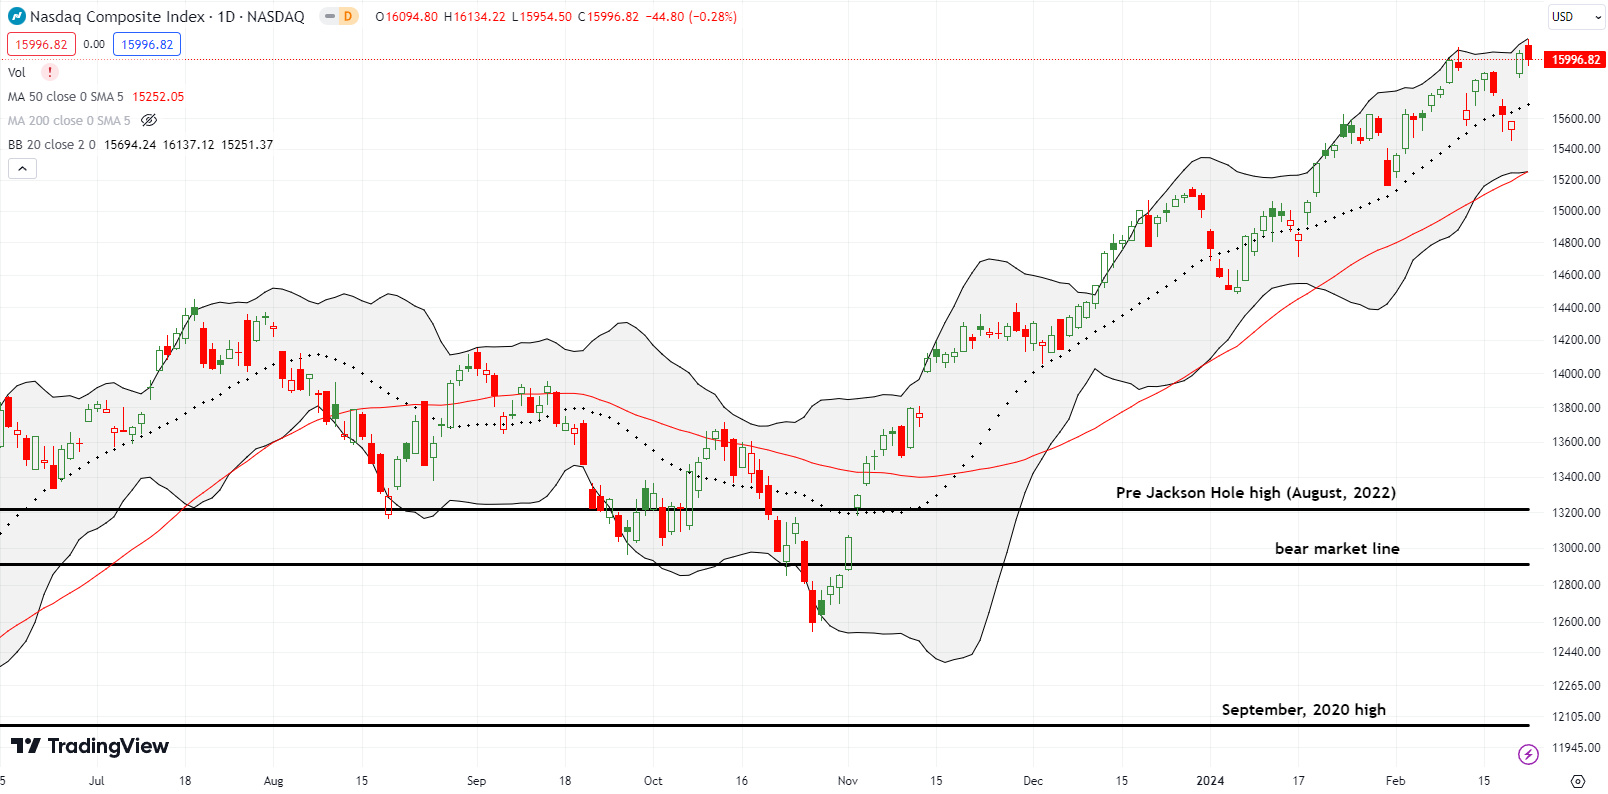
The NASDAQ (COMPQ) has travelled a bumpy road along 20DMA support. The tech-laden index even found itself closed below its 20DMA ahead of NVIDIA earnings. The move seemed to confirm the bearish topping pattern from February 12th. However, the NASDAQ hailed NVIDIA with a 3.0% gain and a one-day reversal of the entire bearish signal. Buyers surprisingly failed to confirm the fresh multi-year breakout with a higher close. The NASDAQ faded to a 0.3% loss for Friday.
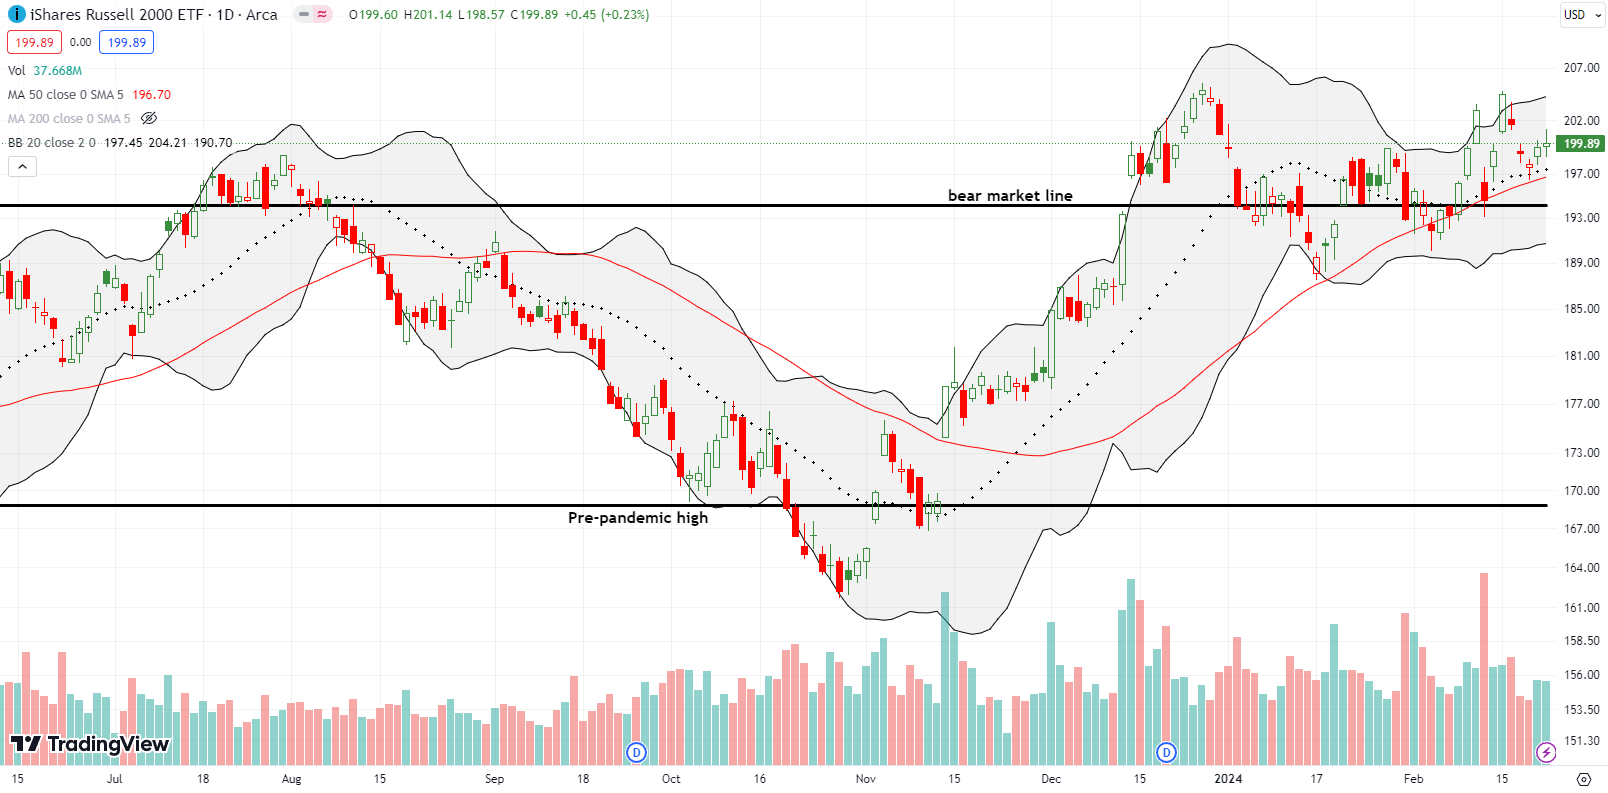
The iShares Russell 2000 ETF (IWM) gave NVIDIA a “mini” hail. The ETF of small caps gained 0.8% and pulled off a picture-perfect defense of 50DMA support (the red line below). IWM’s 20DMA also received a ringing endorsement. The small move allowed me to scramble my way into a diagonal calendar call spread and a regular call spread in IWM at reasonable prices. I locked in a small profit on the calendar spread on Friday. Needless to say, IWM is in a bullish position as long as it trades above its bear market line and its uptrending 20DMA and 50DMA.
The Short-Term Trading Call While Hailing NVIDIA
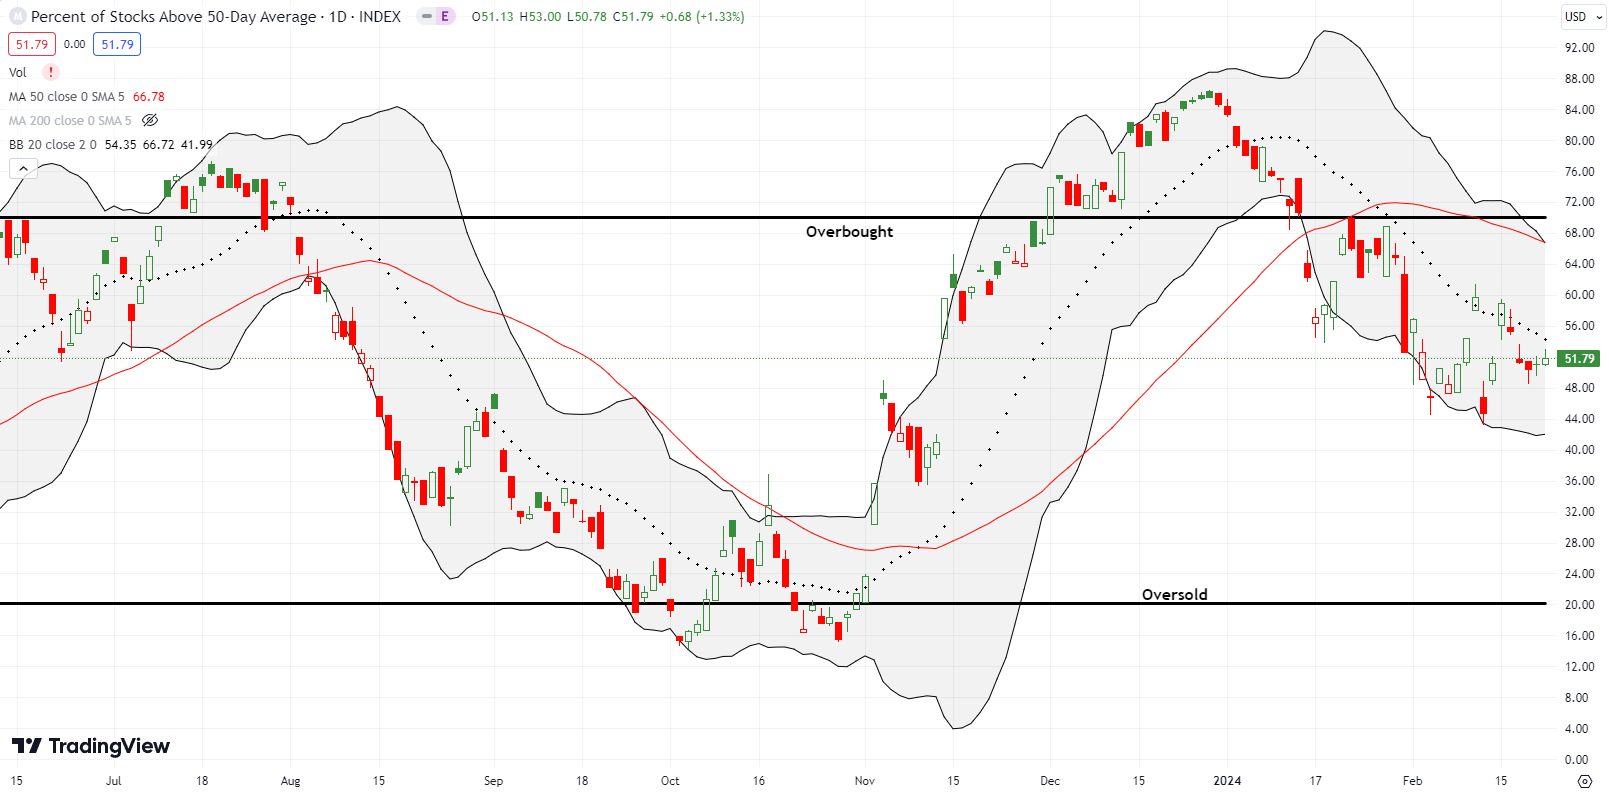
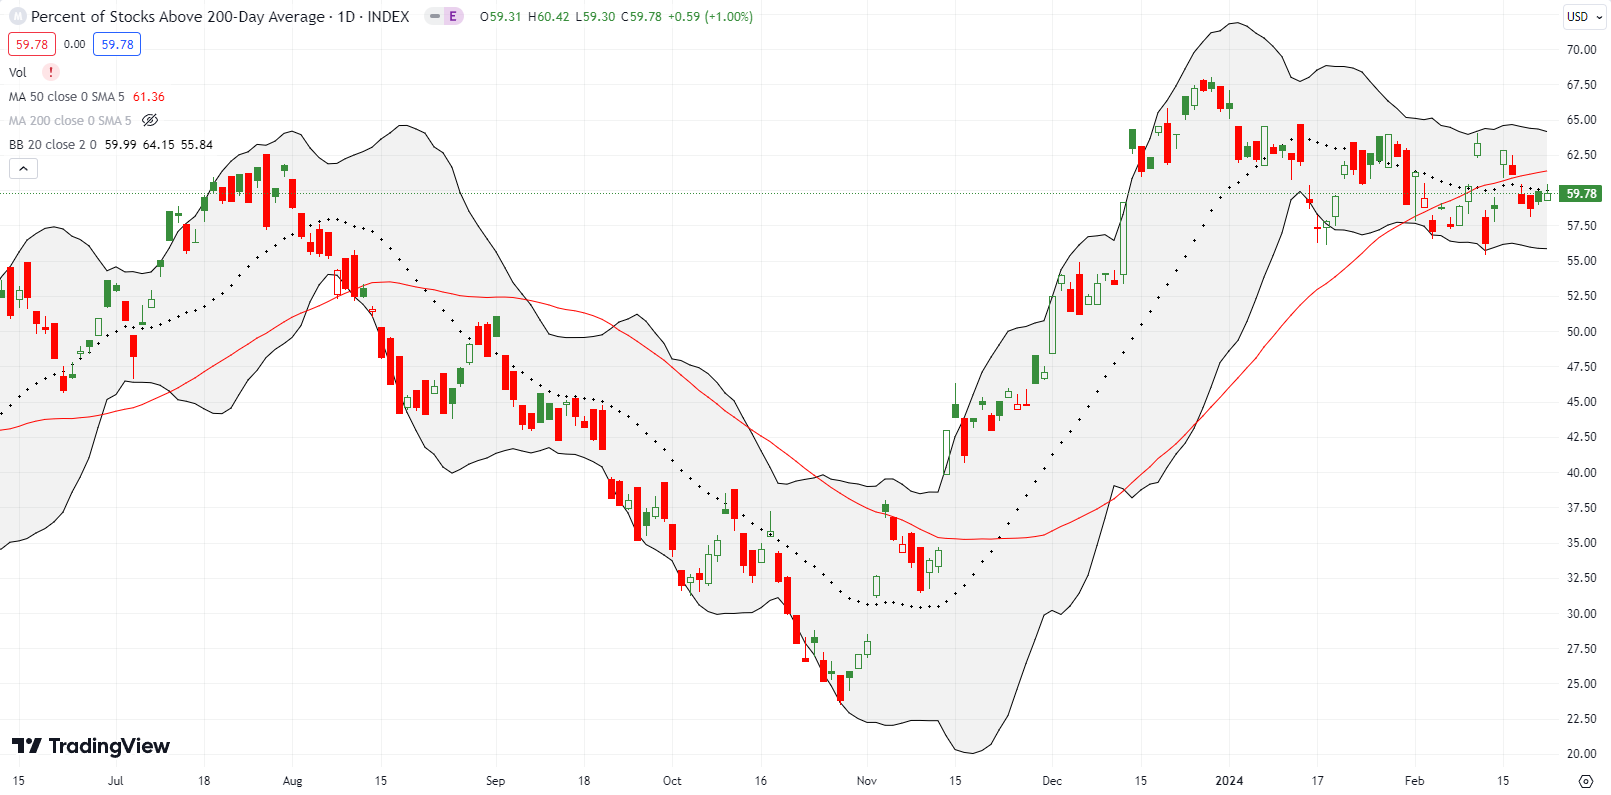
- AT50 (MMFI) = 55.4% of stocks are trading above their respective 50-day moving averages
- AT200 (MMTH) = 61.1% of stocks are trading above their respective 200-day moving averages
- Short-term Trading Call: skeptical
AT50 (MMFI), the percentage of stocks trading above their respective 50DMAs, demonstrated almost none of the market’s enthusiasm for NVIDIA. My favorite technical indicator gained a fraction of a percentage point on Thursday and again on Friday. Given the on-going downtrend in AT50, this sluggishness further deepened my skepticism about the market’s current underlying health.
Yet, after I stepped back and noticed other pockets of the market breaking out and/or enjoying healthy rallies, retail and restaurants in particular, I realized that a bearish trading call on the market is not a functional description for this market juncture. Instead, it is an overly committed positioning in this market with co-existing bullish and bearish truths. As a result, I decided to invent a new short-term trading call: “skeptical.”
I dropped the bearish call in deference to the plentitude of bullish trading opportunities in the stock market. I am definitely not bullish because my AT50 trading rules insist that I avoid bullishness here. Finally, I did not compromise with a downgrade to neutral because I still have a strong and negative opinion about the market. In this context, “skeptical” gives me a good framework for trading the bullish opportunities while my bearish views scream at me to be ready so I do not need to get ready.
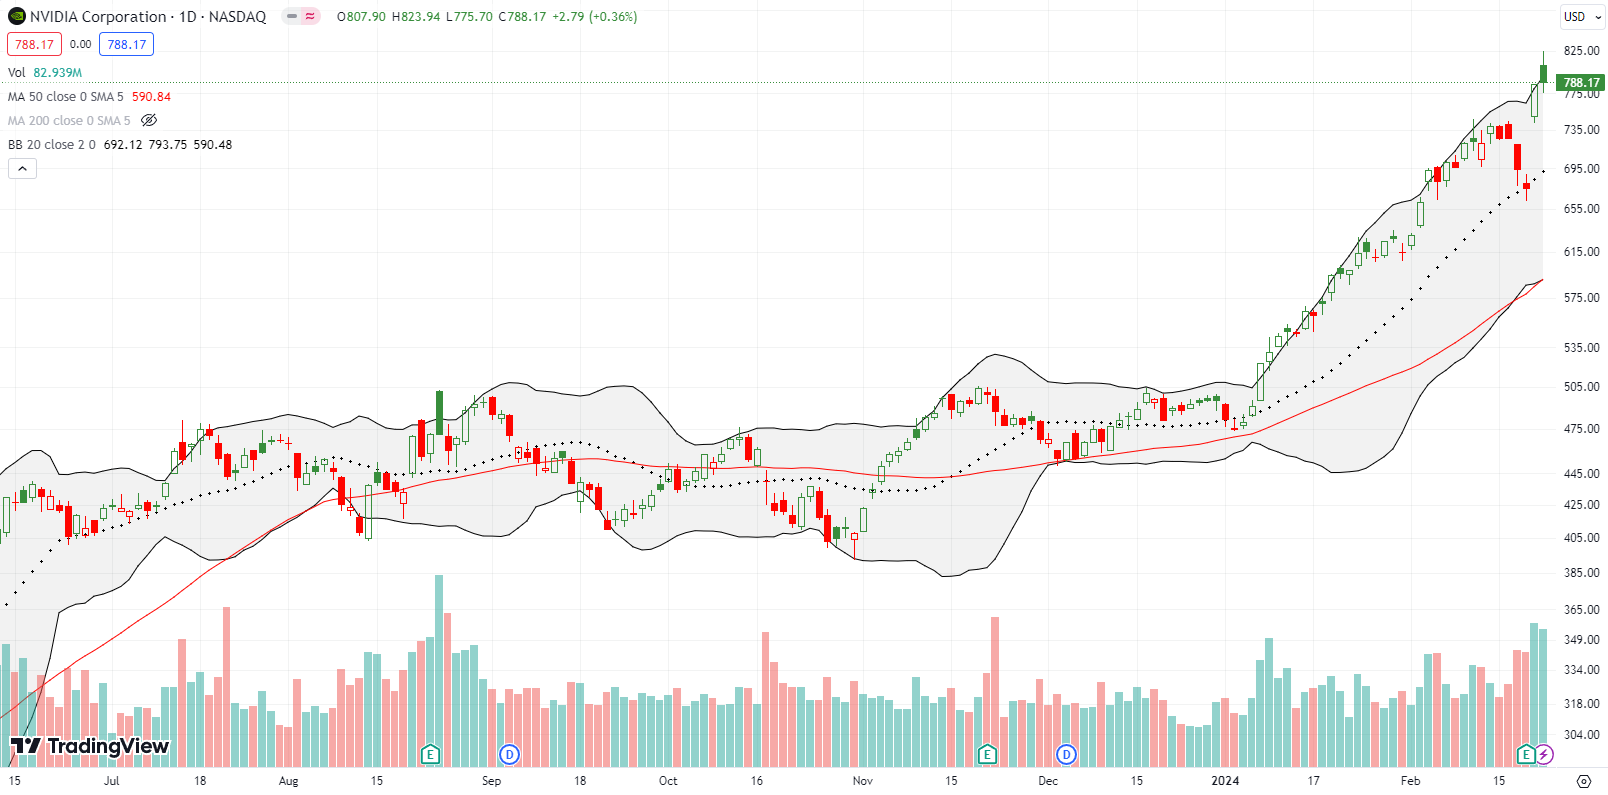
All hail NVIDIA Corporation (NVDA)! Before reporting earnings, NVDA dipped straight to 20DMA support. The close was a classic do-or-die, pre-earnings moment. NVDA delivered and surged 16.4% to a new all-time high. The relentless push higher sent me scrambling for a trade. A weekly calendar spread is one of my favorite trades for chasing short-term momentum especially a day before the short side expires. On the day of expiration, the short side suffers rapid time decay while the long side expiring in the next week holds relative value. Thus, with a strike “close but not too close” any move higher will deliver profits and even smaller moves lower can be profitable. In the case of a sharp pullback, the position has a little time to recover in the time remaining before expiration.
I picked a weekly NVDA calendar call with an $800 strike. NVDA gapped up on Friday to open around $808 (making me wish I chose the $810 strike!), so I moved quickly to take profits. I kept periodic tabs on the price dynamics and was stunned to see how much money I actually left on the table as NVDA faded the rest of the day. Even at NVDA’s flat close of $788.17, the long call gained around 15%; quite a surprising close. Thus the risk/reward of the position was even better than I expected. These price dynamics demonstrate the heavy bias traders have for NVDA call options!
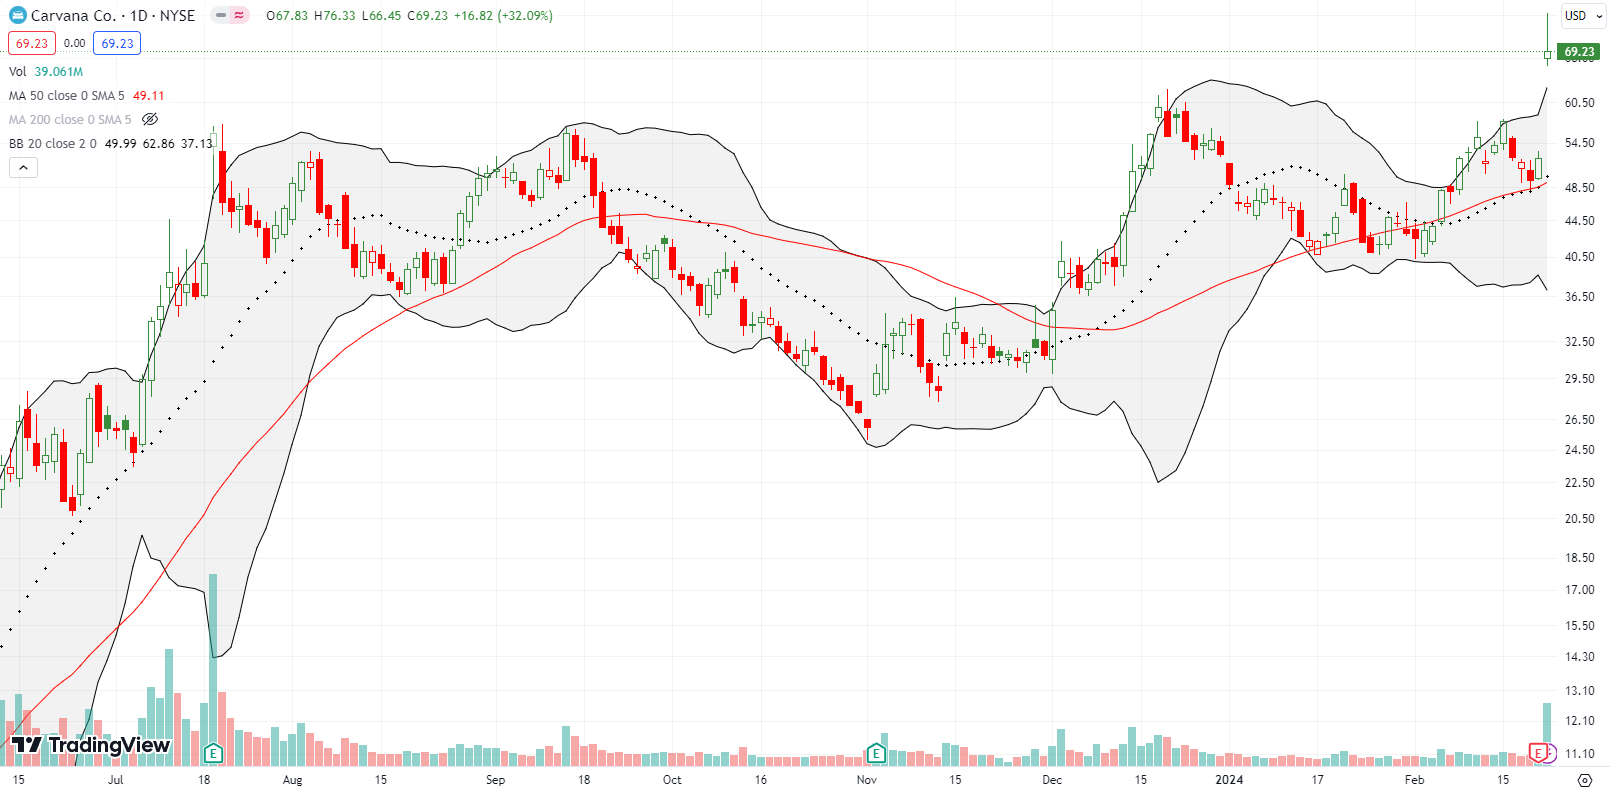
“Vending machine” used car company Carvana Co (CVNA) added itself to the list of surging stocks after a 32% post-earnings move. CVNA was up as much as 46% at the open. This breakout to a near 2-year high is bullish for CVNA (THAT admission was hard for me!). CVNA actually looks like a buy on the dips after its successful test of 50DMA support.
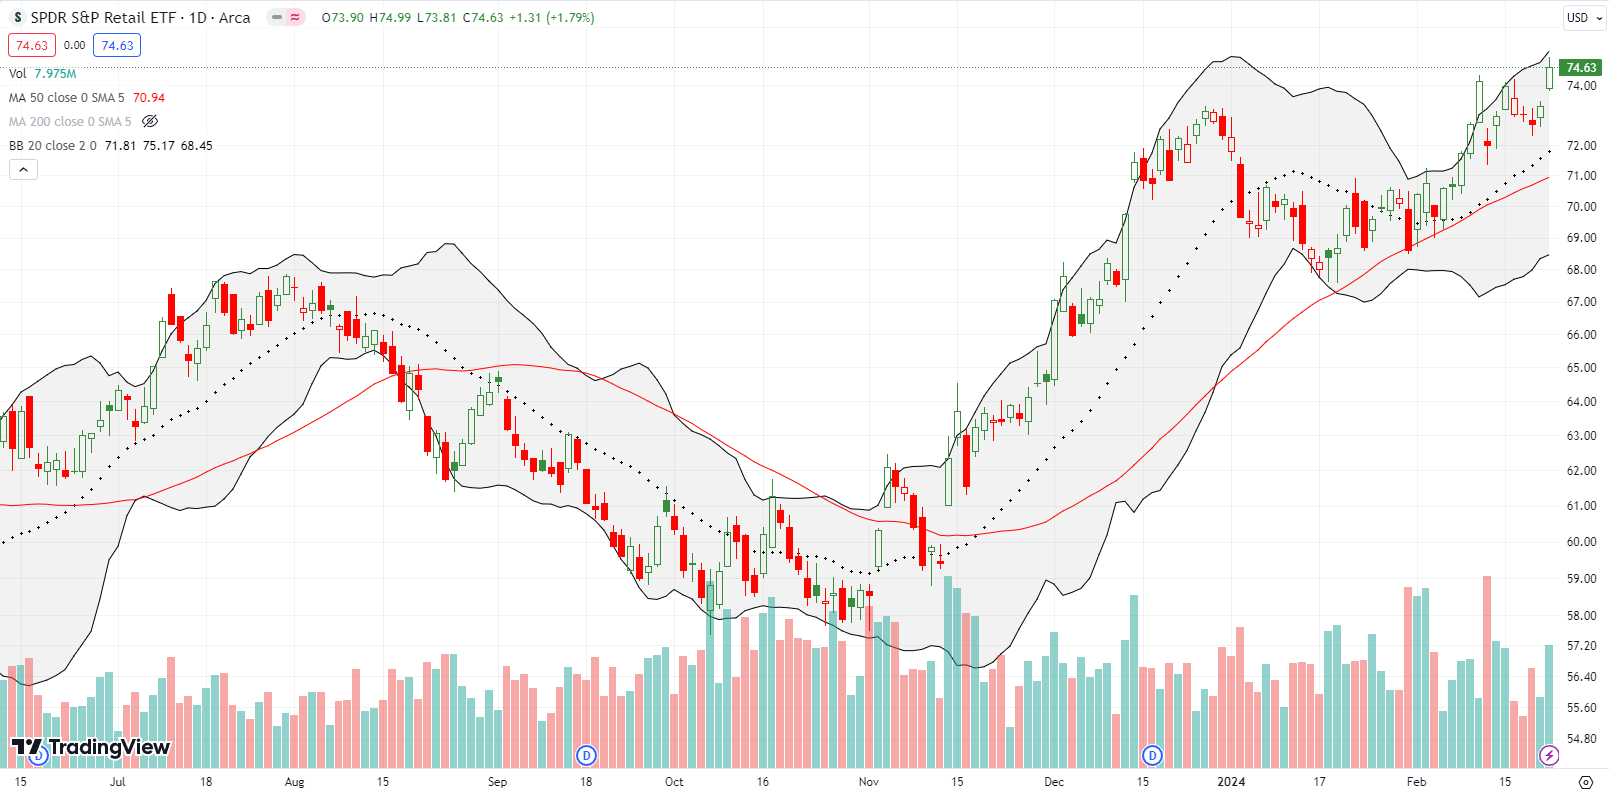
The biggest surprise breakout was not from the world of tech or rampant speculation. That honor goes to SPDR S&P Retail ETF (XRT). XRT has ground its way higher ever since a successful test of 50DMA support in late January. While the latest breakout move was only a 1.8% gain, it was enough to catch my attention. XRT helped convince me to change my short-term trading call.
With XRT in a very bullish position, I bought an XRT call spread.
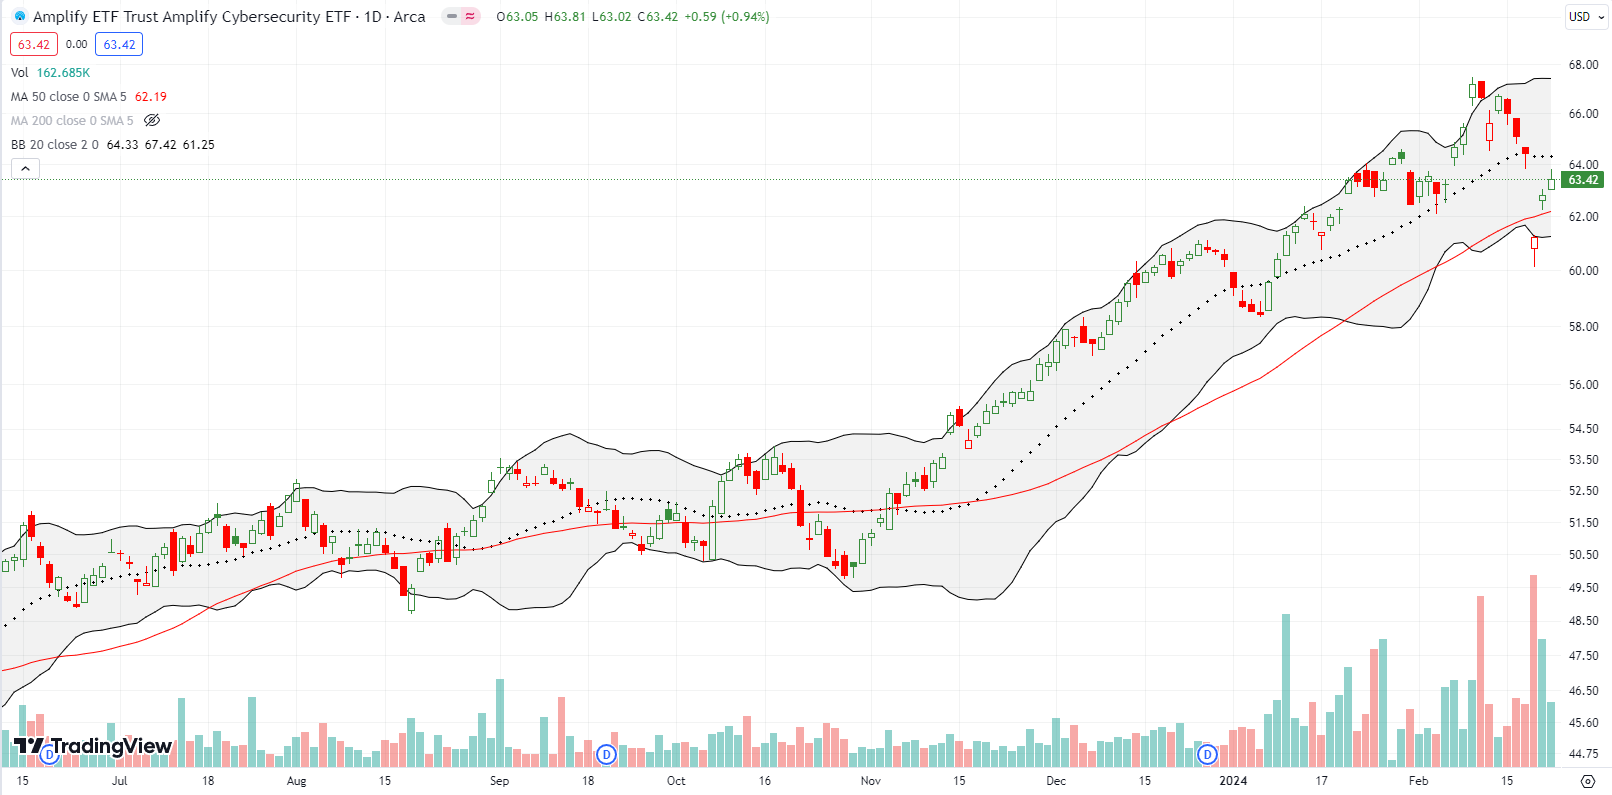
Cybersecurity software company Palo Alto Networks (PANW) cratered 28.4% post-earnings and closed at its intraday low on Wednesday. The collapse was a classic “be ready so you don’t have to get ready” shock. It even looked like another warning signal for tech. The plunge forced Amplify Cybersecurity ETF (HACK) into a 50DMA breakdown and 5.0% loss. Buyers regained their resolve the next day with a gap up over the 50DMA. The move left behind a bullish bottoming hammer pattern. I bought shares in HACK and PANW on Friday. On Friday, PANW cleared its day one post-earnings candle and closed at a post-earnings high.
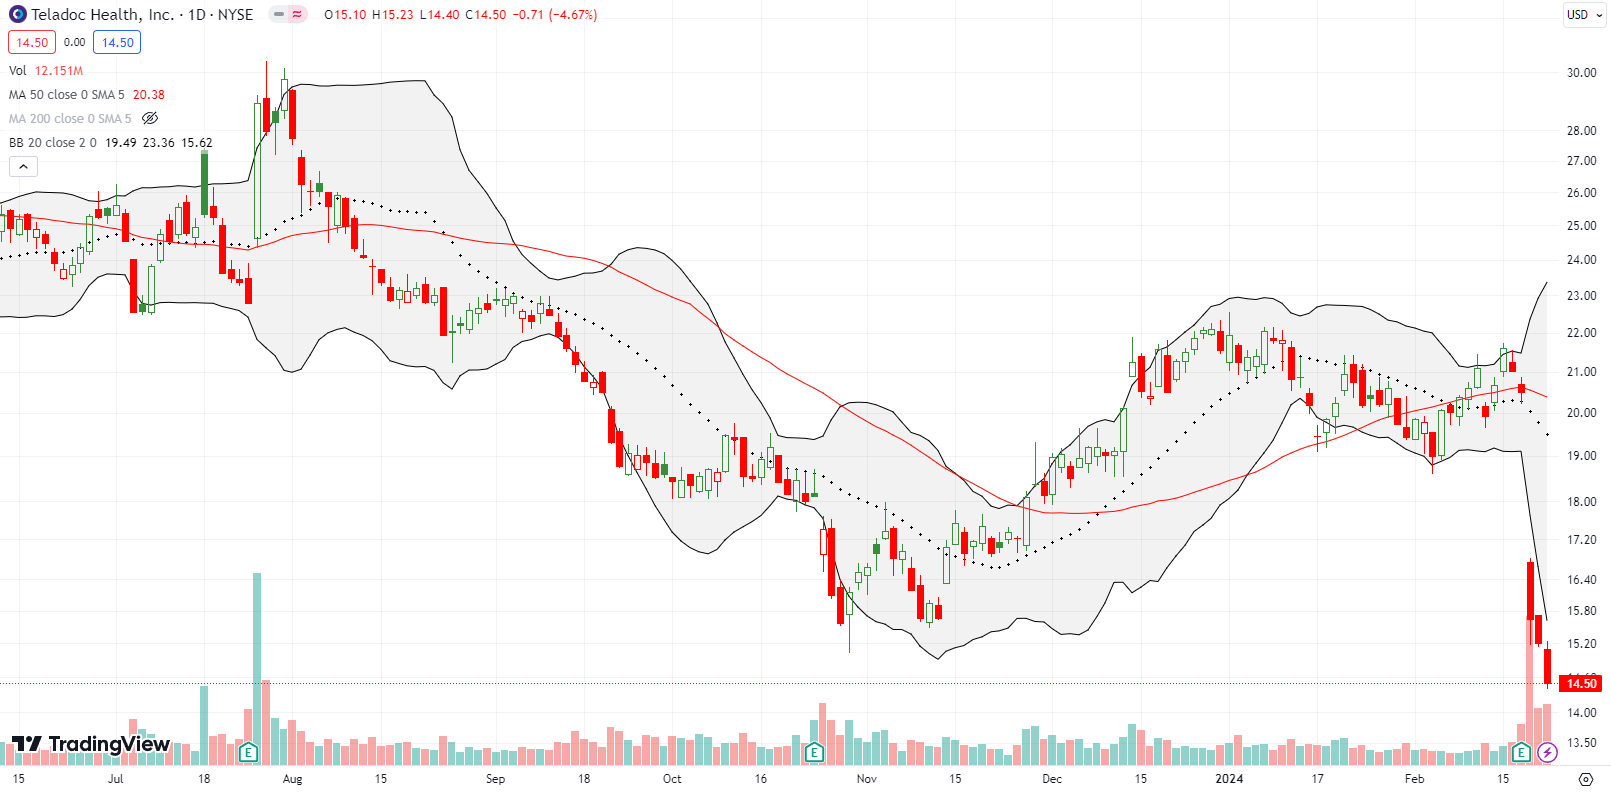
Teledoc Health, Inc (TDOC) is a bona fide disaster. My hopes from summer, 2023 for a bottoming pattern were shattered last week with a 23% post-earnings plunge. Sellers followed through right to Friday’s close and pounded TDOC back to levels last seen in 2016. I will concede defeat on this one. I will not look back until/unless TDOC closes above its post-earnings intraday high.
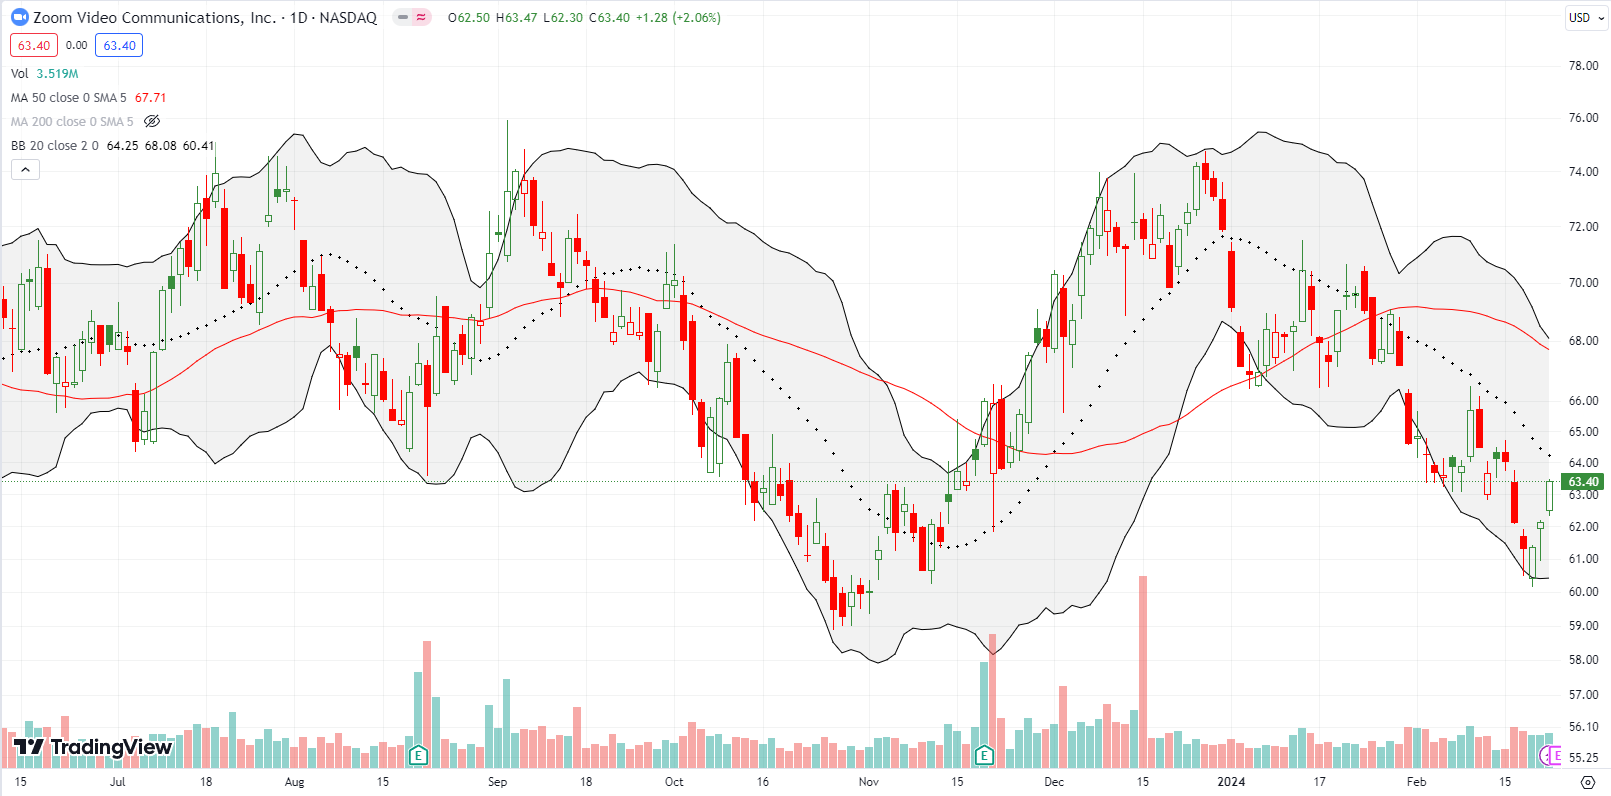
What is wrong with Zoom Video Communications (ZM)? While the stock is a decent rangebound trade, I am surprised ZM never caught fire with other speculative stocks. ZM is down significantly for the year and has enjoyed only small bursts of buying along the way down. Perhaps ZM will never reinvent itself enough to create sufficient distance from growing and improving competition in teleconferencing products? Meanwhile, the valuation is actually a reasonable 13.9 forward P/E and 4.3 times sales.
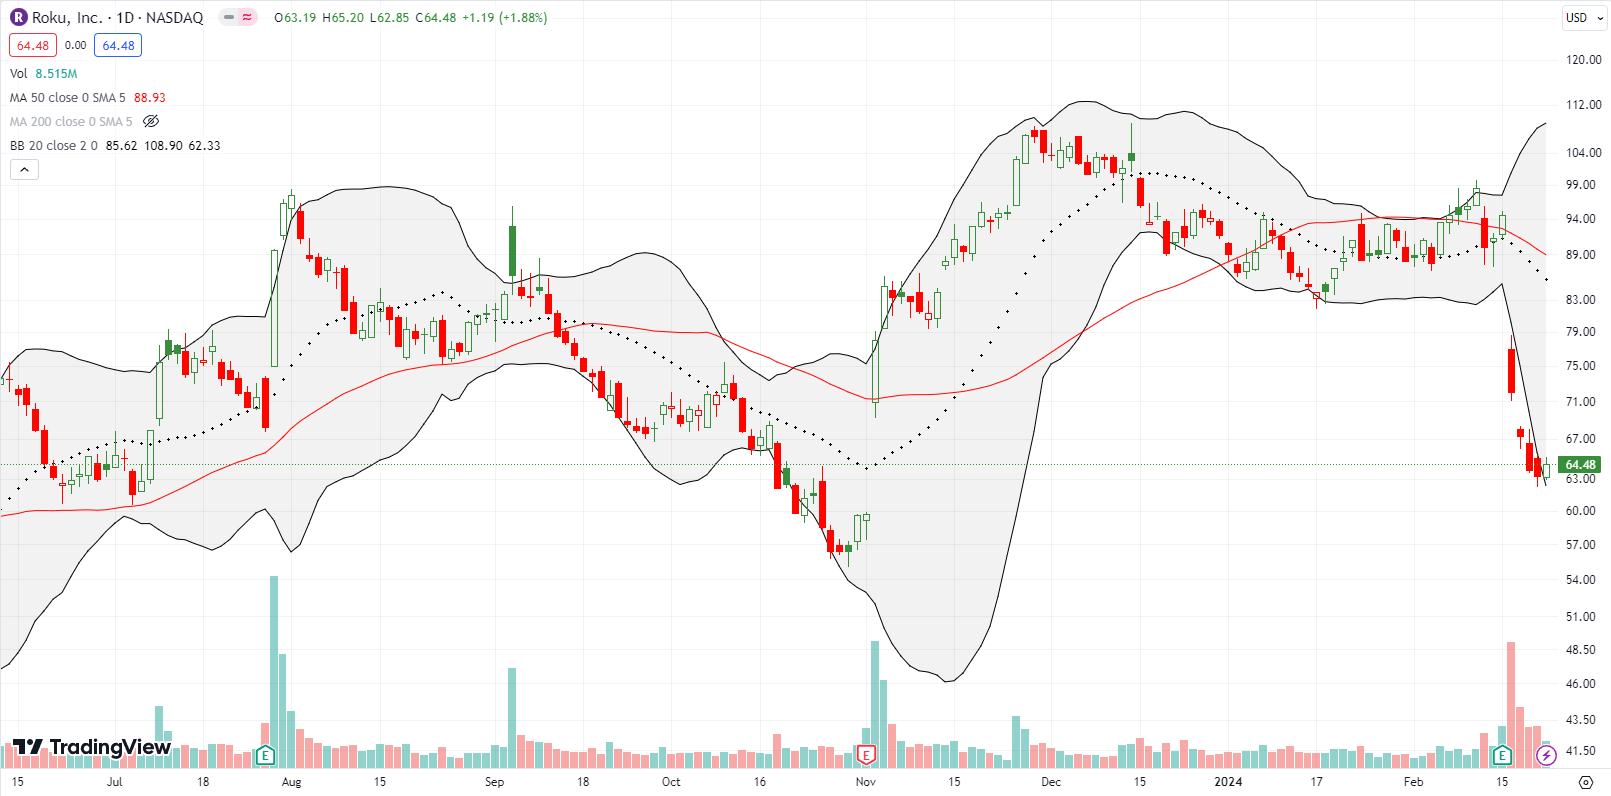
Roku, Inc (ROKU) ended the previous week with a 28.3% post-earnings collapse. Apparently, Roku reported good earnings but not good enough. The move left behind resistance at its 50DMA and seemed to confirm an imminent end to high-flying speculative trades. Sellers continued hitting ROKU until a slight respite on Friday. Until that point, I thought ROKU would quickly finish reversing all of its post-earnings gain from November.
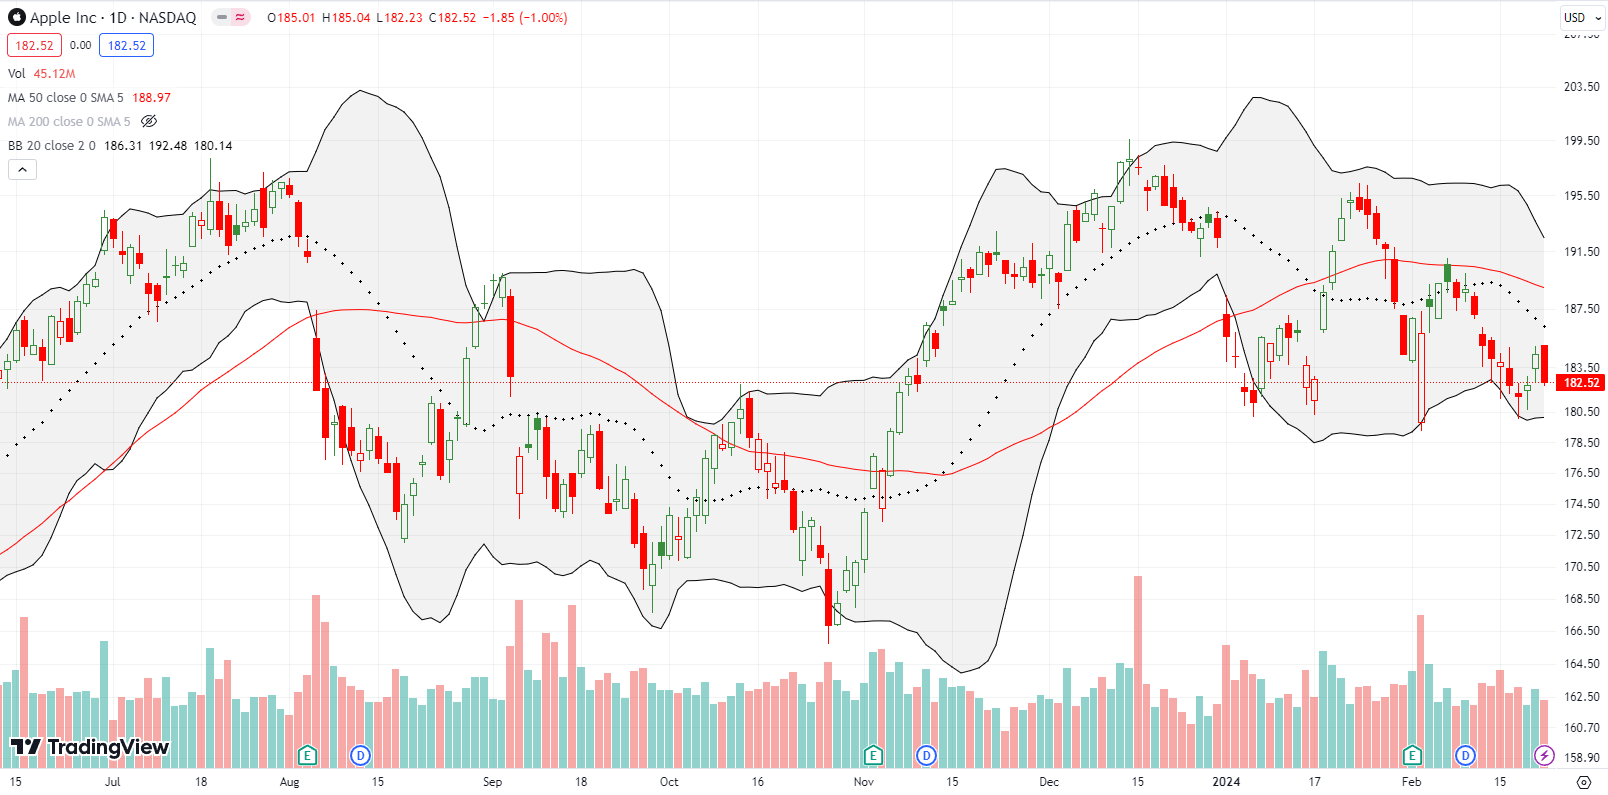
Apple Inc (AAPL) is a lost steward this year. While all hail NVIDIA, AAPL looks like an exhausted star with negative year-to-date performance. Buyers attempted a spirited rebound from this month’s large post-earnings gap down. Unfortunately, the buyers were quickly stymied by 50DMA resistance. AAPL has languished ever since. AAPL’s decline of 1.0% on Friday was a telling confirmation of underperformance. A close below the post-earnings intraday low will be deeply bearish for AAPL.
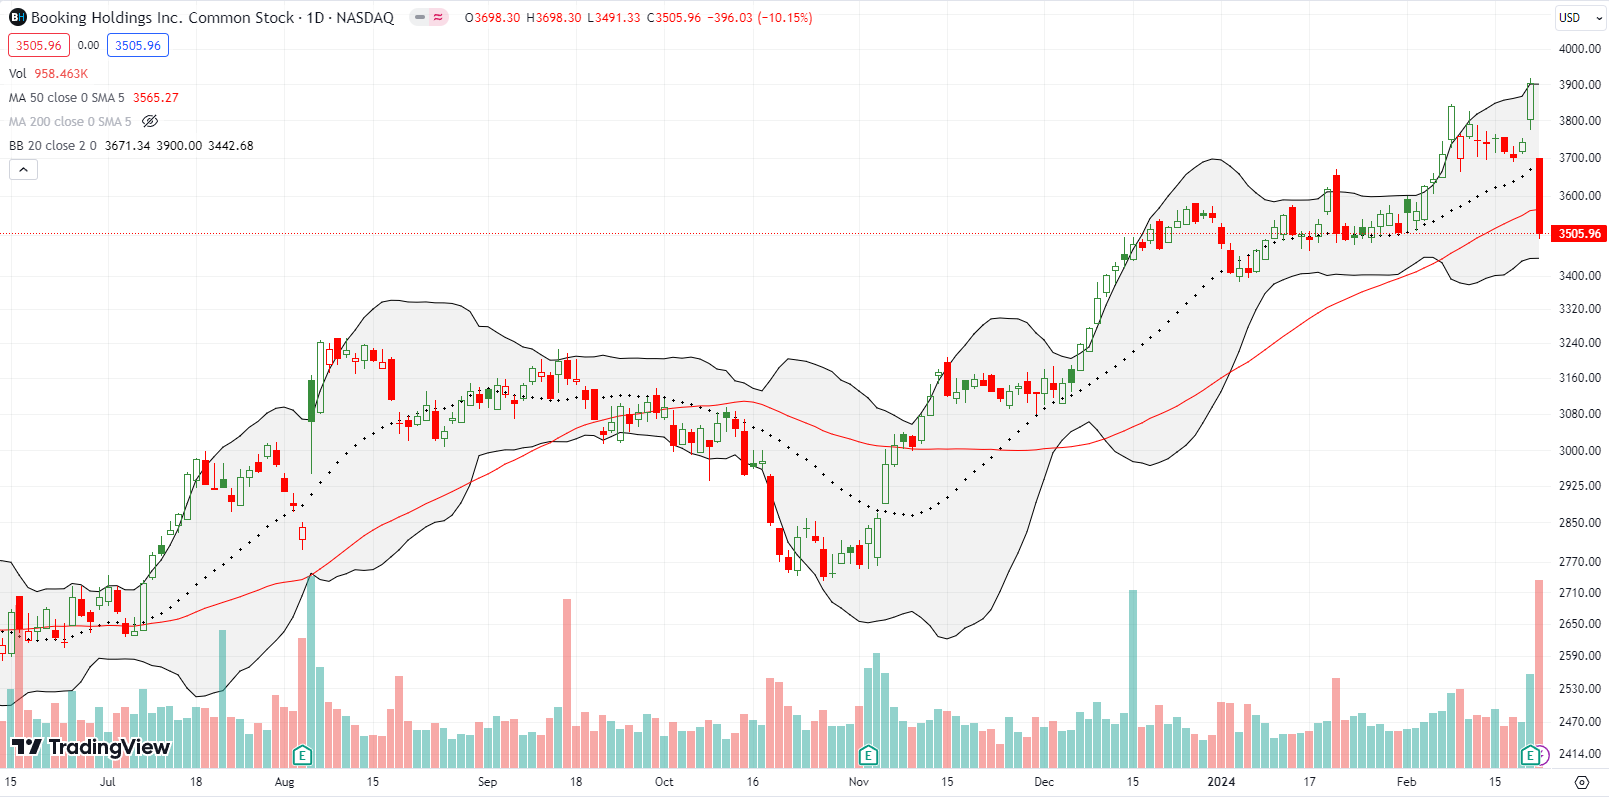
Travel reservations company Booking Holdings Inc (BKNG) rallied into earnings including a 4.3% gain and breakout to a fresh all-time high. BKNG proceeded to deliver a 50DMA breakdown and a 10% post-earnings loss. The plunge wiped out all of 2024’s gains. A second close lower would confirms a new bearish cycle for BKNG.
Be careful out there!
Footnotes
Subscribe for free to get email notifications of future posts!
“Above the 50” (AT50) uses the percentage of stocks trading above their respective 50-day moving averages (DMAs) to measure breadth in the stock market. Breadth defines the distribution of participation in a rally or sell-off. As a result, AT50 identifies extremes in market sentiment that are likely to reverse. Above the 50 is my alternative name for “MMFI” which is a symbol TradingView.com and other chart vendors use for this breadth indicator. Learn more about AT50 on my Market Breadth Resource Page. AT200, or MMTH, measures the percentage of stocks trading above their respective 200DMAs.
Active AT50 (MMFI) periods: Day #63 over 20%, Day #61 over 30%, Day #59 over 40%, Day #7 over 50% (overperiod), Day #19 under 60%, Day #30 under 70%
Source for charts unless otherwise noted: TradingView.com
Full disclosure: long IWM call spread, long XRT call spread, long HACK, long PANW, long TDOC,
FOLLOW Dr. Duru’s commentary on financial markets via StockTwits, Twitter, and even Instagram!
*Charting notes: Stock prices are not adjusted for dividends. Candlestick charts use hollow bodies: open candles indicate a close higher than the open, filled candles indicate an open higher than the close.

I totally agree with your Short Term Trading Call of “Skeptical”.
The SPX has gone up 1000 points since October 27. It’s hard to believe this can be supported…
But the trend is there.
And arguing against the trend is like yelling at the wind!