Stock Market Commentary:
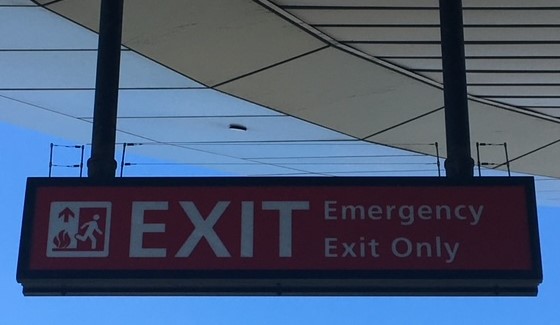
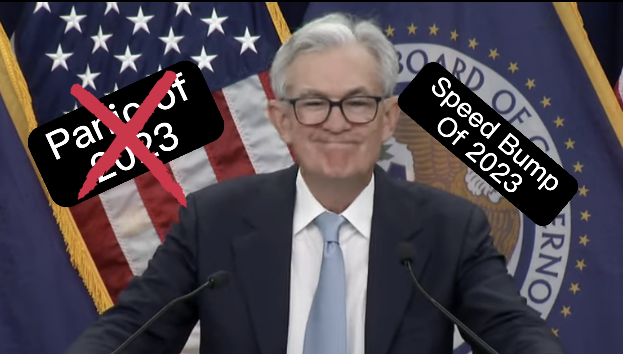
The Federal Reserve was an anti-climactic headliner last week. The Fed proceeded with a 25 basis points rate hike couched in words that suggested that inflation remained the Fed’s biggest concern. In the Q&A portion of the press conference, Chair Jerome Powell essentially downgraded the Panic of 2023 to the Speed Bump of 2023: “These are not weaknesses that are at all broadly through the banking system. This was a bank that was an outlier in terms of both its percentage of uninsured deposits and in terms of its holdings of duration risk.” Powell even dismissed the notion that commercial real estate loans will be the next domino to fall in the banking system: “we’re well-aware of the concentrations people have in commercial real estate, I really don’t think it’s comparable to this. The banking system is strong, it is sound, it is resilient, it’s well-capitalized…” Post-Fed sellers had different thoughts and looked toward the emergency exit while the market teased oversold conditions.
The stock market went from giddy buying in anticipation of Powell’s reassurances to selling in disappointment. Tech stocks saved the week from going into the red despite a 1-day drop into oversold trading conditions. Financials faced renewed downward pressure. The divergent market means that bulls and bears can create different but good enough narratives of the trading action. Who knows when a true resolution will come, but the stakes will be exceptionally high when banks start reporting earnings in a few weeks!
The Stock Market Indices
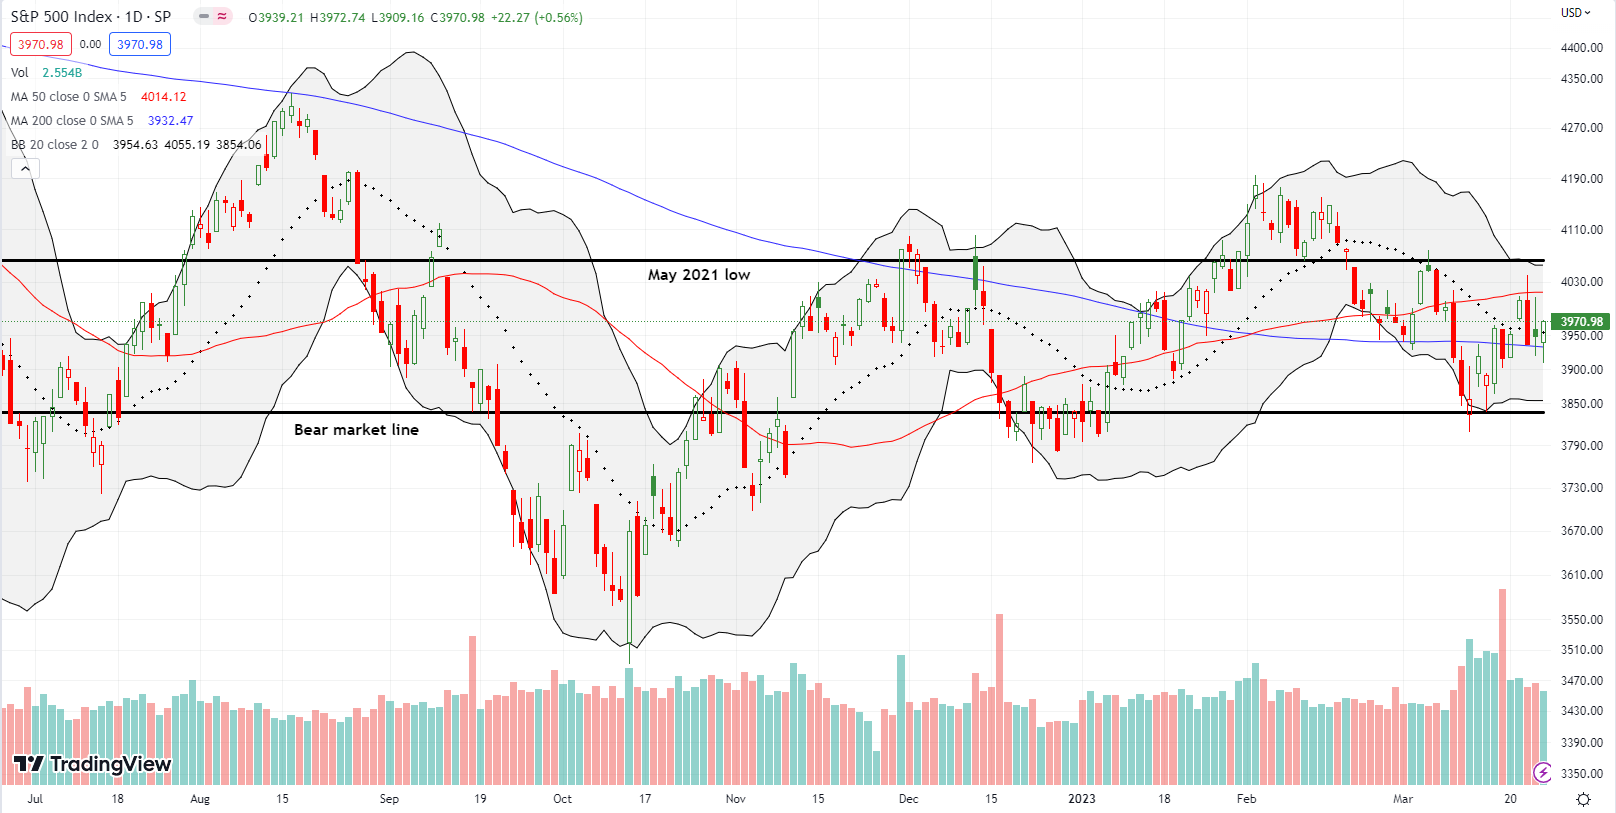
The S&P 500 (SPY) bounced from headline to headline all week. Important lines of technical support and resistance constrained all the trading action. The index successfully defended support at its 200-day moving average (DMA) (the bluish line), but it failed three times at 50DMA (the red line) resistance. The end result was pivoting gyrations around the 20DMA (the dotted line). In other words, the bears and bulls are fighting a pitched battle that is a microcosm of the general trading range defined by the May 2021 low and the bear market line since last summer. I saw no opportunities to trade the index in all this churn. I want to buy on the next pullback to the bear market line.
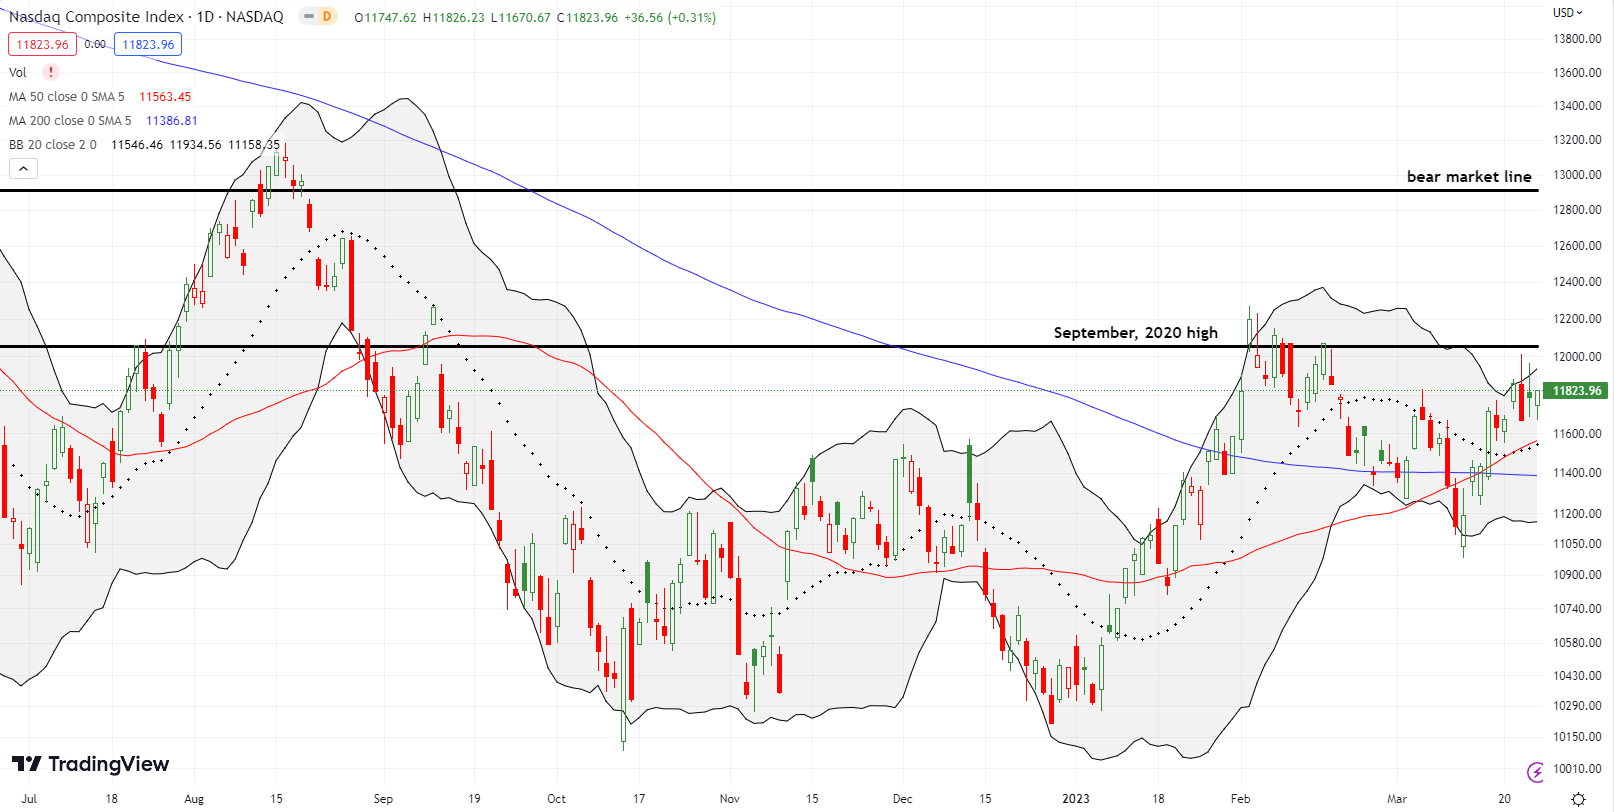
The NASDAQ (COMPQ) is actually in a bullish position since a big 50DMA breakout the previous week. Trading last week confirmed the breakout. Yet, the tech laden index faded from resistance at the September, 2020 high. Both bears and bulls have a lot left to prove.
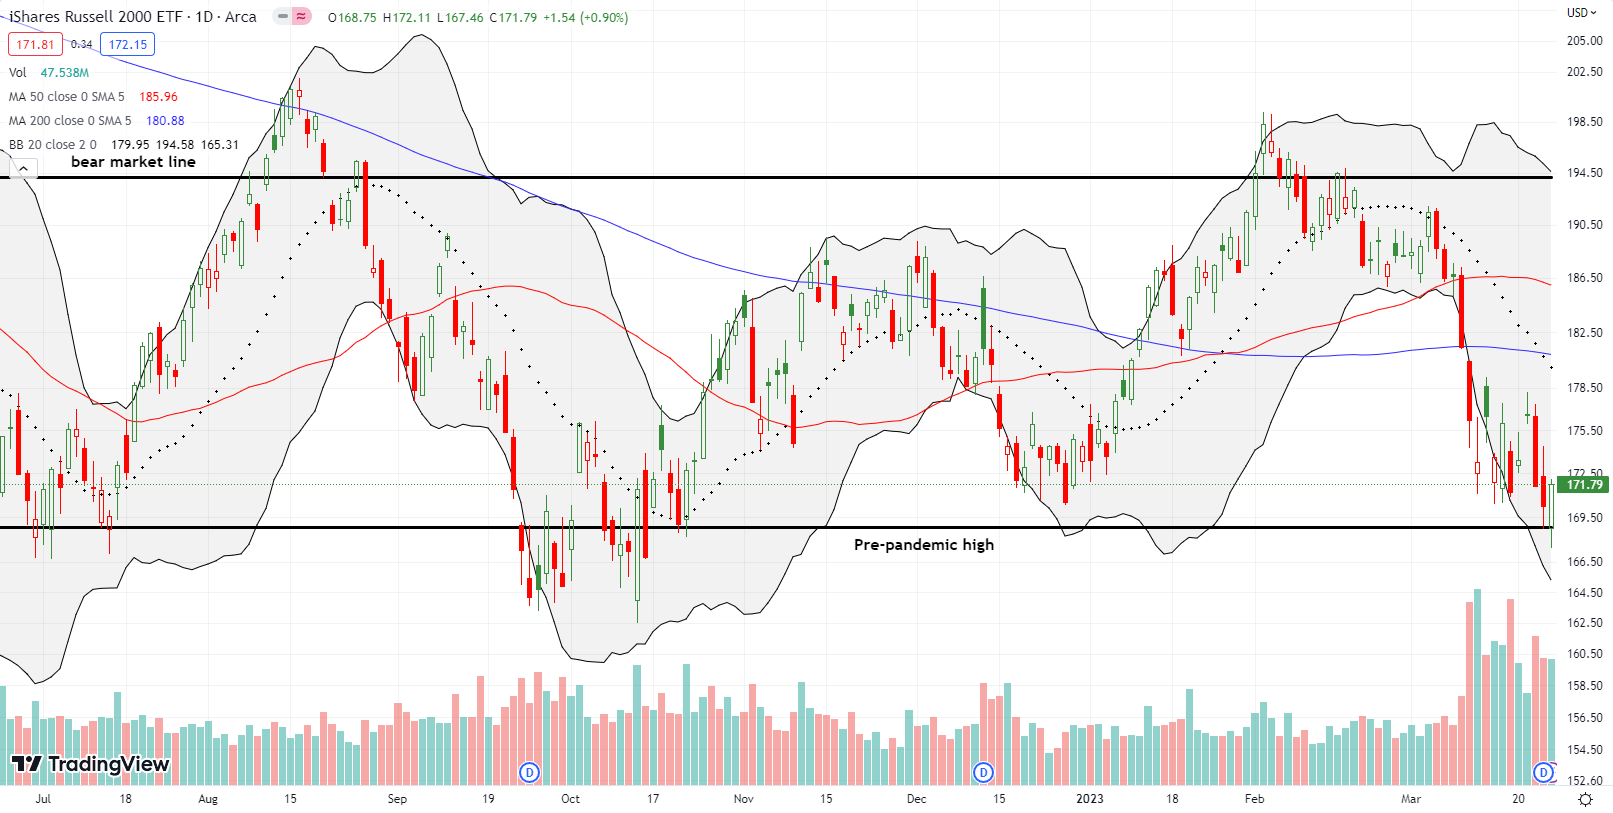
Sellers continued to focus their best efforts on the iShares Russell 2000 ETF (IWM). The emergency exit for the ETF of small caps sits at the pre-pandemic high where buyers mounted a defense of this line as support the last two days. While IWM managed to close Friday and the week essentially flat, buyers and sellers took the ETF on a wild ride. A declining 20DMA is quickly going to force the issue: exit or breakout.
Stock Market Volatility
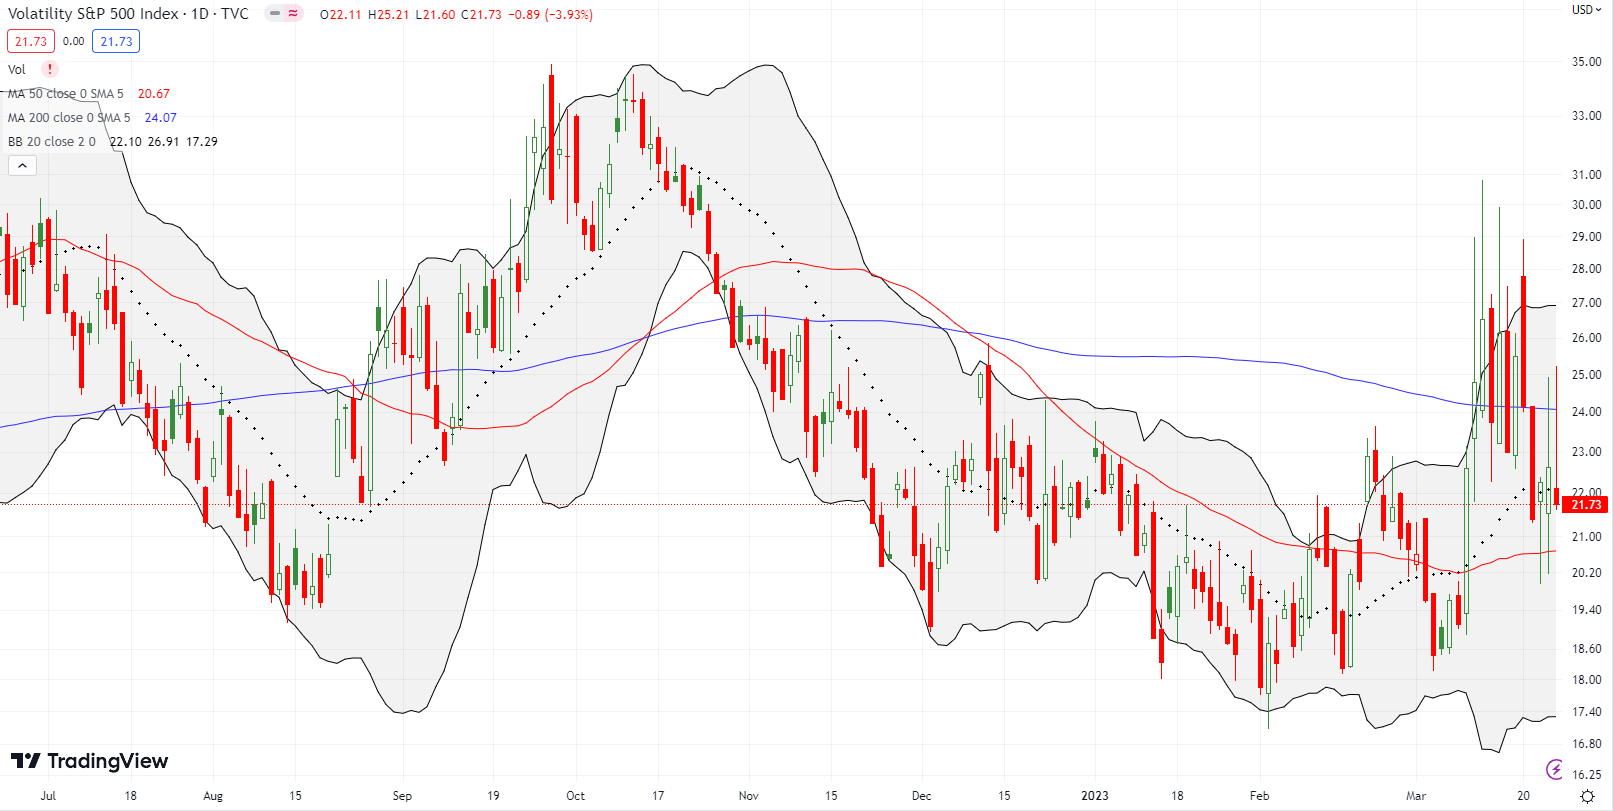
The volatility index (VIX) lost 14.8% for the week. While this looks like a victory for the bulls, the bears managed to defend the critical 20 level. As a result, the VIX remains elevated even as overall fear levels have come down significantly. Despite the headlines and a looming emergency exit, last week turned into a time of exhaustion and rest for fear.
The Short-Term Trading Call With An Emergency Exit Looming
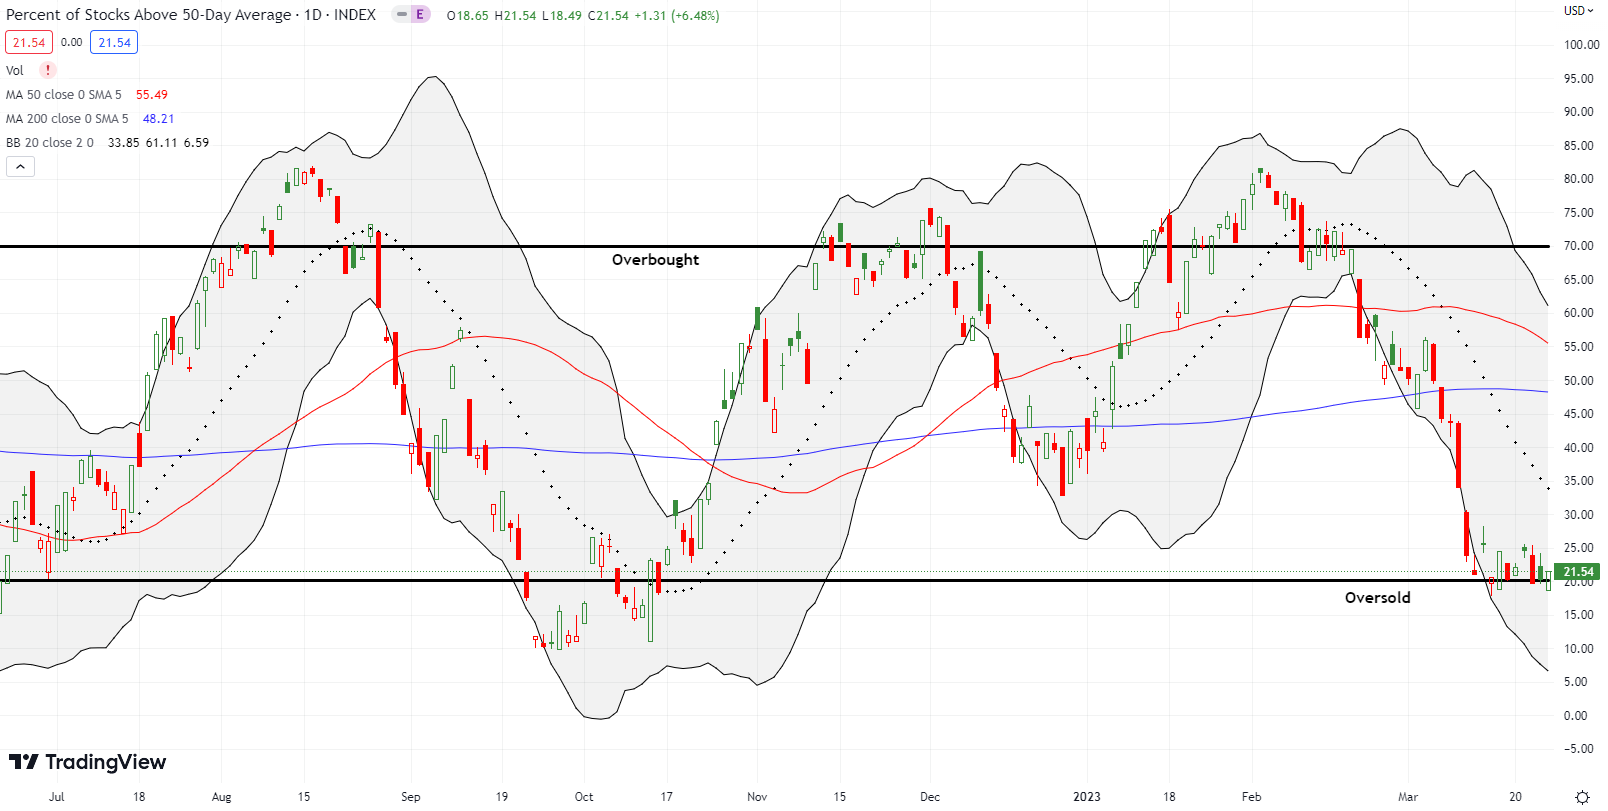
- AT50 (MMFI) = 21.5% of stocks are trading above their respective 50-day moving averages
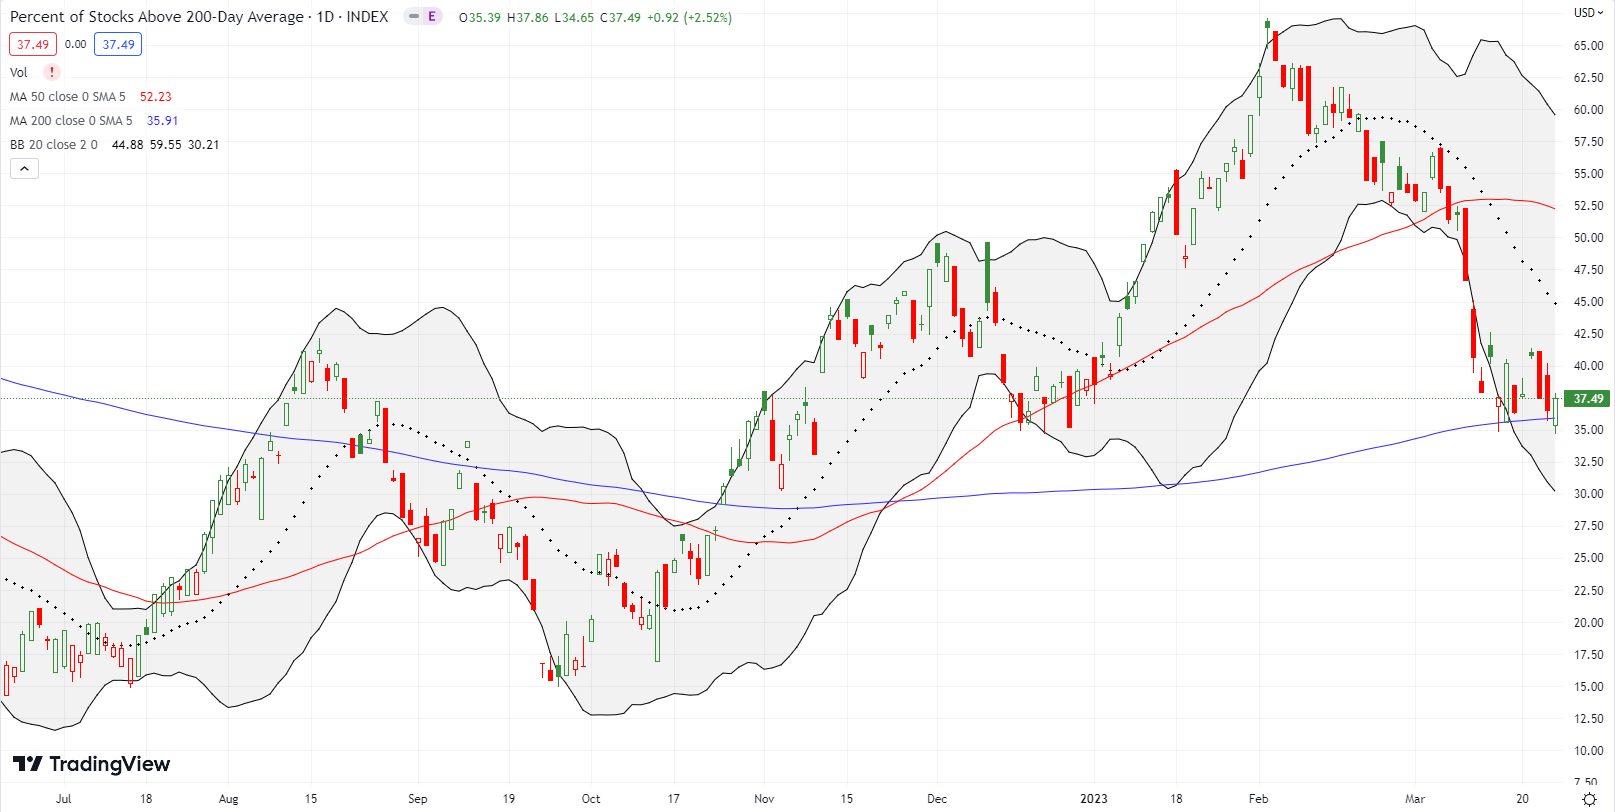
- AT200 (MMTH) = 37.5% of stocks are trading above their respective 200-day moving averages
- Short-term Trading Call: cautiously bullish
AT50 (MMFI), the percentage of stocks trading above their respective 50DMAs, managed last week to close once below the oversold threshold at 20%. That one-day trip into oversold territory was mostly noise. My favorite technical indicator has now meandered at or near the oversold threshold for 11 straight trading days. AT50 dropped to 23.9% the day the Feds shut down Silicon Valley Bank (SIVB). I am amazed that the market did not continue plunging into deep oversold territory from there. Instead, the stock market looks like it is teetering at the 20% threshold like an emergency exit looming. Once the flight to “safety” in high-tech finally comes to an end, I fully expect traders to use this emergency exit. As a reminder, the short-term trading call is cautiously bullish given the market is “close enough” to oversold, and I want to be mentally prepared to buy dips from current levels.
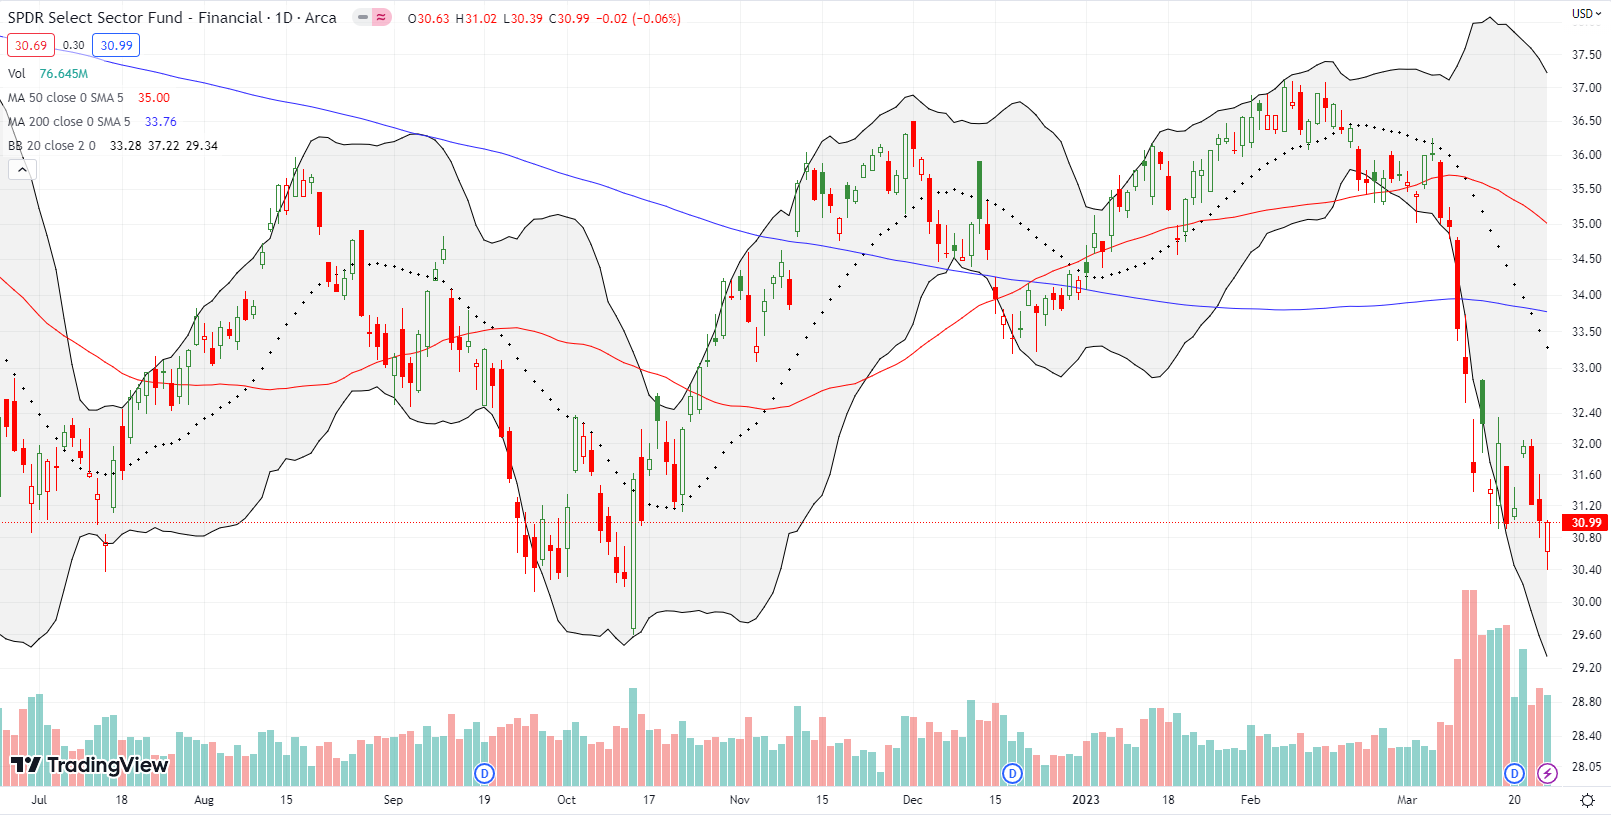
Financials are of course the main weight on the market. The Financial Select Sector SPDR Fund (XLF) fought hard to hold the $31 level. That apparent support finally gave way on Friday. However, buyers stepped in after XLF tested the October lows. I think the victory that closed XLF flat on the day is a temporary one. I stopped looking for “bargains” within the wreckage of financial stocks, especially the regional banks. The still unfolding drama includes too many echoes from the Financial Crisis of 2008 to 2009.
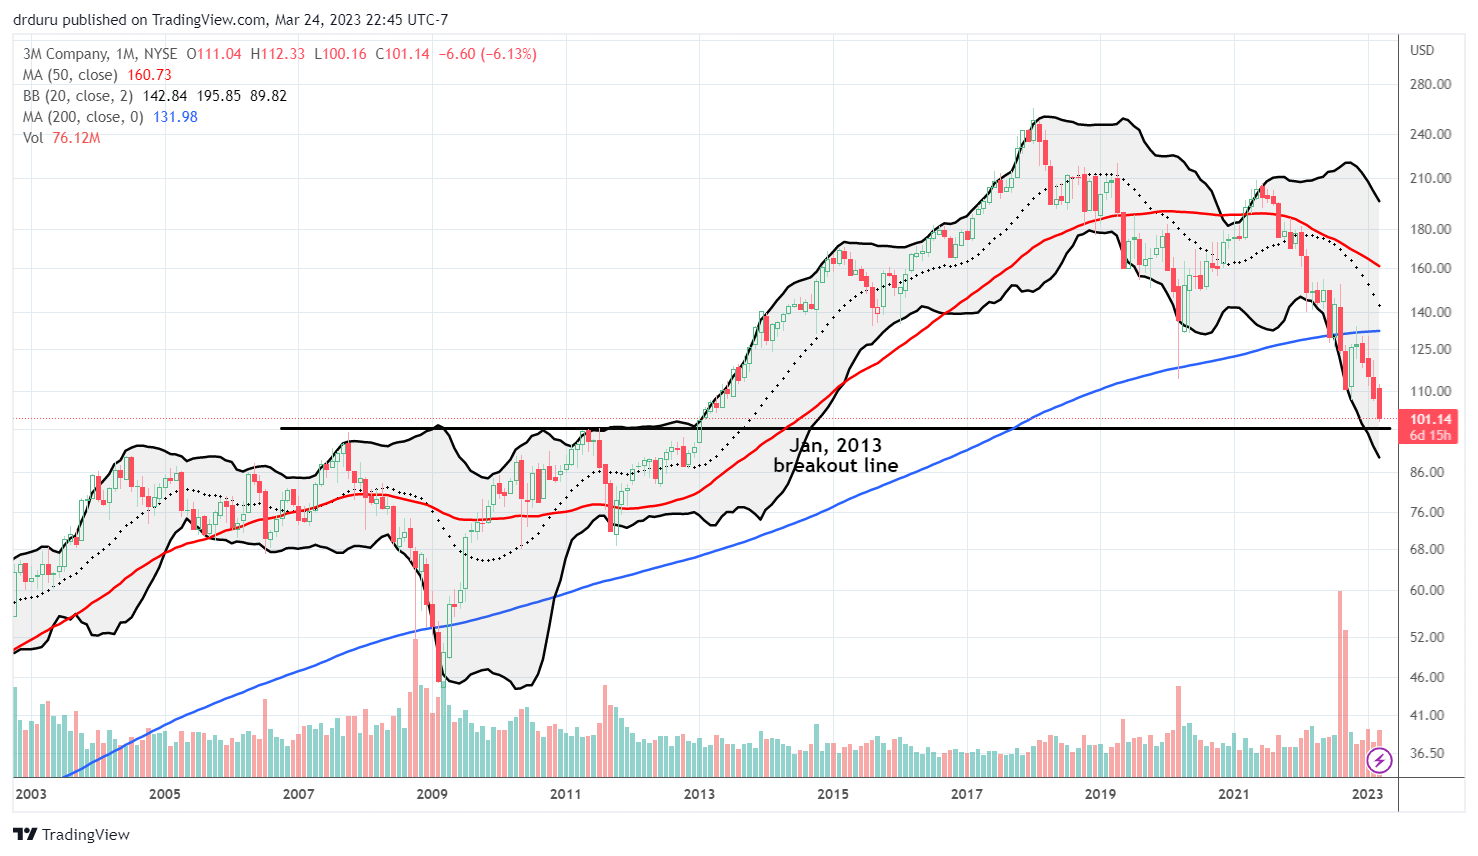
The 3M Company (MMM) seemed like one of many obvious investments in the wake of the pandemic. The country scrambled to get masks and other medical equipment and accessories that 3M provides. Yet, the rally in MMM fell far short of its 2017 all-time high. That failure should have been a cue to flip my attitude from bullish to bearish. The monthly chart below shows MMM has sold off almost every single month since the 2021 highs. It is quite a streak of losing that I noticed most acutely after looking at this long-term chart.
I put MMM on my long-term shelf where I do not actively manage positions. Now, MMM has almost reversed all its gains from an important 2013 breakout. This is a surprising display of woe from a treasured industrial name. I still might add shares if MMM shows signs of stabilization at support. The stock’s dividend is now a juicy 5.9%…of course, a dividend cut would be the final confirmation that the company is in some kind of secular funk and decline.
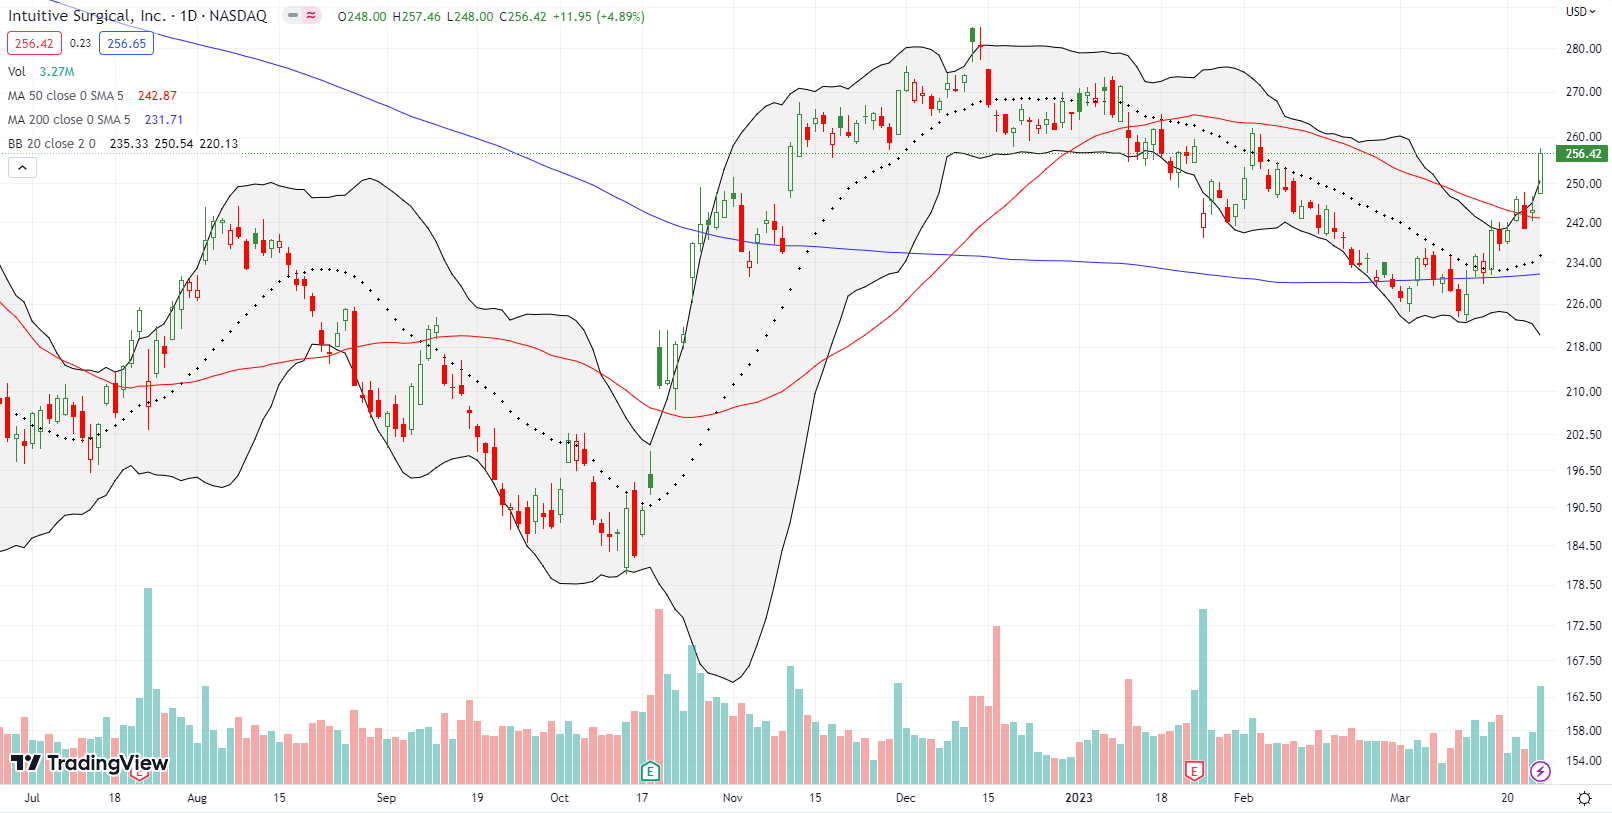
My interest in buying into oversold conditions has shifted from sources of weakness to places of strength. Intuitive Surgical, Inc (ISRG) flashed on my radar as an ideal candidate. An analyst initiated ISRG at outperform on Thursday. That point was a perfect buying opportunity as ISRG hovered over 50DMA support. Now the stock is over-extended above its upper Bollinger Band (BB); I need to wait for some cooling before diving back in. For the second time since earnings, ISRG has reversed its initial post-earnings loss from January. Yet one more example of how the market can be completely clueless about how to interpret fundamental news.
Be careful out there!
Footnotes
Subscribe for free to get email notifications of future posts!
“Above the 50” (AT50) uses the percentage of stocks trading above their respective 50-day moving averages (DMAs) to measure breadth in the stock market. Breadth defines the distribution of participation in a rally or sell-off. As a result, AT50 identifies extremes in market sentiment that are likely to reverse. Above the 50 is my alternative name for “MMFI” which is a symbol TradingView.com and other chart vendors use for this breadth indicator. Learn more about AT50 on my Market Breadth Resource Page. AT200, or MMTH, measures the percentage of stocks trading above their respective 200DMAs.
Active AT50 (MMFI) periods: Day #2 over 20% (overperiod), Day #11 under 30% (underperiod), Day #12 under 40%, Day #14 under 50%, Day #24 under 60%, Day #26 under 70%
Source for charts unless otherwise noted: TradingView.com
Full disclosure: long QQQ put spread, long IWM call spread, long VXX call spread, long MMM
FOLLOW Dr. Duru’s commentary on financial markets via StockTwits, Twitter, and even Instagram!
*Charting notes: Stock prices are not adjusted for dividends. Candlestick charts use hollow bodies: open candles indicate a close higher than the open, filled candles indicate an open higher than the close.

