Stock Market Commentary:
The Feds delivered on Sunday as Janet Yellen promised. The FDIC, the Treasury, and the Federal Reserve joined forces to offer emergency financial backing and reassurances for the banking system, a kind of “Project Calm” to project calm. The Federal Reserve even came up with a new acronym that looks like a subtle hint: BTFD (Bank Term Funding Program aka Buy The F’ing Plunge) – BTFD could be my theme for 2023. Yet, inconsolable traders deepened the panic anyway at Monday’s open. Clearly, investors were not interested in hanging around to find out whether their favorite (regional) bank holdings would still need to dilute investors with equity raises. The news of sudden bank shutdowns that wiped out bond and equity holders likely undermined investor confidence even as depositors cheered.
With a serious case of deja vu from the Great Financial Crisis, I did my best to look past the panic and trigger the oversold trading rules. Fortunately, the February CPI (Consumer Price Index) met “expectations” and helped deliver a modicum of calm today.
The President summarized the banking crisis and added his own reassurances (along with a strange inference that laws may have been broken).
The Stock Market Indices
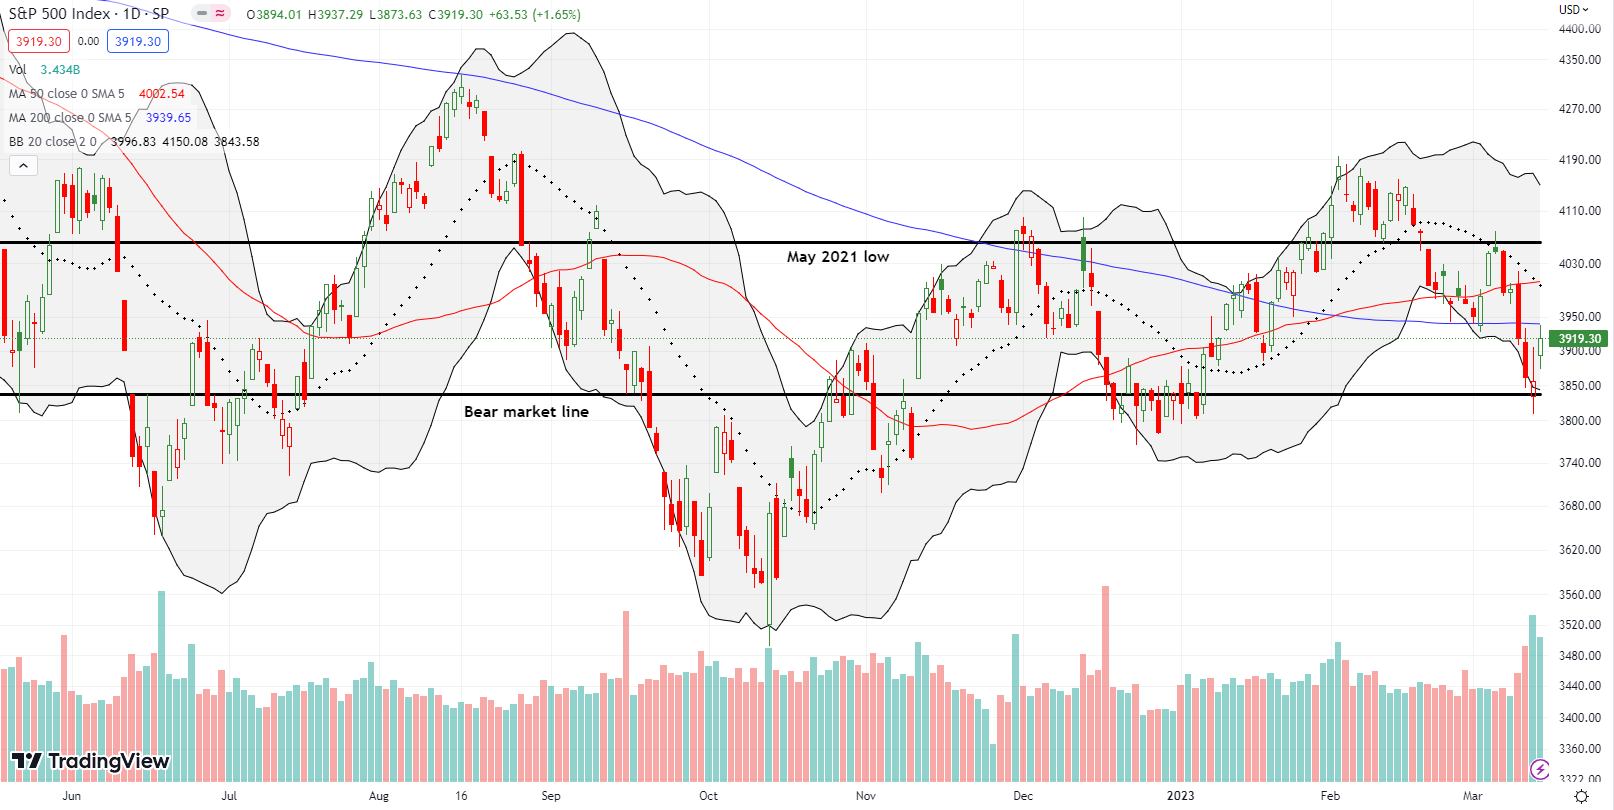
The S&P 500 (SPY) rediscovered familiar territory from the December lows. The index started the week piercing through its bear market line. Buyers put up a spirited defense and confirmed support with today’s 1.7% gain. Buyers now have to push through 200-day moving average (DMA) (the bluish line) resistance and stare down converged resistance at the 20DMA (dotted line) and the 50DMA (red line). My bet is on the layers of resistance holding firm until at least next week’s announcement on monetary policy. Project Calm should create a floor. Still, given my surprise at Monday’s lack of calm, I bought a SPY calendar put spread as a small hedge to my oversold buys.
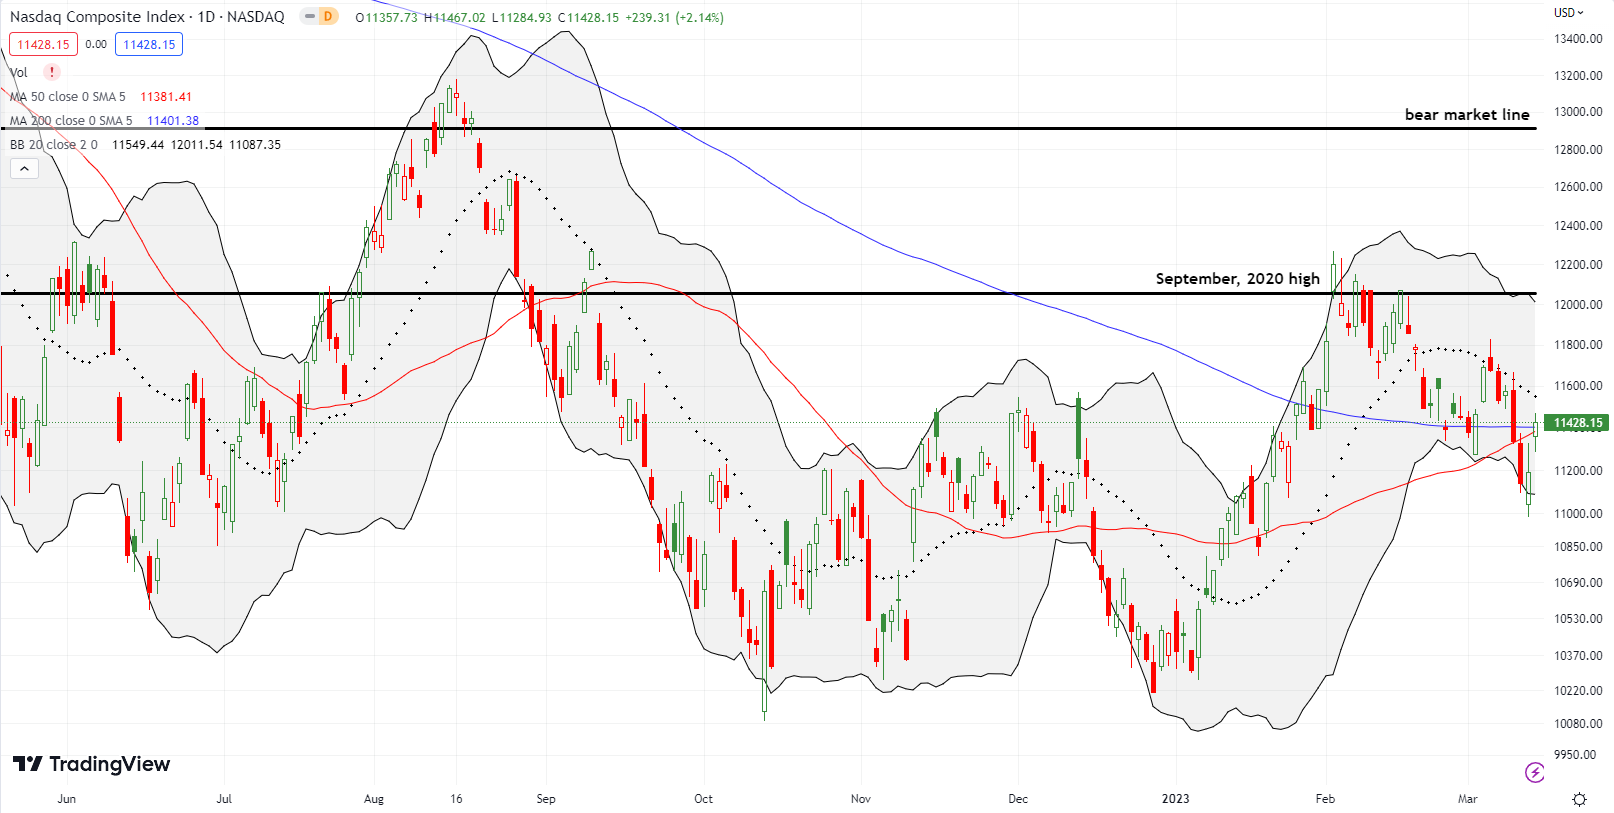
The NASDAQ (COMPQ) turned into an equity safe haven in the wake of bank failures and financial uncertainty. Big cap tech provided some calm and a port in the storm. Accordingly, the tech laden index managed a 0.5% gain to start the week and then a 2.1% gain today. The NASDAQ even peeked over converged resistance at its 50DMA and 200DMA. The down trending 20DMA resistance looms large all over again.
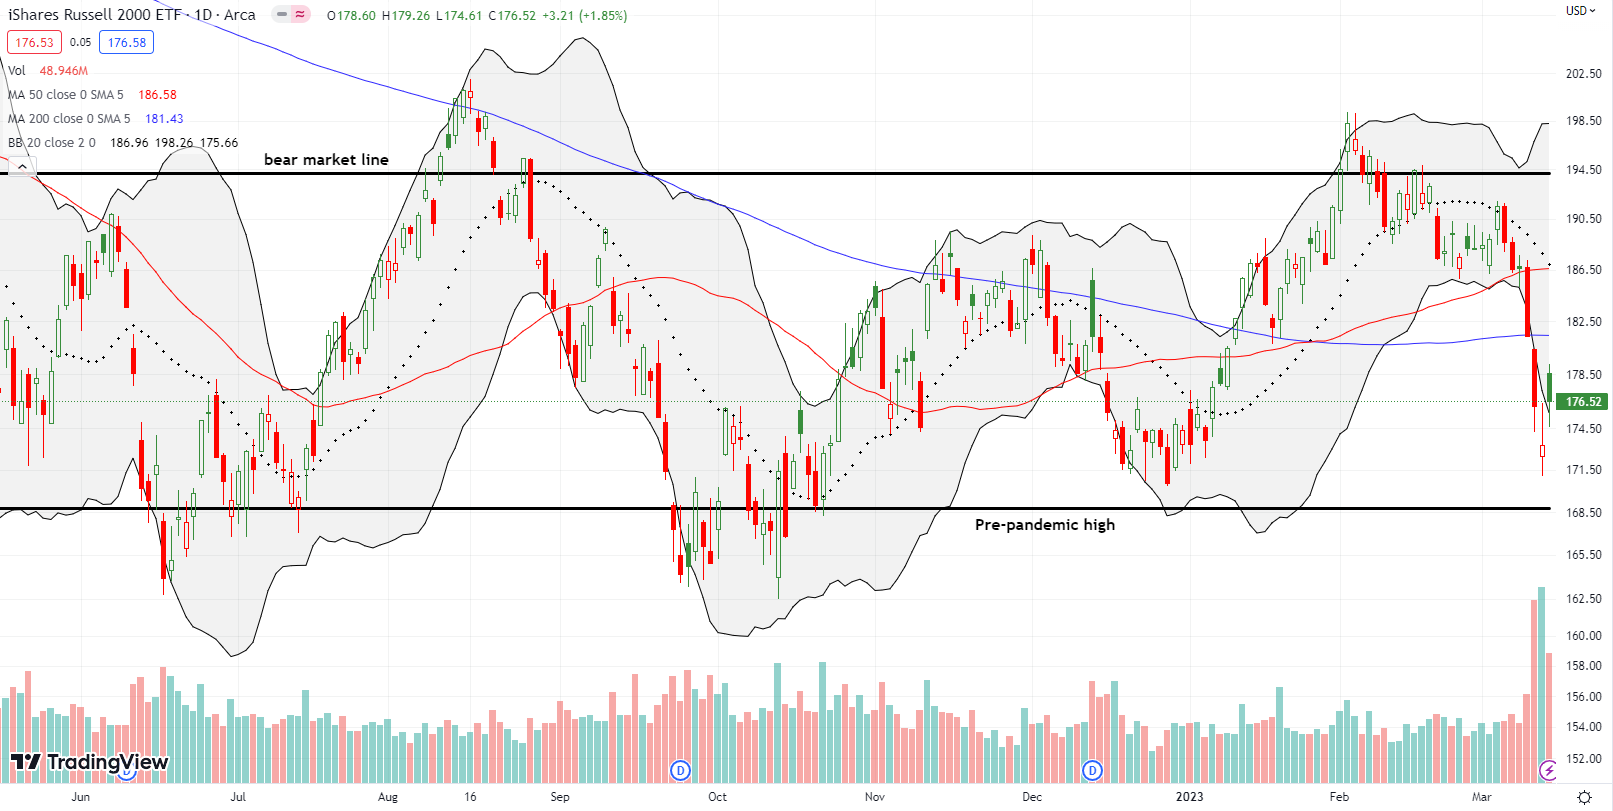
The iShares Russell 2000 ETF (IWM) lagged given regional bank issues weigh heavily on smaller companies. IWM opened the week down 1.6% but stopped well short of support at the pre-pandemic high. I bought two sets of call spreads into the thick of the panic which itself was the third straight day of selling. I took profits on the calendar call spread and held the April 175/180 call spread with IWM finishing the day with a 1.9% gain.
Stock Market Volatility
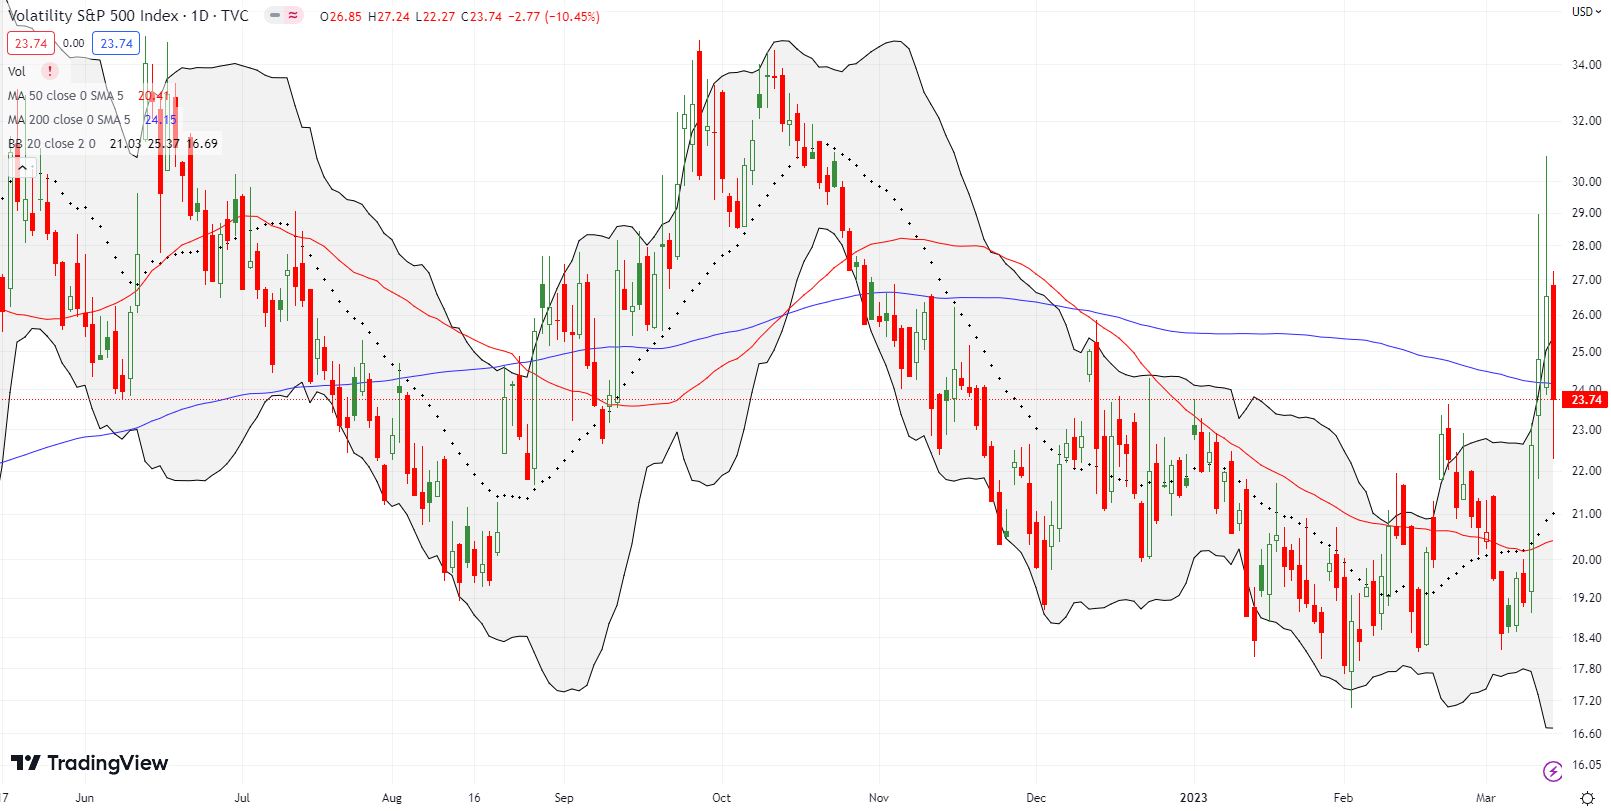
At the end of last week, I guessed that “the VIX may finally have all the conditions needed to sustain an uptrend that lasts more than a few days.” The volatility index ended last week with a 9.7% gain but was up as high as 31.7%. The VIX faders stepped into the fray Monday and Tuesday as well. On Monday, the VIX was forced off a 5-month high and settled for a 6.9% gain. The faders had almost full control today with the VIX losing 10.5%. The VIX is still in breakout territory and could hold above 20 for a while longer, but it looks topped out with a classic exhaustion of fear.
The Short-Term Trading Call With Project Calm
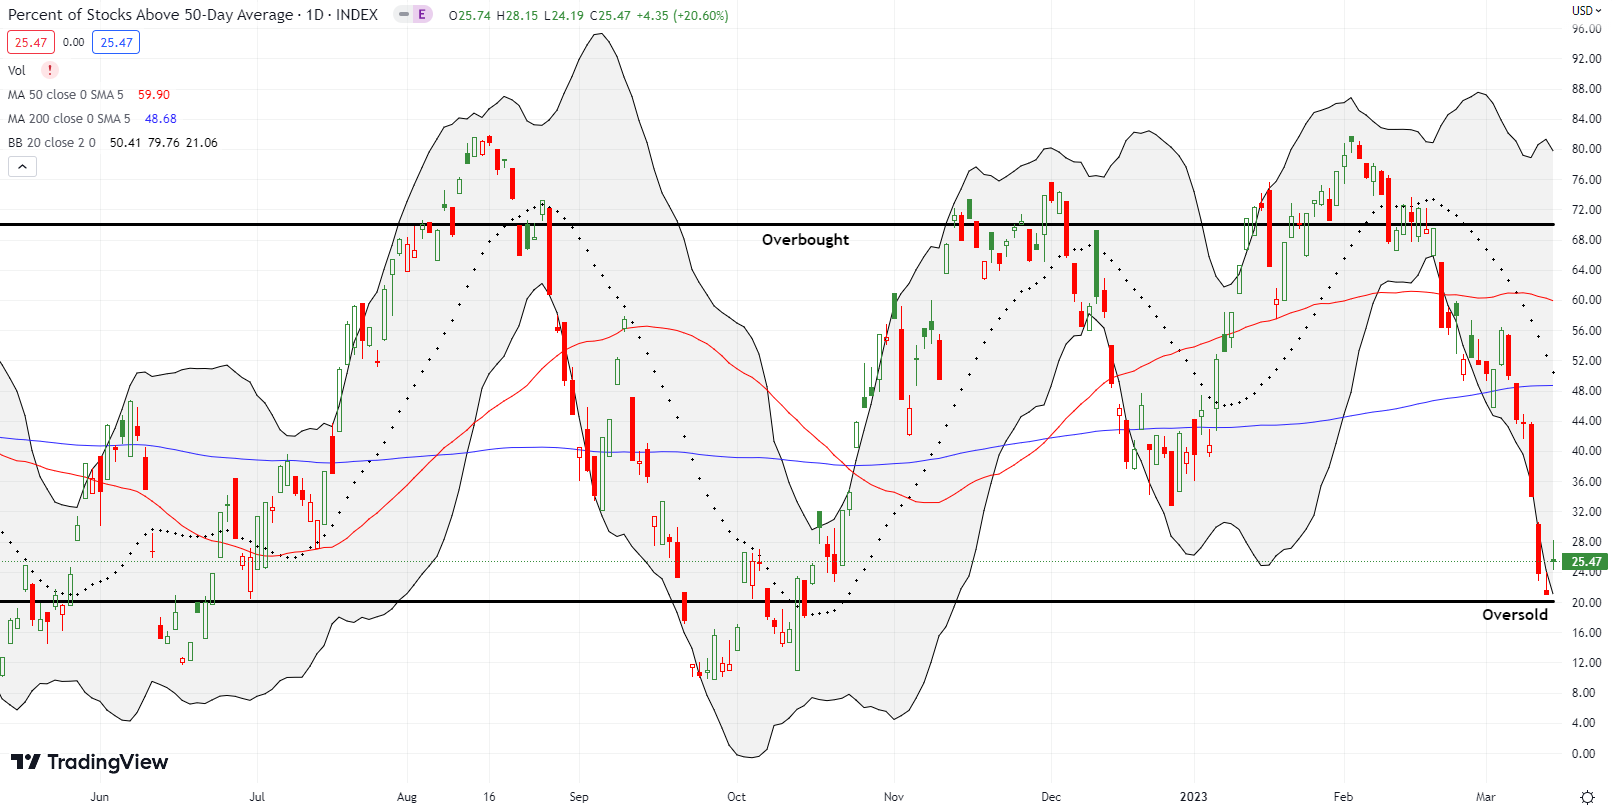
- AT50 (MMFI) = 25.5% of stocks are trading above their respective 50-day moving averages
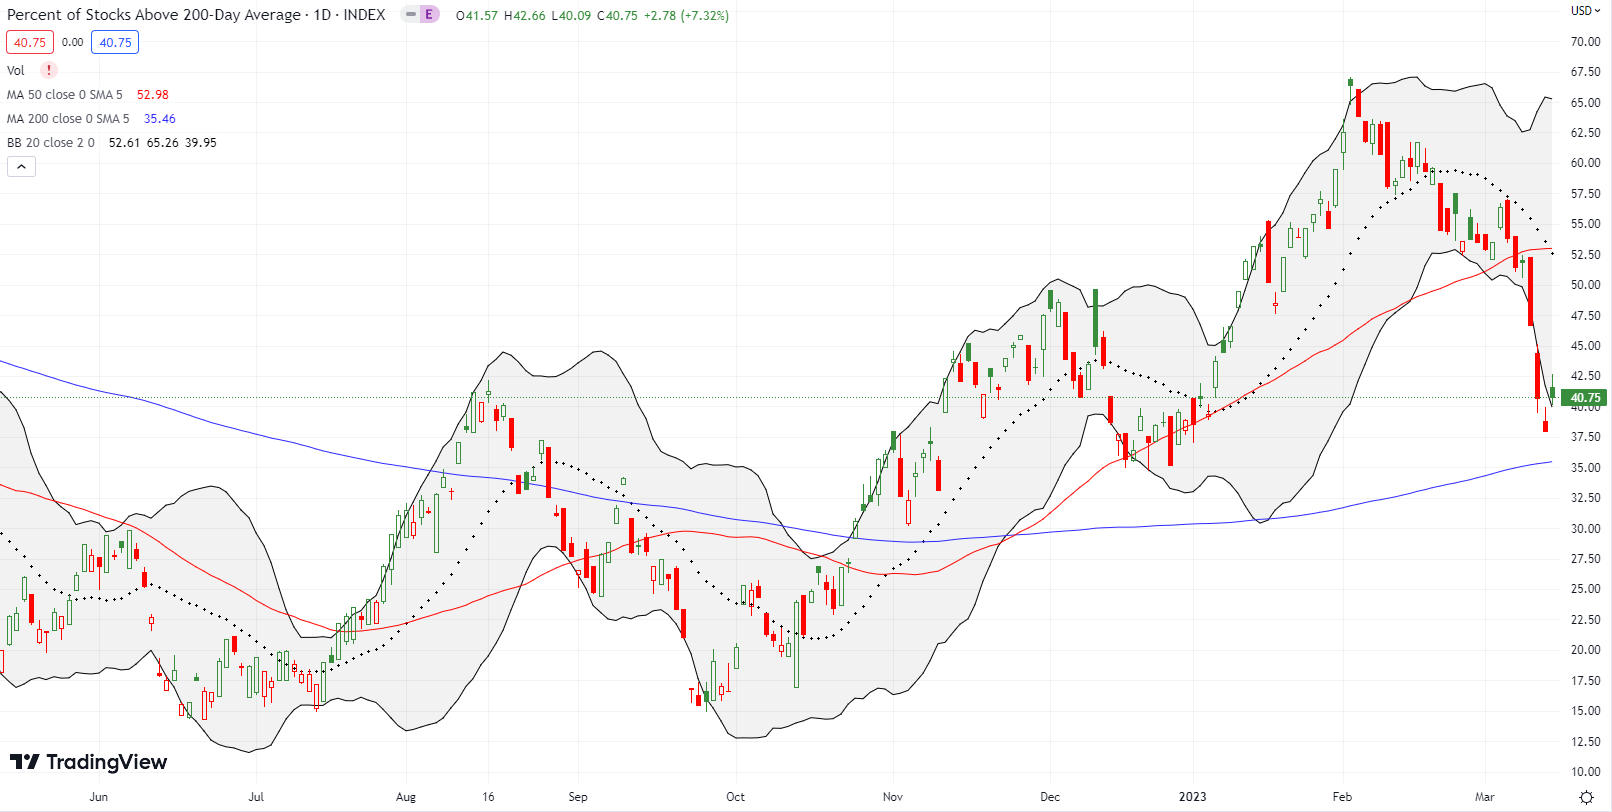
- AT200 (MMTH) = 40.8% of stocks are trading above their respective 200-day moving averages
- Short-term Trading Call: cautiously bullish
AT50 (MMFI), the percentage of stocks trading above their respective 50DMAs, stopped just short of the oversold threshold at 20%. The large spike in the VIX triggered my typical strategy for buying into oversold conditions. I went after the most stretched parts of the market: financials and small caps. Tuesday’s gap up at the open validated the oversold trading strategy. However, having lived through these episodes several times (I had specific flashbacks to the wild trading in 2008 in the throes of the Great Financial Crisis), I preferred to take immediate profits. I flipped call spreads in The Charles Schwab Corporation (SCHW), IWM, Tesla (TSLA) and shares in KRE (see below). I held on to April call spreads in IWM and XLF.
While AT50 did not officially dip into oversold territory, it certainly got close enough, especially given the large spike in the VIX. Today’s VIX plunge convinced me to switch the short-term trading call to cautiously bullish from neutral. I fully recognize the hazards of overhead resistance, but I want to be mentally ready to buy dips going forward. I particularly want to be mentally ready for a potential rally after next week’s Fed meeting where I expect the Fed to pause rate hikes and talk more soothing words to the financial markets (watch out if the Fed disappoints!). Surprisingly, the Fed fund futures still anticipate two more 25 basis point rate hikes even with banks cowering under the cover of Project Calm.
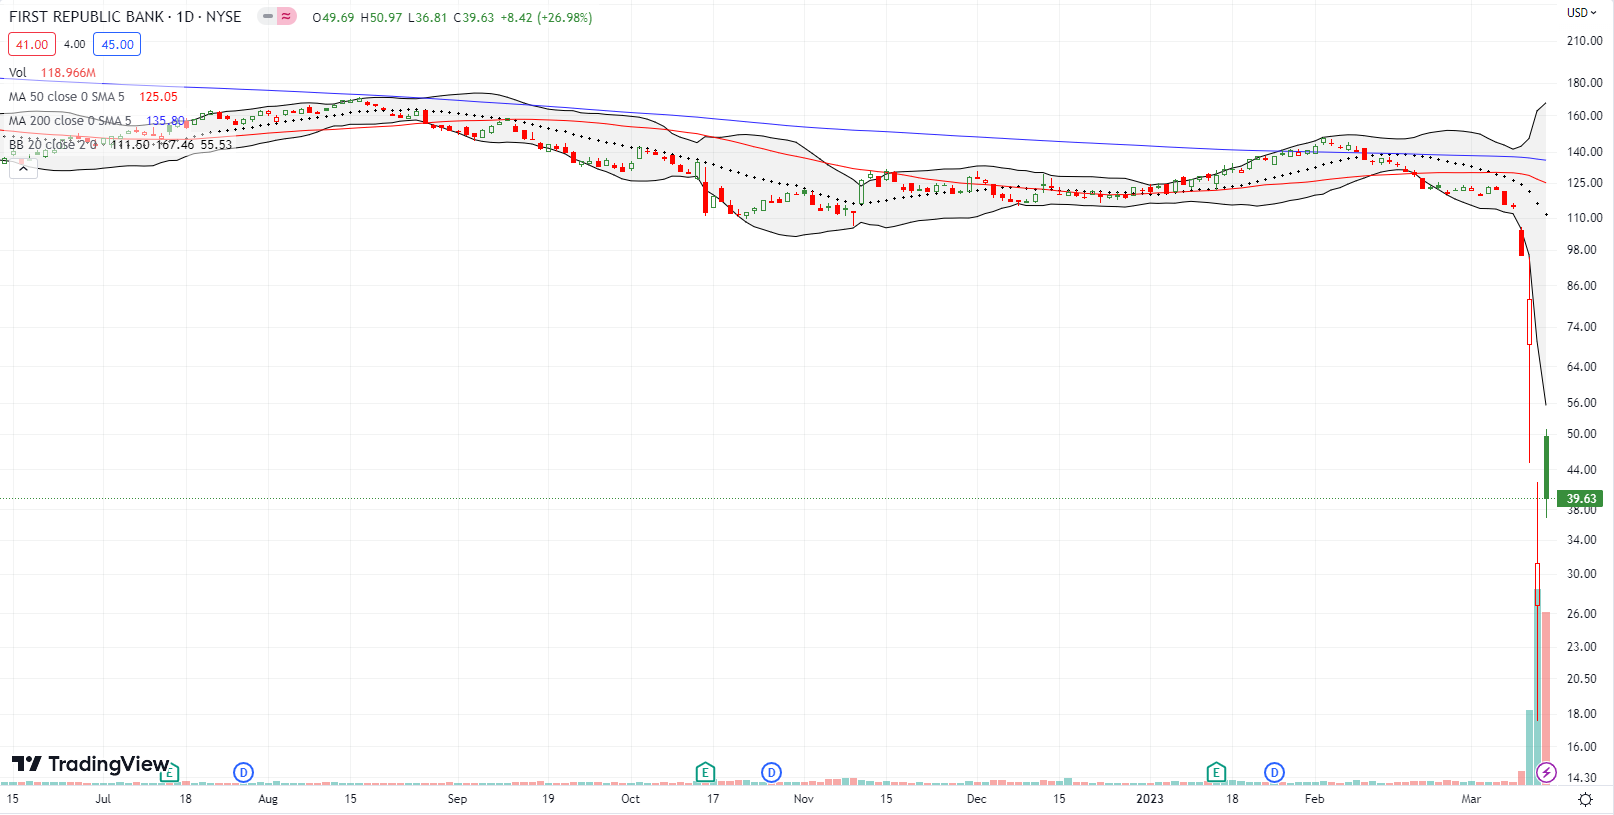
The trading in the beaten up financials took on different shades, colors, and flavors. Harried First Republic Bank (FRC) plunged another 61.8% on Monday despite the bank’s reassurances on Sunday:
“The additional borrowing capacity from the Federal Reserve, continued access to funding through the Federal Home Loan Bank, and ability to access additional financing through JPMorgan Chase & Co. increases, diversifies, and further strengthens First Republic’s existing liquidity profile. The total available, unused liquidity to fund operations is now more than $70 billion. This excludes additional liquidity First Republic is eligible to receive under the new Bank Term Funding Program announced by the Federal Reserve today.”
Panicked investors and traders ignored the message and sowed seeds of doubt in my mind. I could not help wondering “what am I missing?” As a result, I did not dare buy any individual regional banks. FRC gained 27.0% today, but sellers still took the stock well off its gap open.
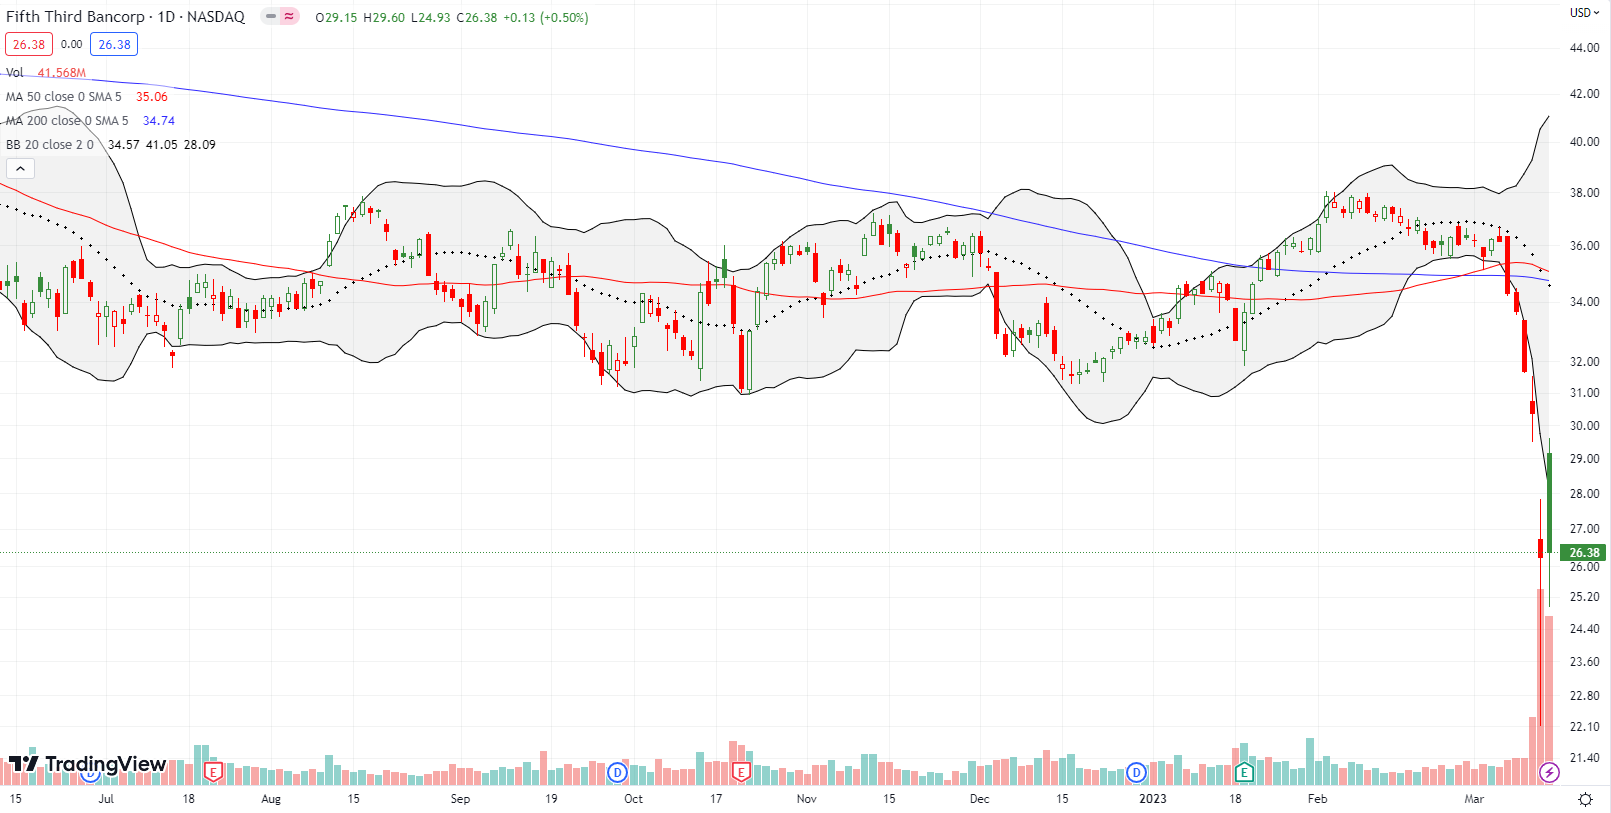
Fifth Third Bancorp (FITB) made my watchlist today because I heard convincing arguments on CNBC’s Fast Money that this bank was wrongfully caught up in the regional banking crisis. Just like FRC and so many others, Monday’s panic took down FITB. FITB lost another 13.6%. Sellers faded FITB all the way back to a near flat close today. Again, this trading action leaves me wary. I now want to see FITB stabilize and hold Monday’s intraday low before I make a trade. At least today’s intraday low stopped short of Monday’s.
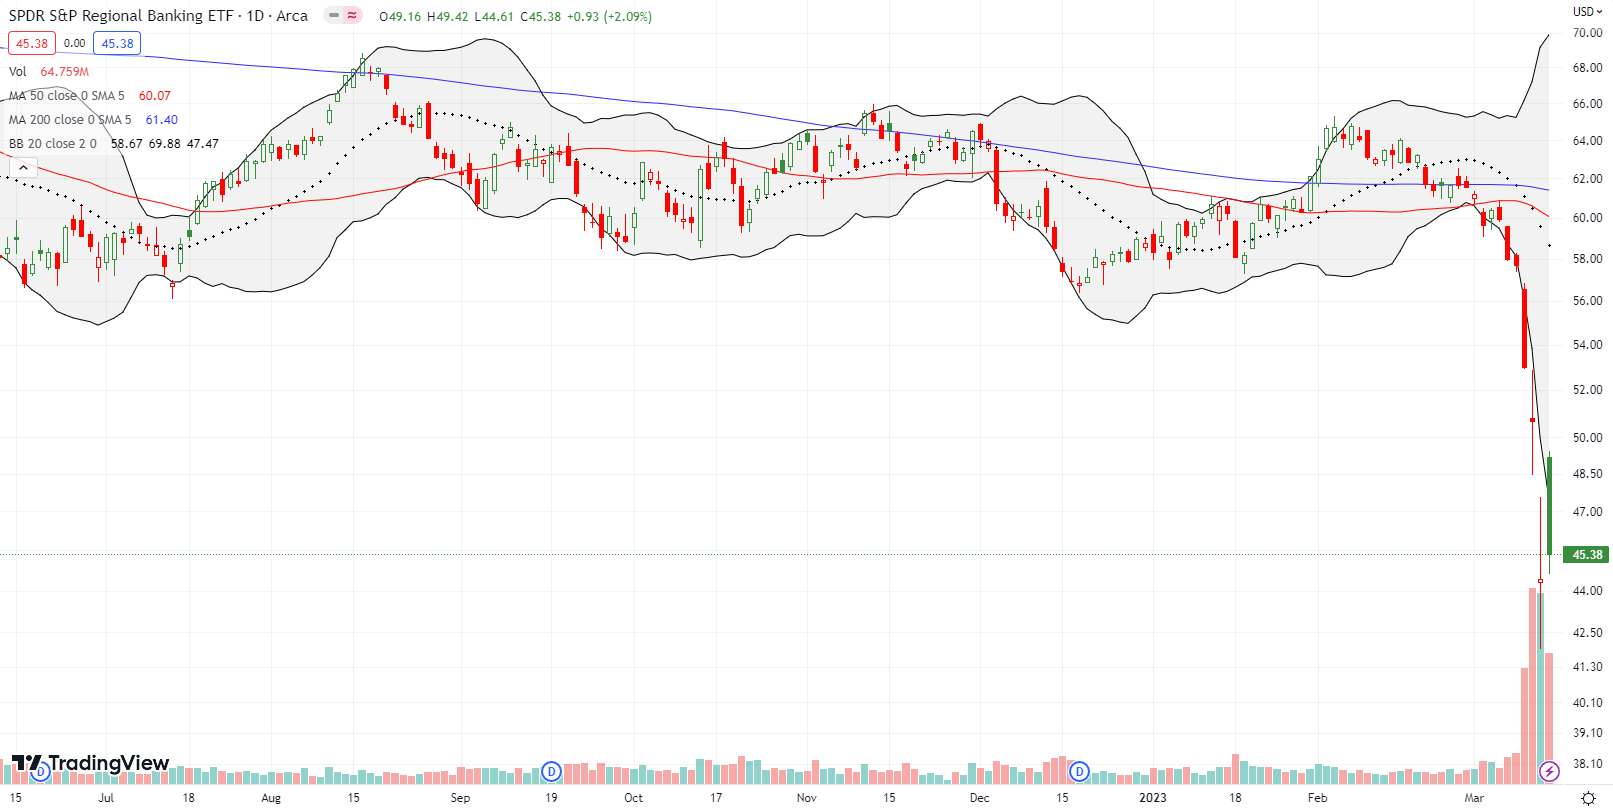
The “safest” way to trade the regional bank crisis is through the SPDR S&P Regional Banking ETF (KRE). Still, KRE plunged another 12.3% on Monday. I reached down deep in my oversold playbook and just bought. I sold immediately into the 10.6% gain at today’s open. Like FITB, I am now looking for KRE to stabilize and hold Monday’s intraday low as support.
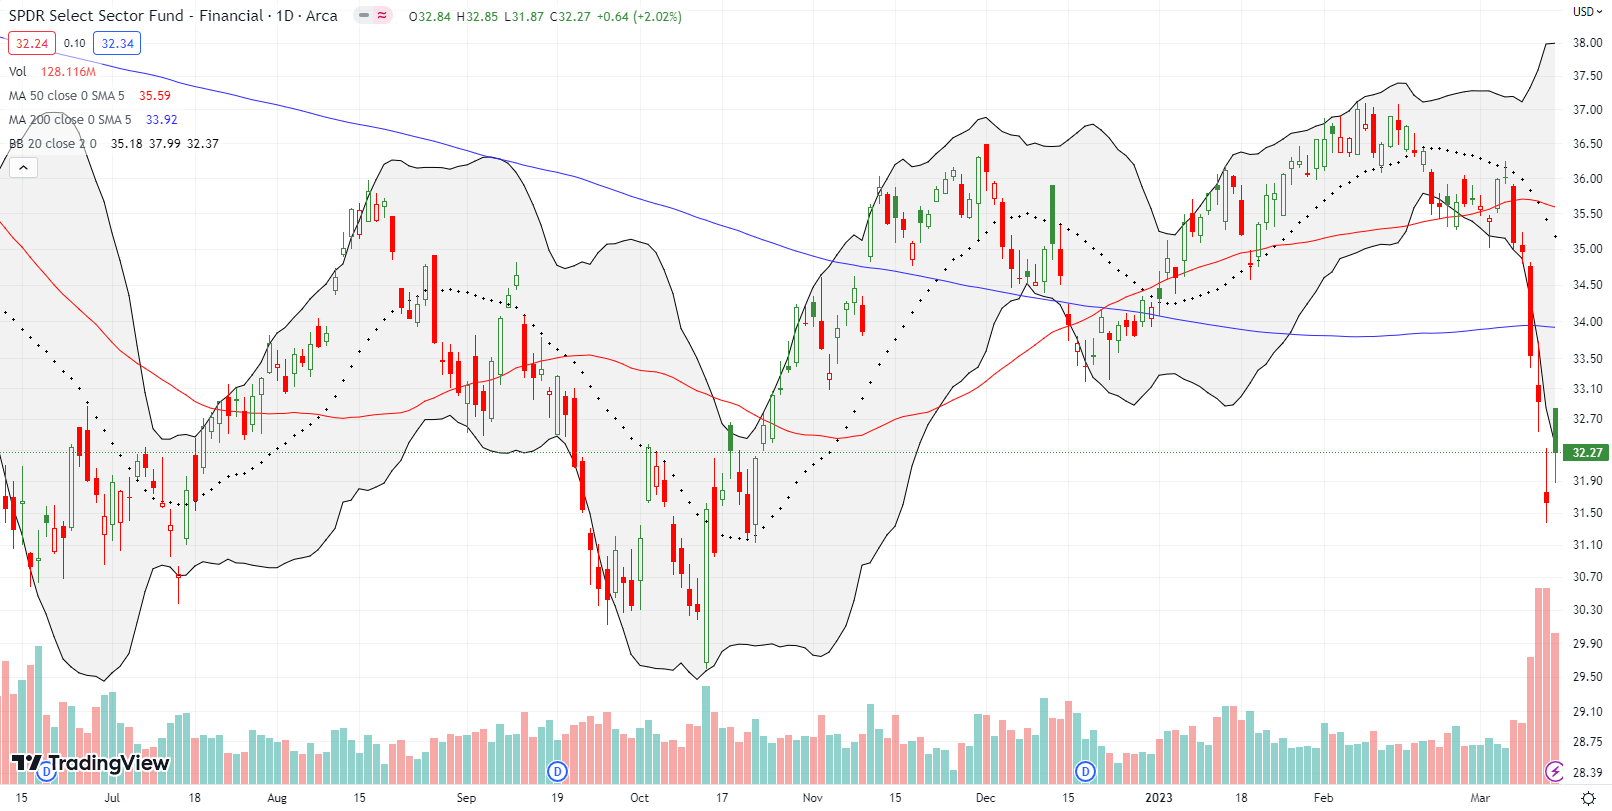
The regional bank drama is infecting the bigger banks in SPDR Select Sector Fund (XLF). There is not just the contagion of shattered confidence but also creeping concerns over fresh regulations for the entire banking sector. These regulations will of course clip margins and profitability. Still, I bought into XLF’s 4.0% drop on Monday with an upside target at 200DMA resistance.
Be careful out there!
Footnotes
Subscribe for free to get email notifications of future posts!
“Above the 50” (AT50) uses the percentage of stocks trading above their respective 50-day moving averages (DMAs) to measure breadth in the stock market. Breadth defines the distribution of participation in a rally or sell-off. As a result, AT50 identifies extremes in market sentiment that are likely to reverse. Above the 50 is my alternative name for “MMFI” which is a symbol TradingView.com and other chart vendors use for this breadth indicator. Learn more about AT50 on my Market Breadth Resource Page. AT200, or MMTH, measures the percentage of stocks trading above their respective 200DMAs.
Active AT50 (MMFI) periods: Day #102 over 20% (overperiod), Day #3 under 30% (underperiod), Day #4 under 40%, Day #6 under 50%, Day #16 under 60%, Day #18 under 70%
Source for charts unless otherwise noted: TradingView.com
Full disclosure: long QQQ put spread; long SPY put spread, long IWM call spread, long XLF call spread
FOLLOW Dr. Duru’s commentary on financial markets via StockTwits, Twitter, and even Instagram!
*Charting notes: Stock prices are not adjusted for dividends. Candlestick charts use hollow bodies: open candles indicate a close higher than the open, filled candles indicate an open higher than the close.


1 thought on “Project Calm from the Feds Bounces Stocks Away from Oversold – The Market Breadth”