Stock Market Commentary:
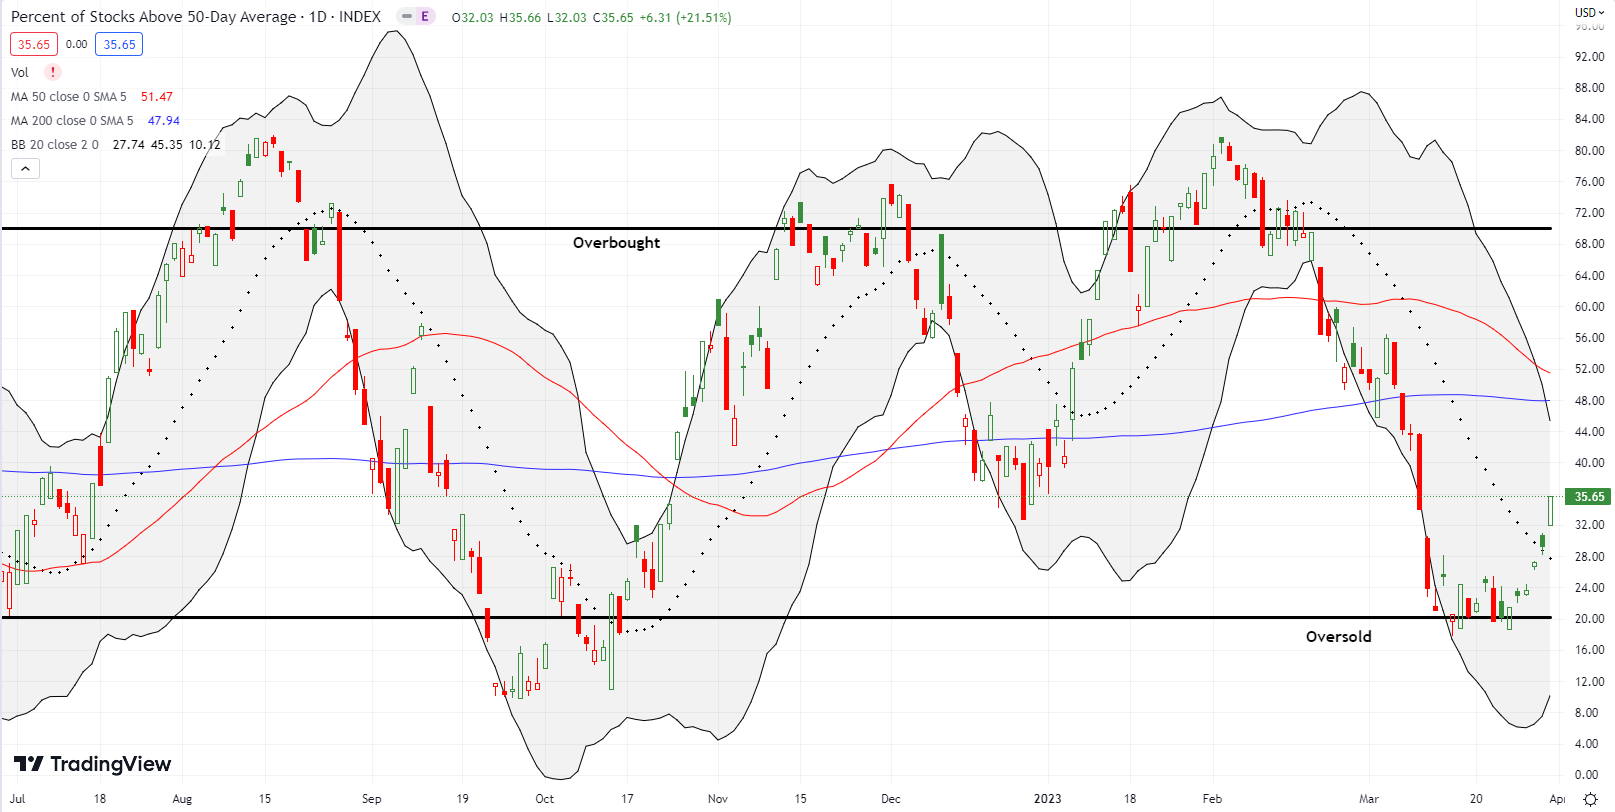
Just a week ago, the stock market was teasing oversold conditions. The lingering memories of the Panic of 2023 seemed likely to push the market deeper into oversold territory before sellers exhausted themselves into a market rebound. Buyers decided not to wait. A broad-based buying spree conspired to leave regional banks behind last week. While regional banks flailed and churned, tech stocks in particular took off with a powerful oversold bounce. It was a fresh reminder of the importance of tracking market breadth in the form of the percentage of stocks trading above their respective 50-day moving averages (DMAs), aka AT50.
The Stock Market Indices
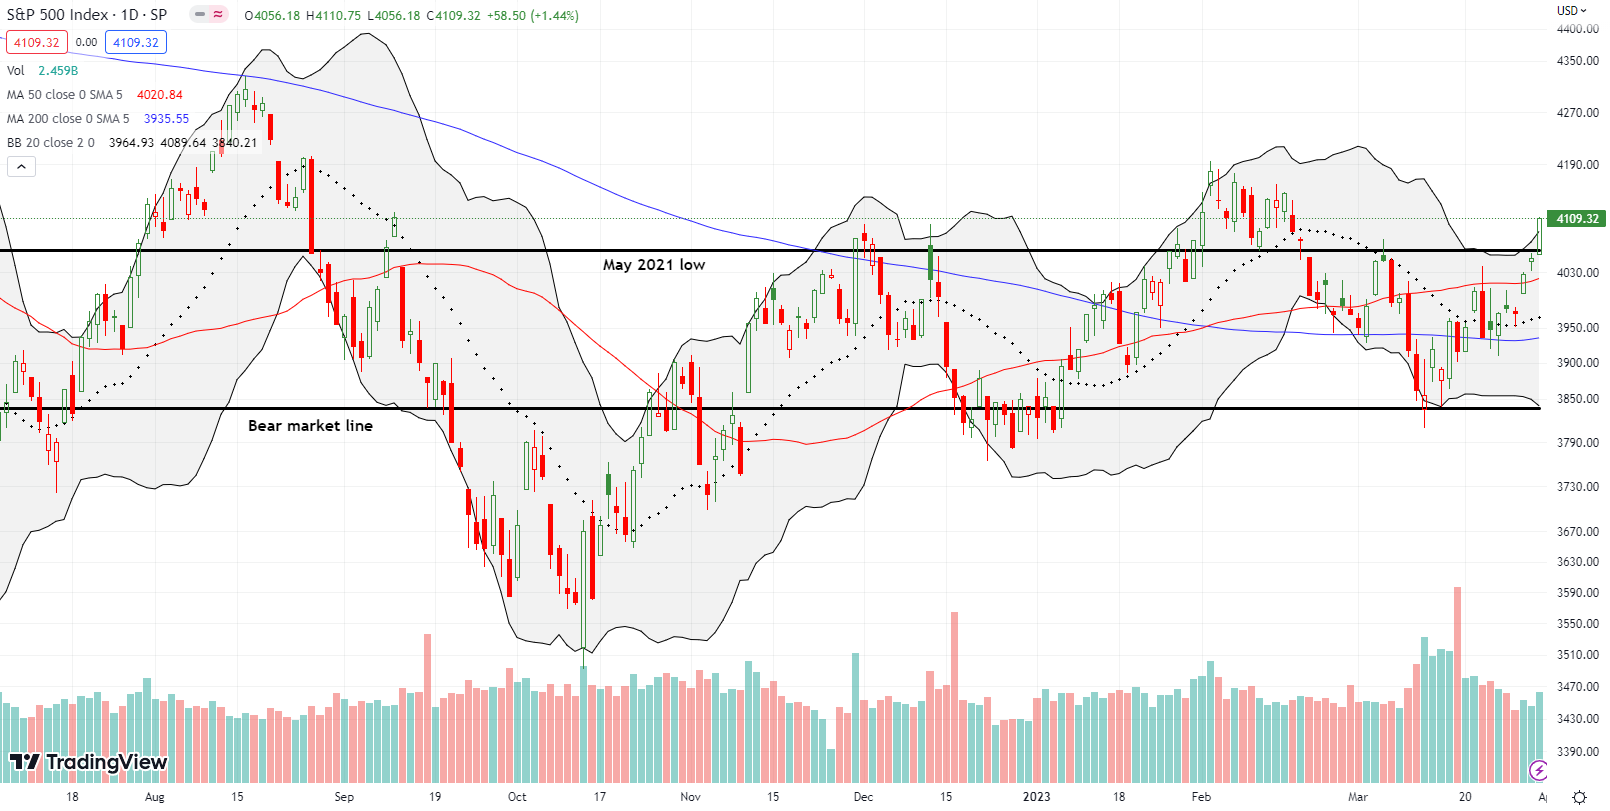
The S&P 500 (SPY) made sure to leave regional banks behind with an exclamation mark. The index confirmed a breakout above its 50DMA (red line). It also ended the week and the month with an impressive 1.4% surge above resistance at the May, 2021 low. While I still suspect February marked a lasting top for the S&P 500, the ability to so definitively put the Panic of 2023 in the rear mirror has me thinking twice about my expectations. Project Calm from the Federal Reserve worked magic outside of regional banks.
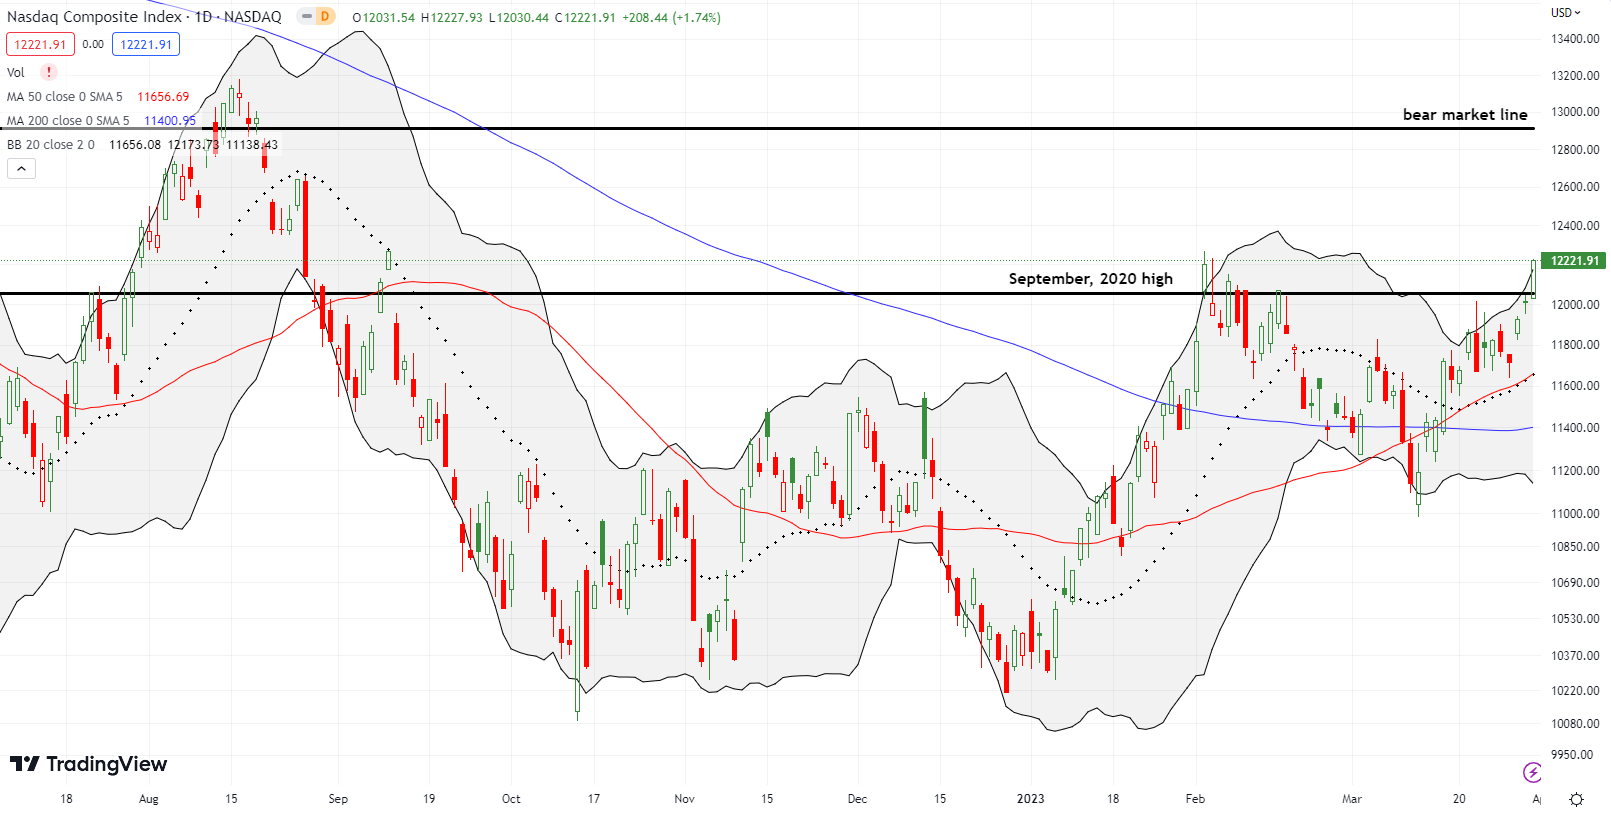
The NASDAQ (COMPQ) benefited from Project Calm even more than the S&P 500. Stuffed and concentrated with big cap tech stocks flush with cash (First Bank of Big Tech anyone?), the NASDAQ reached escape velocity fueled with buyers fleeing for “safety.” The tech-laden index ended the week and the month with a 1.7% gain that generated a 6+ month high. The NASDAQ now leads the indices from a technical standpoint; tech stock momentum also increases the chances that the S&P 500 can muscle its way to a new high for the year. The regional banks are almost a distant memory.
The iShares Russell 2000 ETF (IWM) survived a test of its pre-pandemic high as support. Yet the Panic of 2023 still weighs heavily on this ETF of small caps. IWM remains far behind the other indices as it still sits below important resistance from its 200DMA (bluish line) and its 50DMA. At least IWM finished the month with a breakout above its downtrending 20DMA (dashed line). I am still holding an April call spread.

Stock Market Volatility
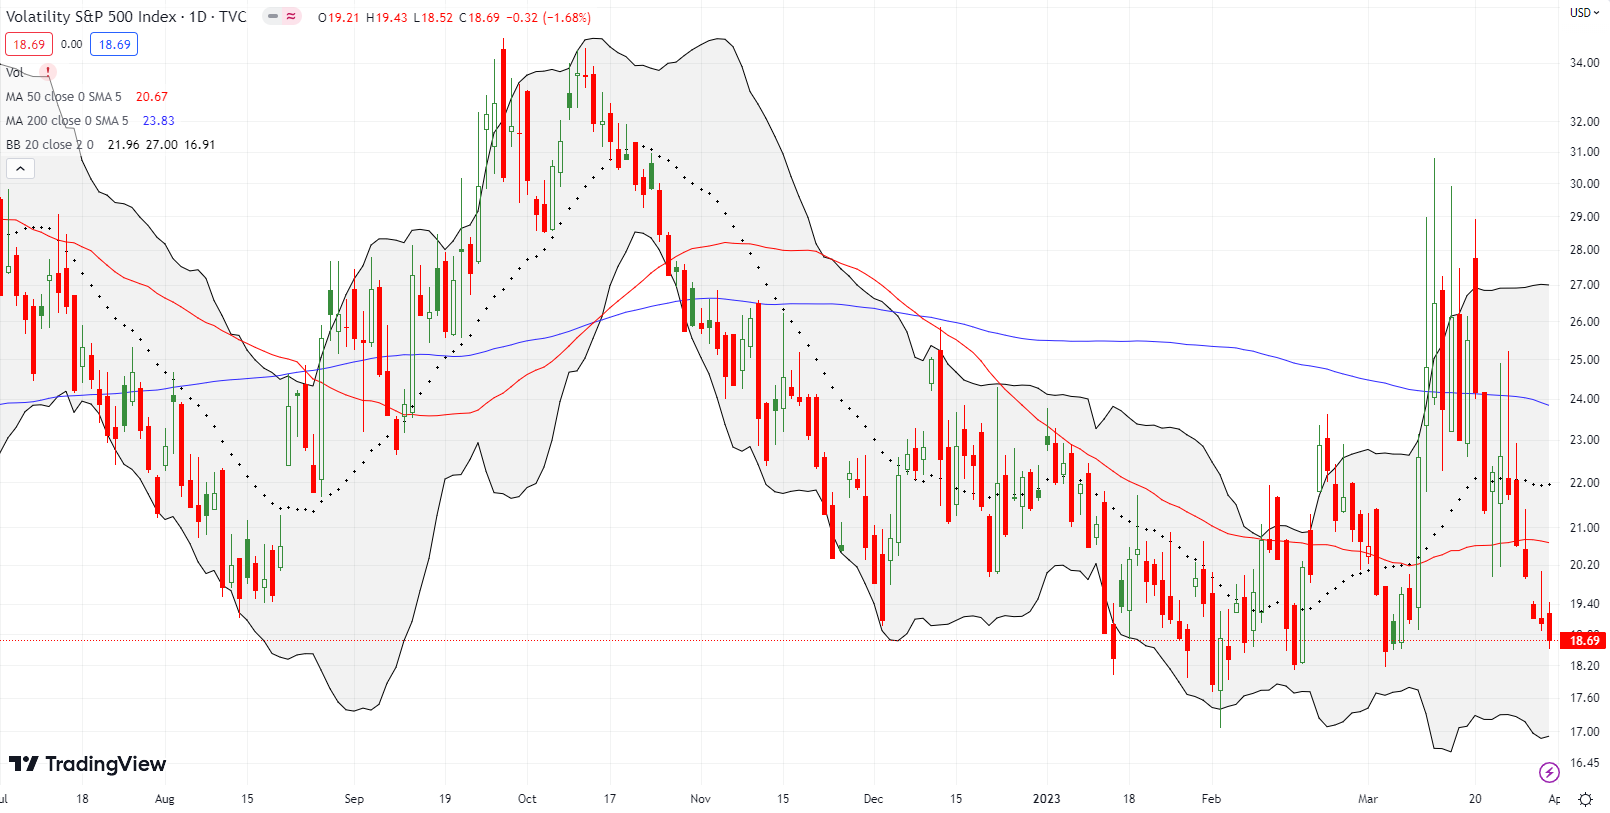
The volatility index (VIX) lost 9.7% for the month. This decline was the most telling effort to leave regional banks behind. Faders pushed the VIX below the important 20 level and continued with 3 lower closes to polish off the month. Project Calm worked magic on the VIX with volatility faders emerging as big winners. Suddenly, the VIX lows of the year are facing yet another test. I thought the market had sufficient worries to plant solid floors under the VIX and even sustain the last breakout for several weeks. Note that new lows on the VIX would set the stage for a new bullish phase in the stock market.
The Short-Term Trading Call While Stocks Leave Regional Banks Behind
- AT50 (MMFI) = 35.7% of stocks are trading above their respective 50-day moving averages
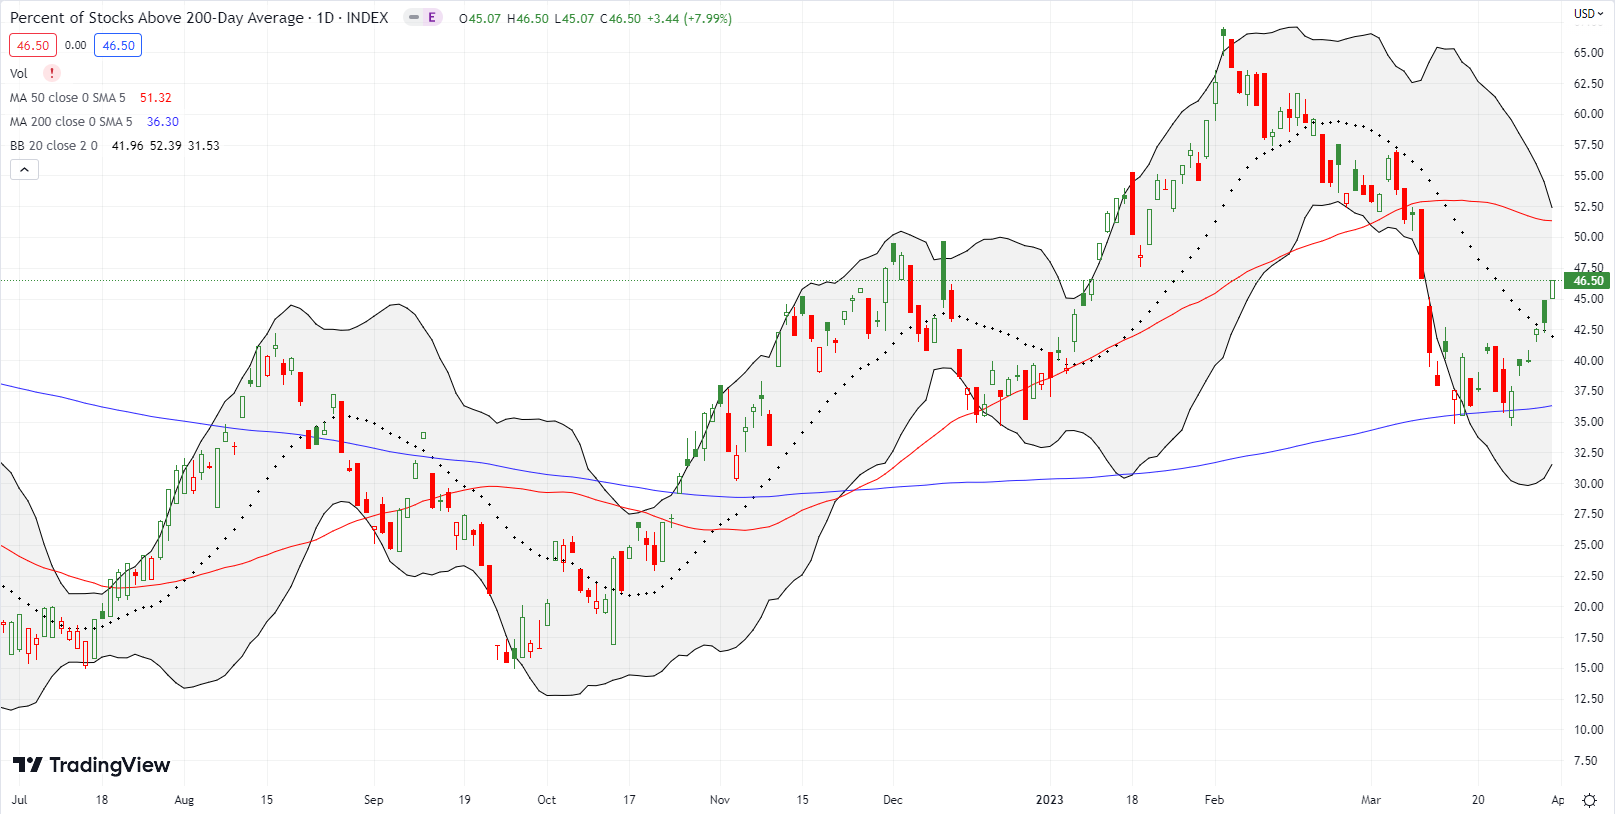
- AT200 (MMTH) = 46.5% of stocks are trading above their respective 200-day moving averages
- Short-term Trading Call: cautiously bullish
AT50 (MMFI), the percentage of stocks trading above their respective 50DMAs, closed an incredible month at 35.7%. Last week’s increase in market breadth definitively confirmed the desire to leave regional banks and their drama behind. Overbought extremes emerged as critical once again. Yet, I was worried enough about the potential for a pullback in tech, I was not as aggressive buying into oversold conditions as I should have. Chalk this experience up as a reminder on how discretionary application of trading rules can fail. On the other hand, the rally was enough to position commercial real estate stocks for my planned fade. These fades should also serve as sufficient hedges on the more aggressive buys I will likely do in April.
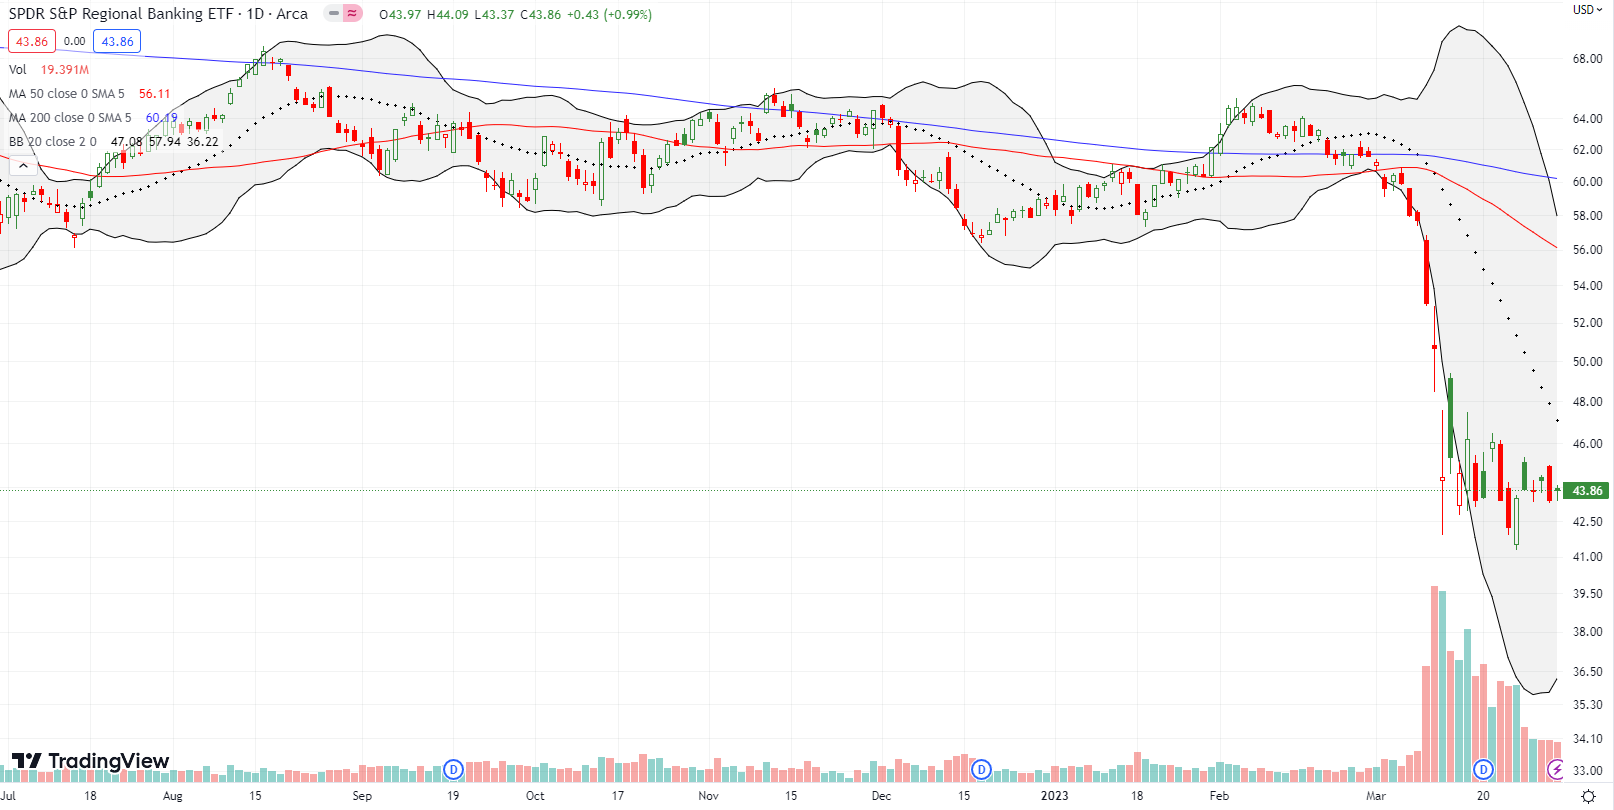
The SPDR S&P Regional Banking ETF (KRE) was battered in March for a 28.8% loss on the month. However, the majority of the losses occurred in the three trading days starting with the big breakdown on March 9th. Fortunately, sellers only managed to punch minor new lows since then. The resulting holding pattern has created churn awaiting a rendezvous with the rapidly descending 20DMA resistance.
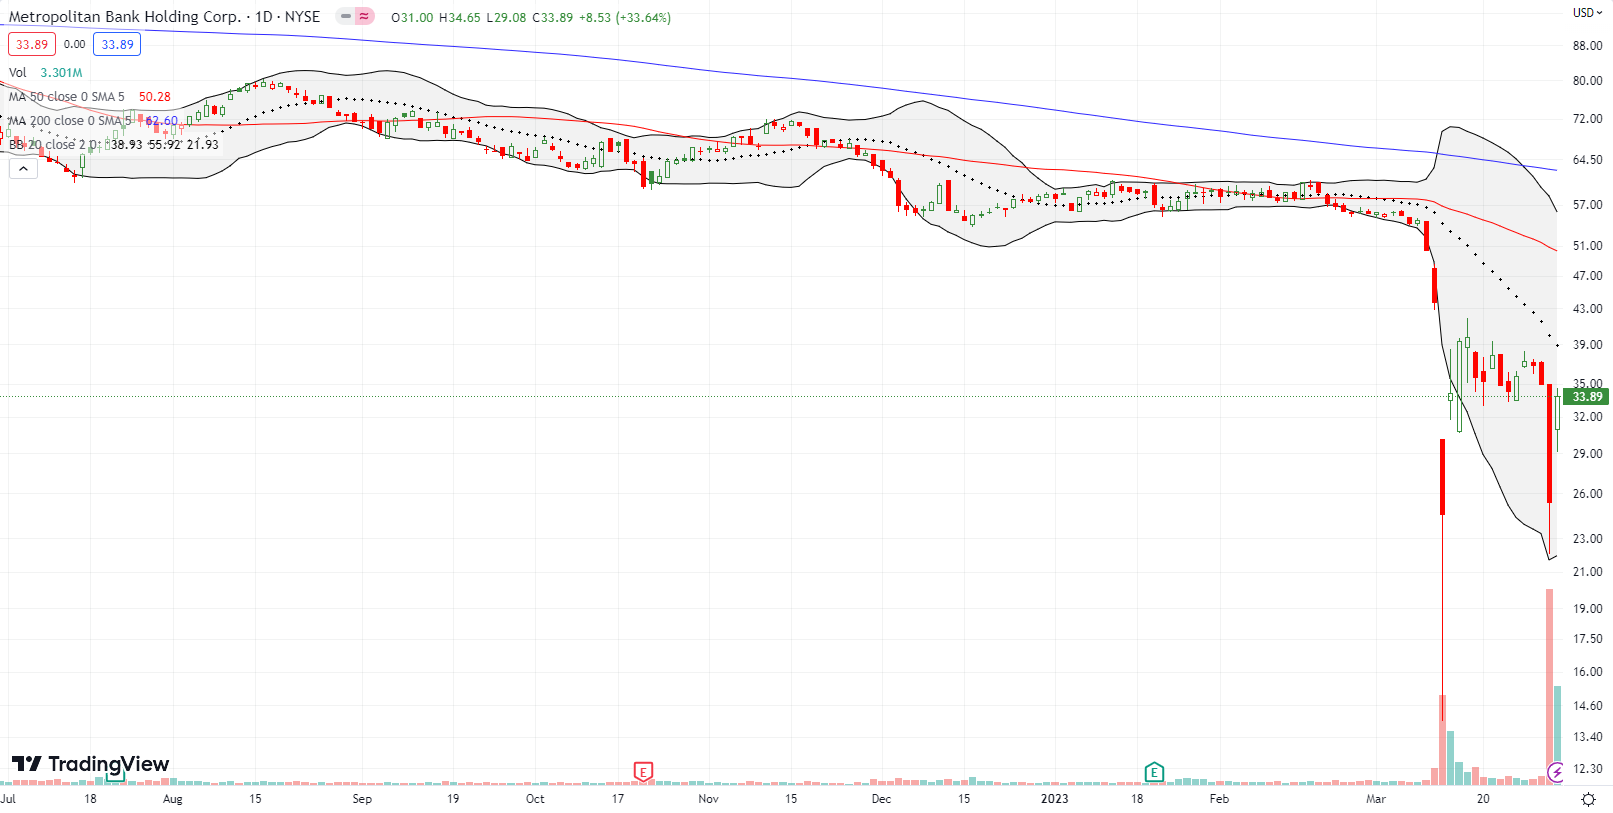
Metropolitan Bank Holding Corp (MCB) is one of several examples of the extremes of panic in regional banks. MCB lost 43.8% on the day after the Feds rolled out Project Calm and even lost as much as 68.0% at the intraday low. The very next day, MCB gapped higher for a 39.0% gain. Panic gripped the bank again last Thursday in the wake of a short sellers report; MCB lost 27.6%. MCB promptly issued reassurances about its financial condition like “liquidity remains strong. Cash on deposit with the Federal Reserve Bank of New York and readily accessible secured funding capacity totaled $3.1 billion, which is 170% of uninsured deposit balances.” The stock reversed almost all the losses the next day. The description of MCB makes it sound uncomfortably close to Silicon Valley Bank (emphasis mine). This association likely keeps investors on edge over MCB.
“Metropolitan Bank Holding Corp. (NYSE: MCB), through our community bank subsidiary, Metropolitan Commercial Bank, provides a broad range of business, commercial and personal banking products and services to small and middle-market businesses, public entities and affluent individuals in the New York metropolitan area. Known as “The Entrepreneurial Bank,” we share the entrepreneurial spirit of our clients. We are sharply focused on serving their needs, while enhancing shareholder value by capitalizing on the growth opportunities of a dynamic marketplace.”
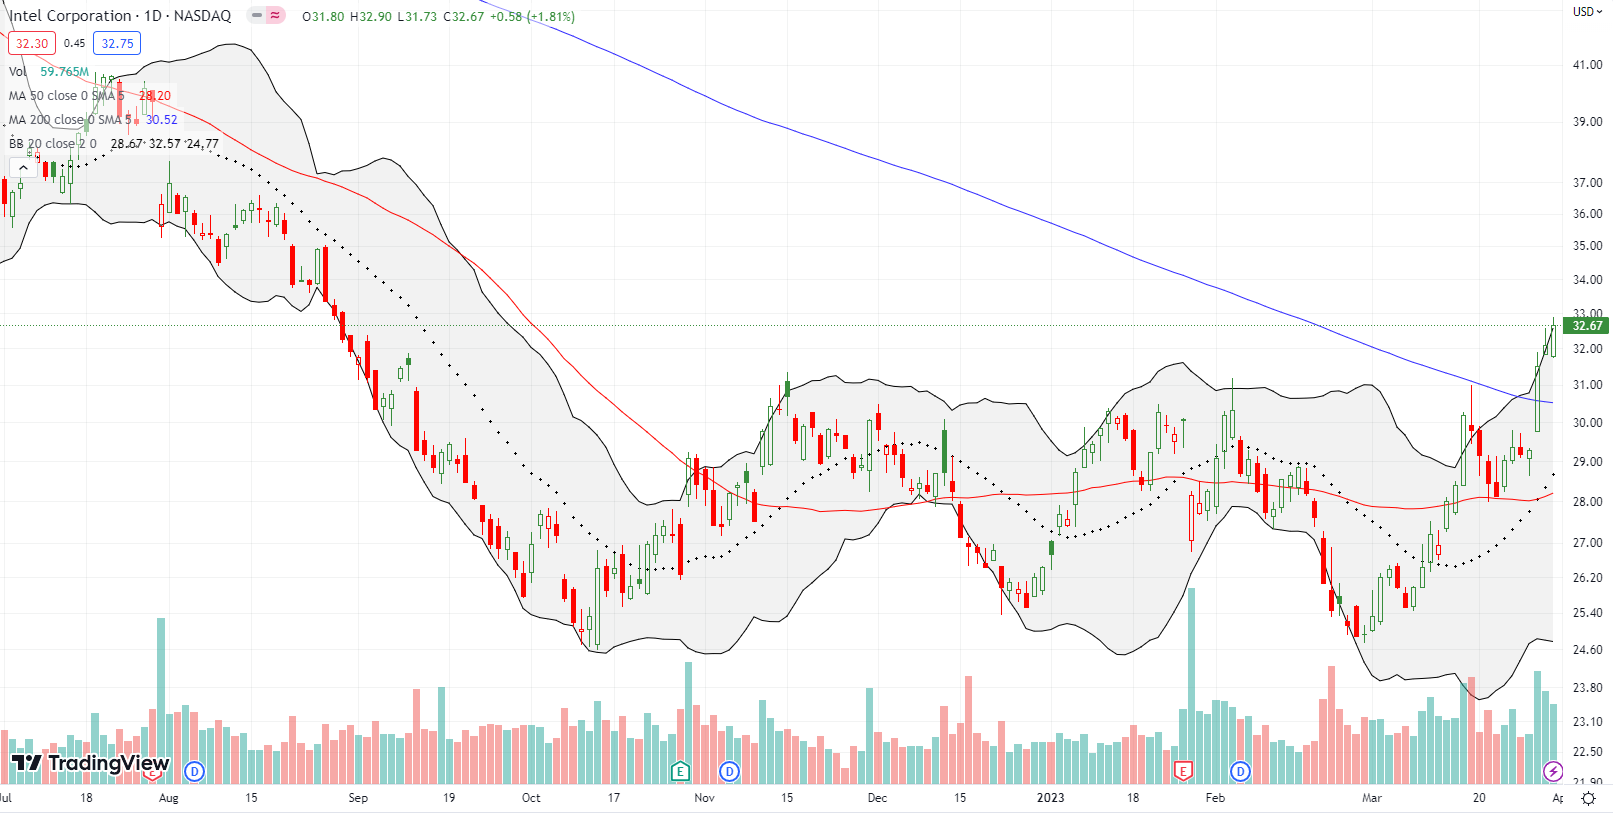
Tech has been such a popular safe-haven that even Intel Corporation (INTC) is now in a bullish position. On Wednesday, INTC surged 7.6% and sliced through 200DMA resistance. INTC confirmed the breakout the next day and ended the week and the month with a 7-month high. The stock is a buy the dips from here. I typically buy INTC call options between earnings. However, January earnings seemed so bad, I put the strategy on the shelf. I managed to flip a calendar call spread for a small gain after the 200DMA breakout, but I was hoping to hold the long side of the spread going into this week.
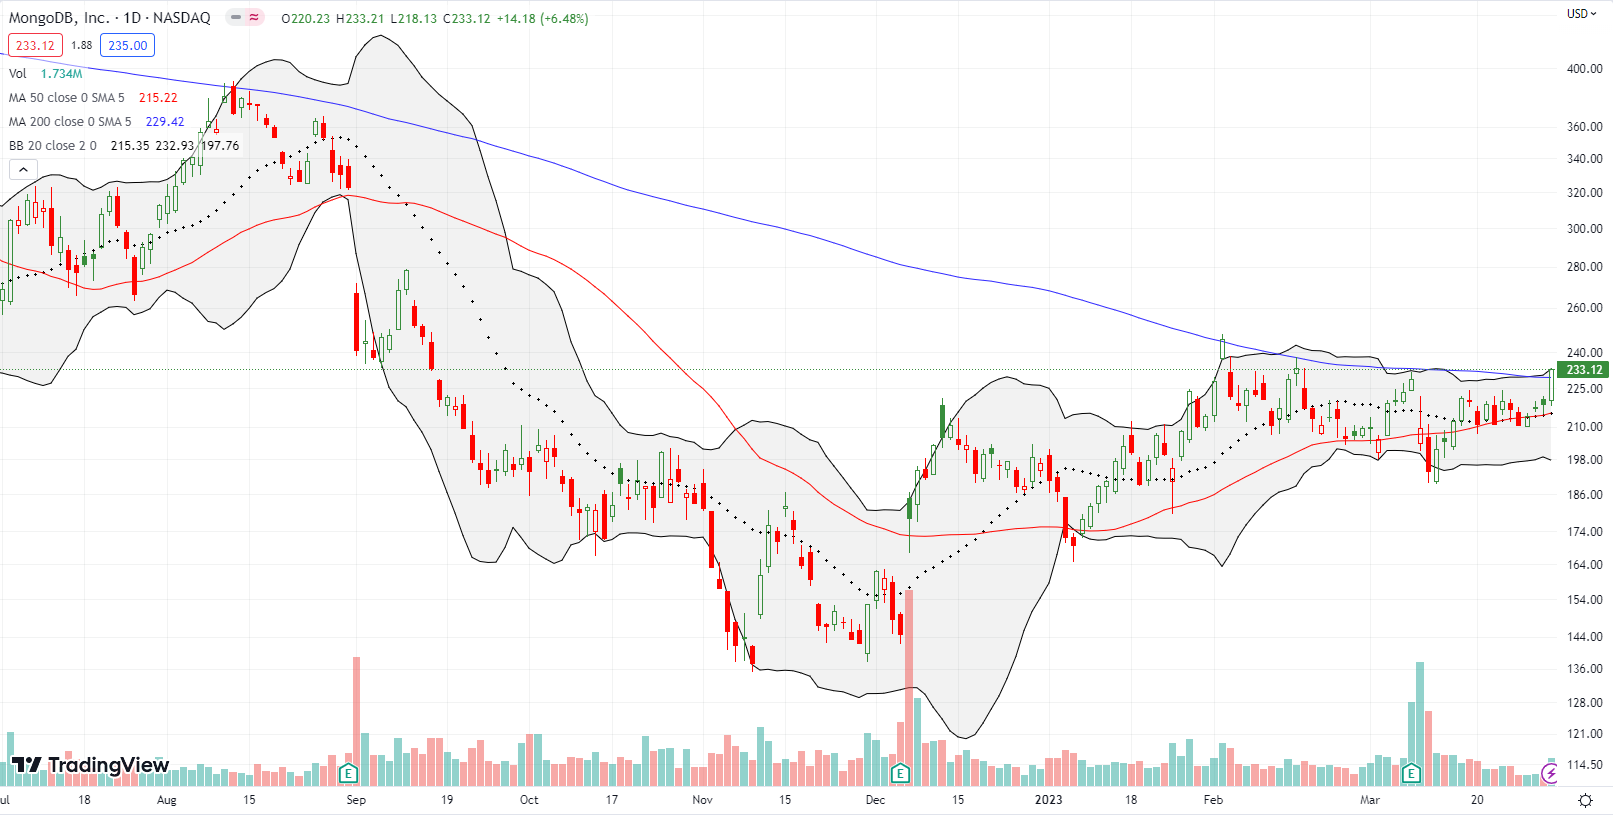
As I scan charts, I see several brewing breakout patterns like the one MongoDB, Inc (MDB) is carving out. MDB first broke the malaise from 2022 with a 22.2% post-earnings gap up in December and has barely looked back since. MDB churned from there with its 50DMA as support and a pivot. Descending 200DMA resistance helped to reduce volatility. MDB ended the week and the month with its first close above its 200DMA in almost a year. I am a buyer on a second close higher.
Be careful out there!
Footnotes
Subscribe for free to get email notifications of future posts!
“Above the 50” (AT50) uses the percentage of stocks trading above their respective 50-day moving averages (DMAs) to measure breadth in the stock market. Breadth defines the distribution of participation in a rally or sell-off. As a result, AT50 identifies extremes in market sentiment that are likely to reverse. Above the 50 is my alternative name for “MMFI” which is a symbol TradingView.com and other chart vendors use for this breadth indicator. Learn more about AT50 on my Market Breadth Resource Page. AT200, or MMTH, measures the percentage of stocks trading above their respective 200DMAs.
Active AT50 (MMFI) periods: Day #7 over 20%, Day #1 over 30% (overperiod ending 15 days under 30%), Day #17 under 40%, Day #19 under 50%, Day #29 under 60%, Day #31 under 70%
Source for charts unless otherwise noted: TradingView.com
Full disclosure: long QQQ put spread, long IWM call spread, long VXX call spread
FOLLOW Dr. Duru’s commentary on financial markets via StockTwits, Twitter, and even Instagram!
*Charting notes: Stock prices are not adjusted for dividends. Candlestick charts use hollow bodies: open candles indicate a close higher than the open, filled candles indicate an open higher than the close.


