Stock Market Commentary:
Was the second trading day of February the peak for the S&P 500? After a 1.4% gain nearly finished reversing the losses from last August’s Jackson Hole, the index lost momentum. While the index churned for the following 2 weeks, trashed stocks from 2022 continued to soar. Even that momentum seemed to come to an abrupt end last week as sellers resolved the seesaw between resistance and support. Last week’s breakdowns raised a question for the first 6 weeks of the year. Was that rally a mirage? Was that bullish price action simply a relief rally in a reflex reaction to intense year-end selling?
Incredibly, retail investors poured a record $1.51B a day into stocks from mid-January to mid-February based on Yahoo Finance reporting on data from VandaTrack. That kind of enthusiasm is the very definition of extreme herd trading and investing. Accordingly, I am compelled to find confirmation in the bearish conclusion of the last overbought period.
The Stock Market Indices
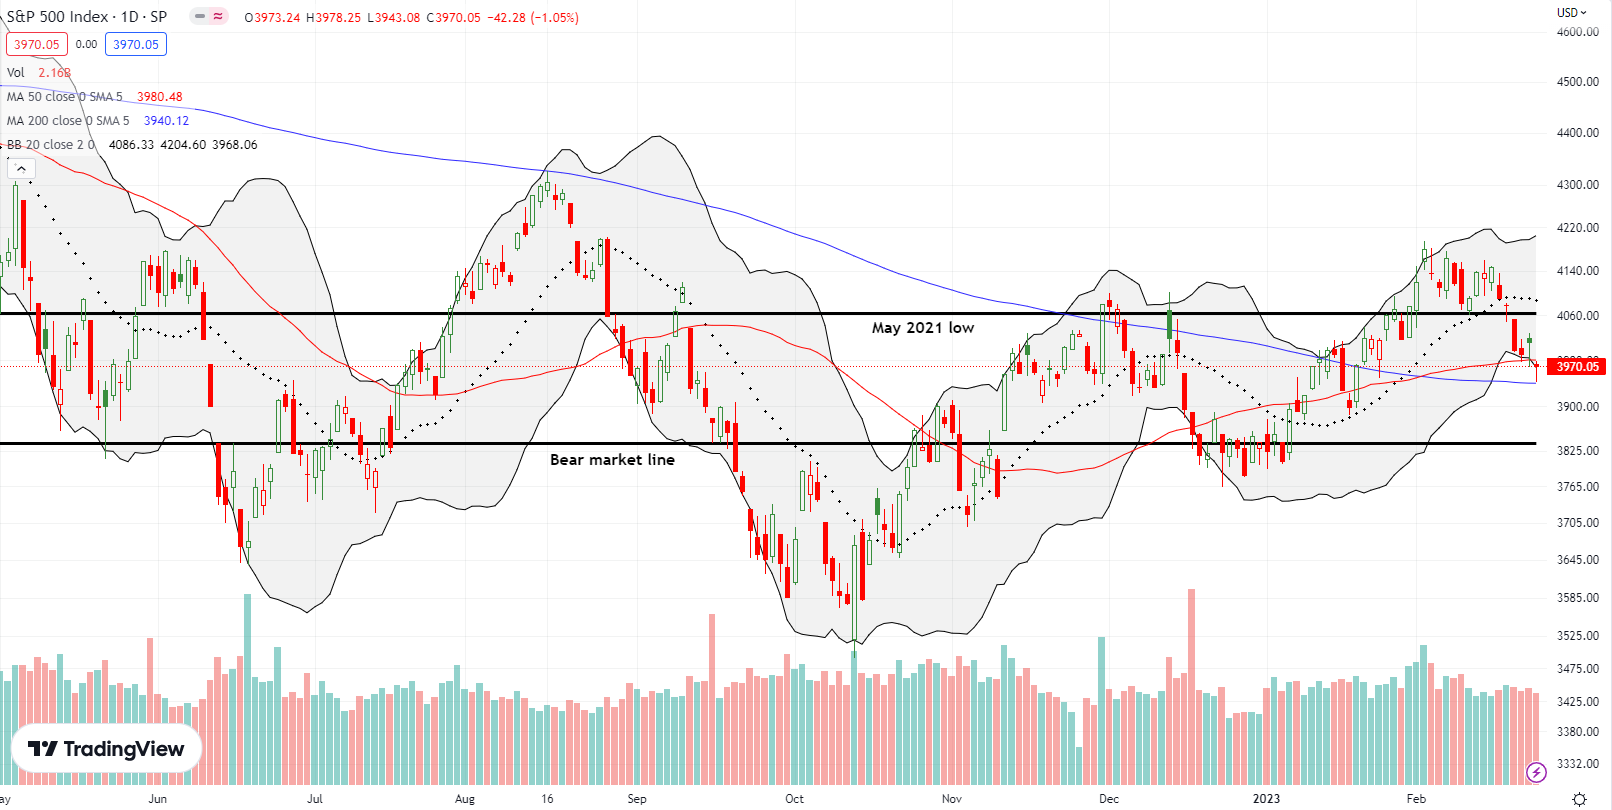
The S&P 500 (SPY) finally lost its fight to retain support at the May, 2021 low. The breakdown came on a conclusive 2.0% loss to start the holiday-shortened week. For the next two days buyers put up a spirited defense of support at the 50-day moving average (DMA) (the red line below). This effort including a robotic bounce off 50DMA support on Friday. Strong inflation data on Friday brought a swift breakdown of 50DMA support and led into another robotic defense of obvious support. Buyers jumped in right at 200DMA support and lessened the S&P 500’s loss to 1.1% and a close just below 50DMA resistance.
The S&P 500 seemed to answer the question for the first 6 weeks of the year: the fun is done for now.
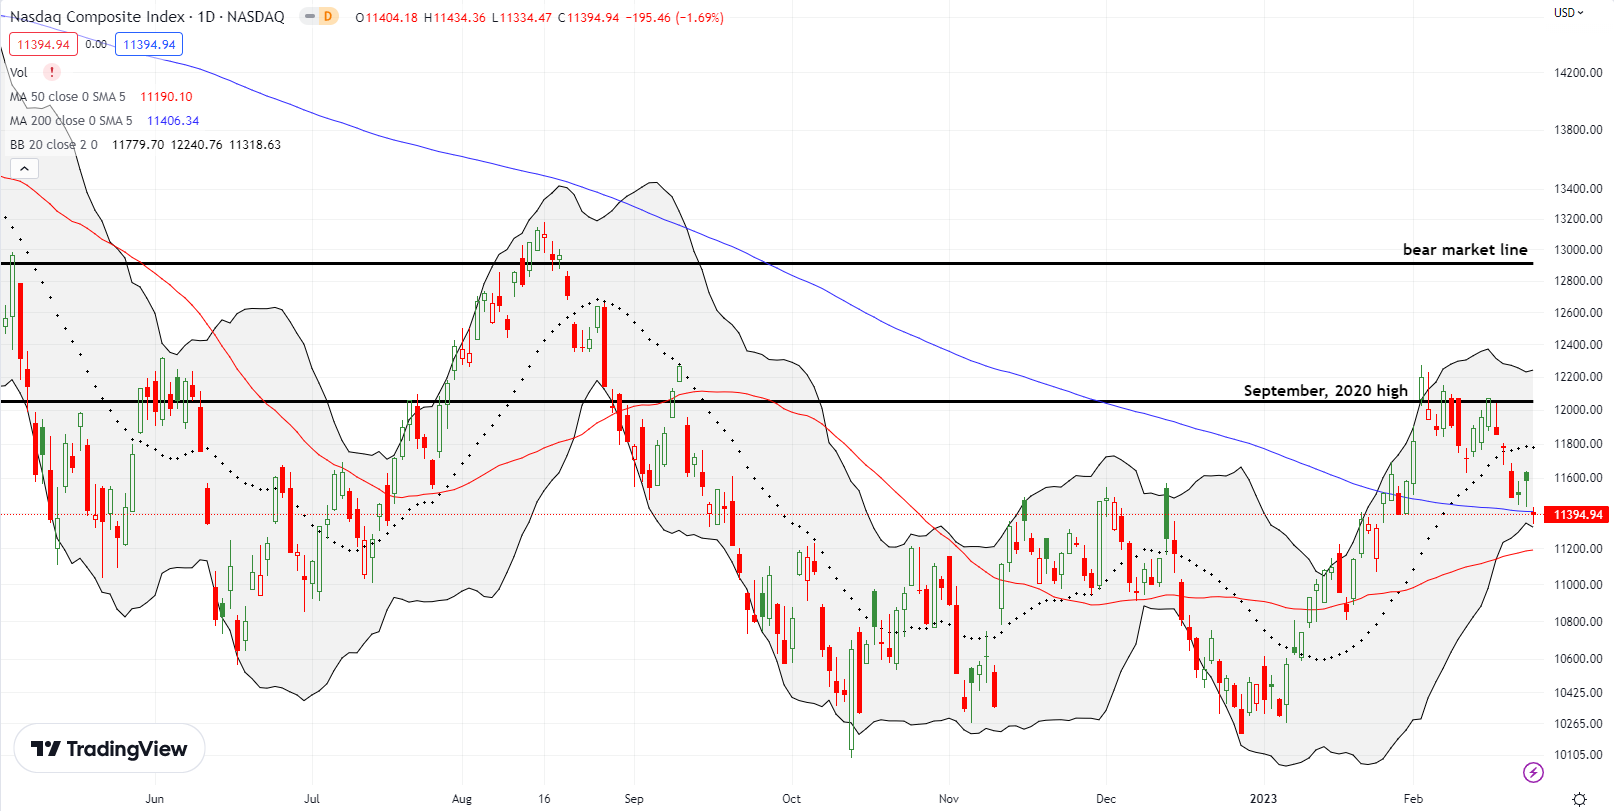
While the S&P 500 delivered an extended fakeout breakout above its May, 2021 low, the NASDAQ (COMPQ) delivered a false 1-day breakout above its September, 2020 high to mark its high of the year. The next two weeks of churn neatly held 20DMA support (the dotted line). The spirited fight came to a definitive end with Tuesday’s 2.5% loss. While the S&P 500 defended its 50DMA support, the tech-laden NASDAQ fought for 2 days to hold 200DMA support. The NADAQ closed the week clinging to that support. An uptrending 50DMA awaits the next test of support.
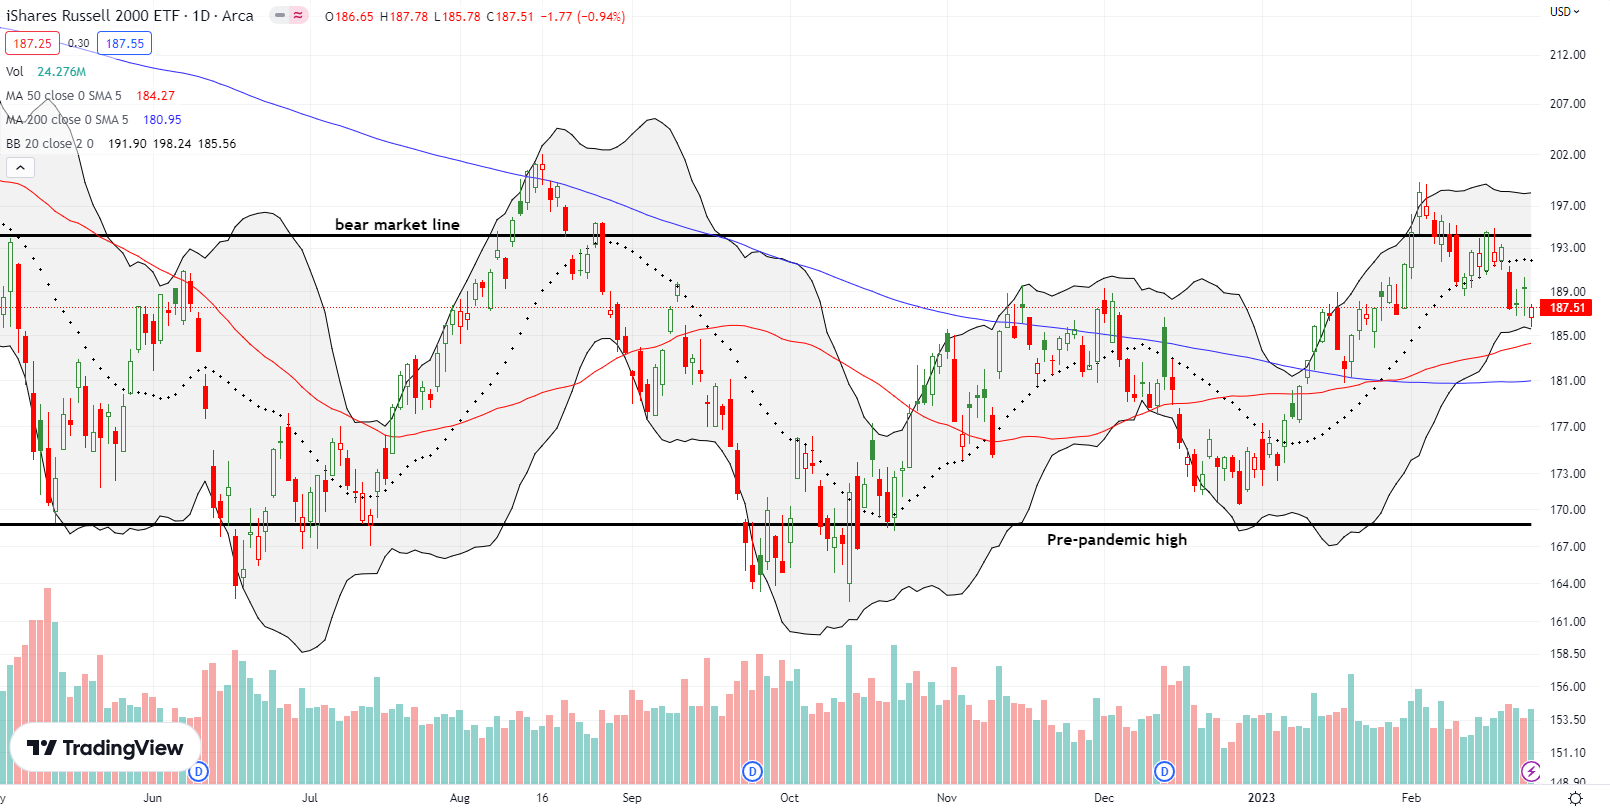
The iShares Russell 2000 ETF (IWM) started February with a false breakout above its bear market line. This fakeout lasted for a shorter duration than the last breakout 6 months ago. IWM looks positioned to soon test 50DMA support.
Stock Market Volatility
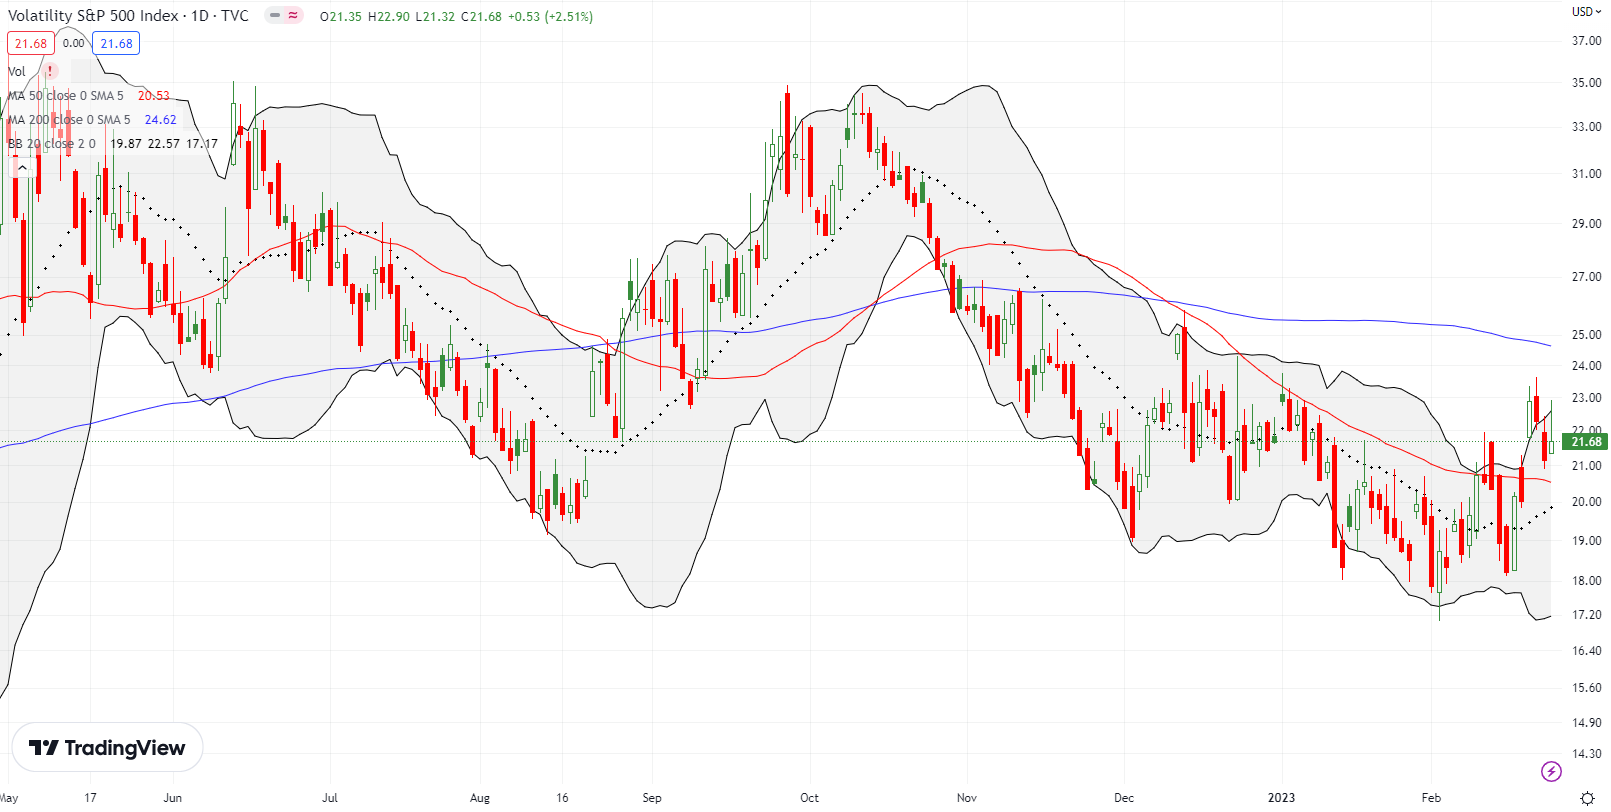
The volatility index (VIX) appropriately surged 14.3% to accompany the selling that started the week’s trading. However, faders took over the next two days so effectively that the tepid increase in the VIX on Friday’s selling failed to reestablish the week’s high. While the VIX continues its mysterious behavior, its early February bottom looks further confirmed.
The Short-Term Trading Call With A Question
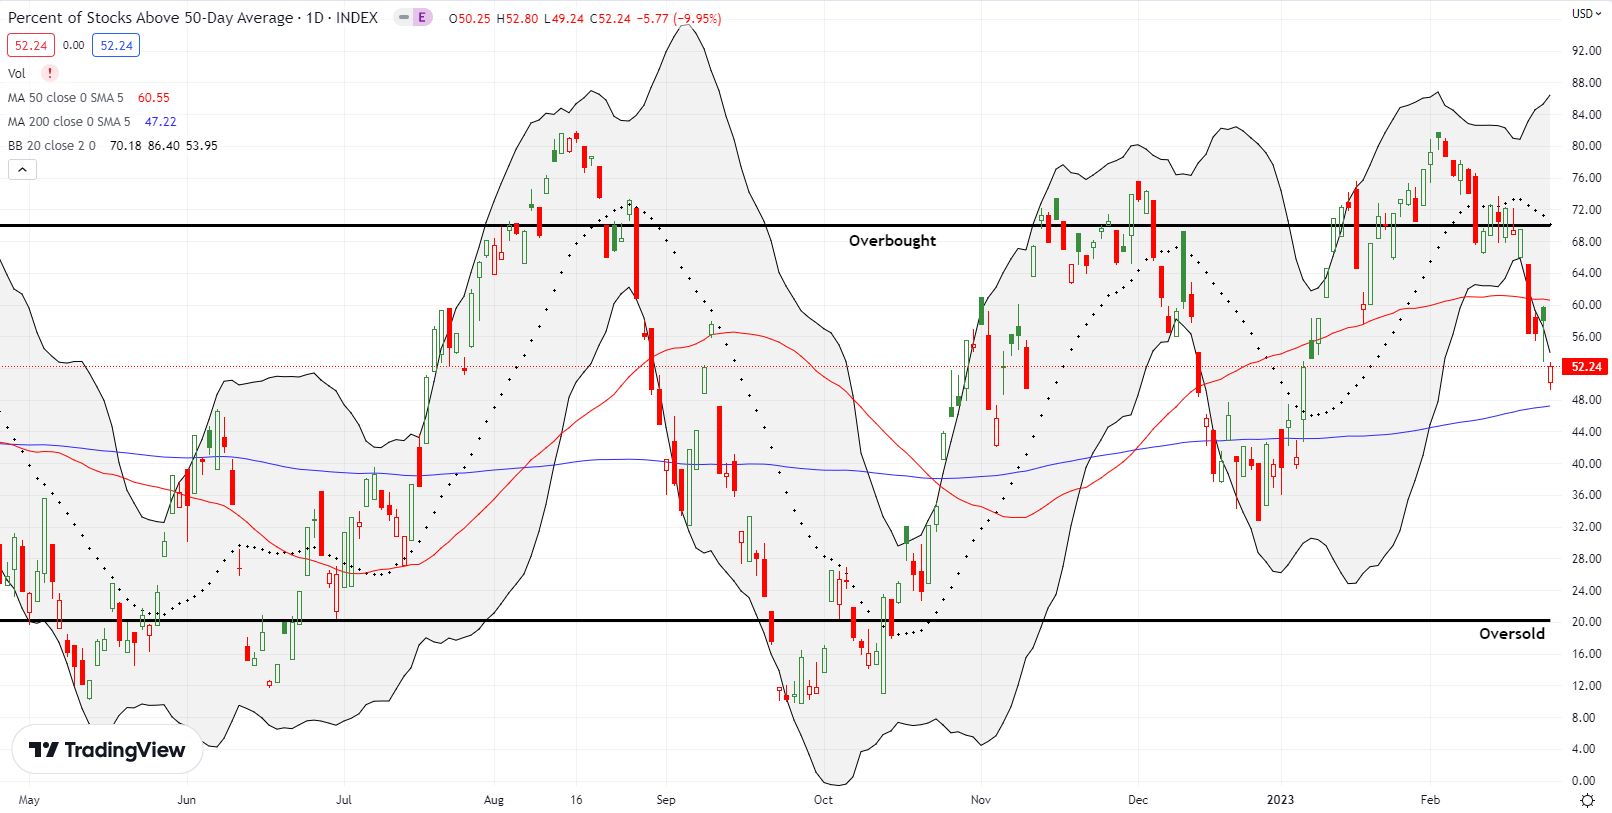
- AT50 (MMFI) = 52.2% of stocks are trading above their respective 50-day moving averages
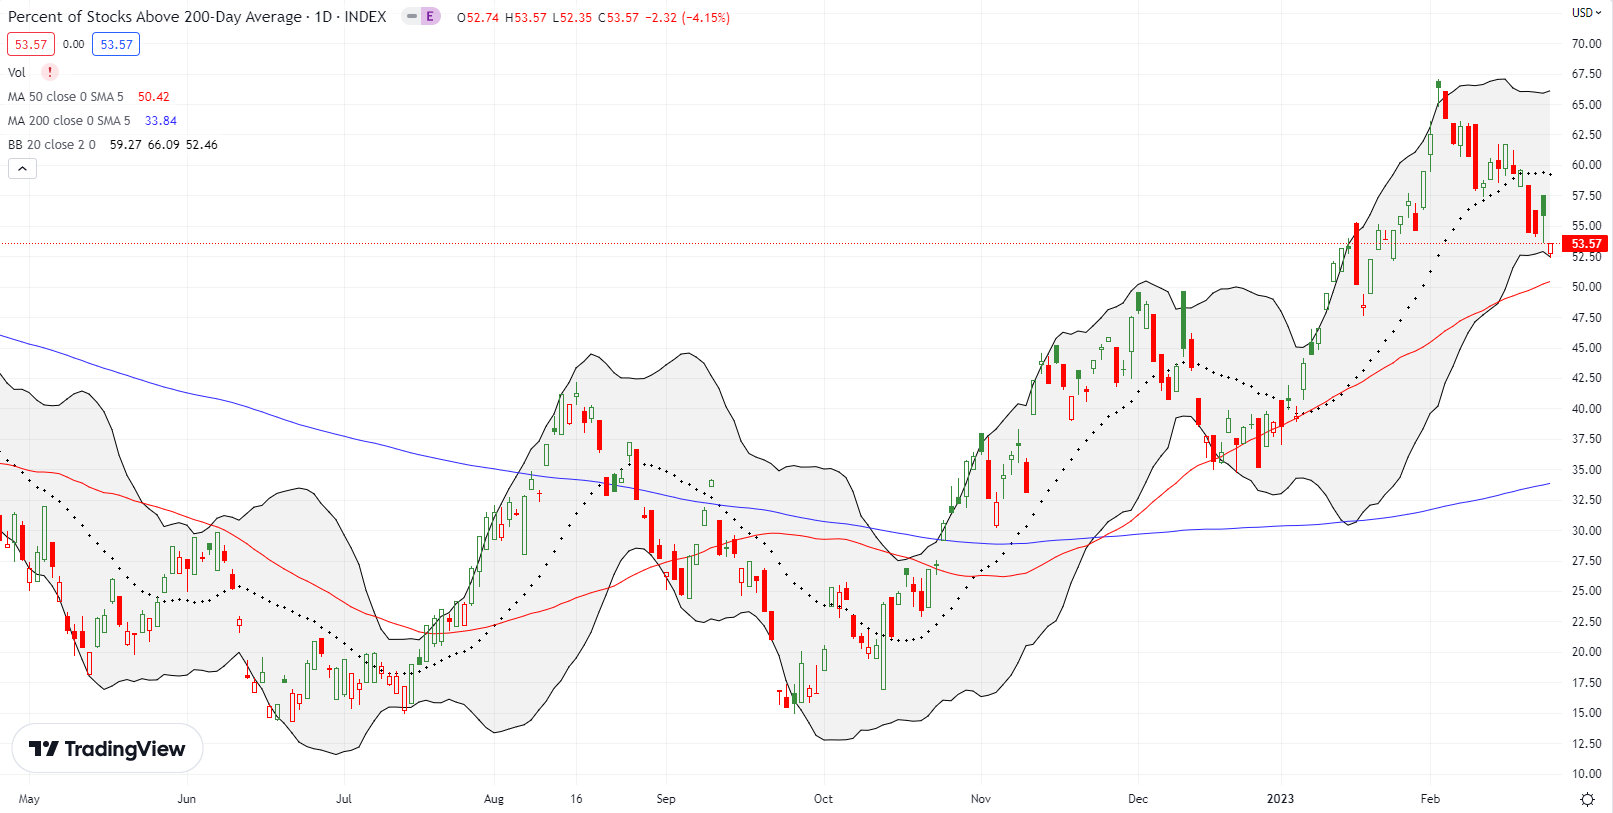
- AT200 (MMTH) = 53.6% of stocks are trading above their respective 200-day moving averages
- Short-term Trading Call: bearish
AT50 (MMFI), the percentage of stocks trading above their respective 50DMAs, definitively confirmed the end of overbought conditions when it started the week with a plunge from 69.5% to 56.4%. Per rule and following my earlier plan, I flipped the short-term trading call to bearish. My favorite technical indicator seemed to answer the question of the first 6 weeks of the year with a declarative conclusion: fakeout. I skipped over the “cautious” option for the short-term trading call given the confirmations of false breakouts and related resistance levels. However, given the on-going fight at lower support levels, I suspect trading in the coming days will deliver fresh choppiness and seesaw action. The VIX’s confirmed bottom gives me more confidence in the bearish call.
A return to overbought conditions would send me back to neutral. If AT50 drops below 40%, I will ease up to a cautiously bearish call. I will of course flip bullish on oversold trading conditions with AT50 below 20%.
Key individual stocks show the importance of the early February peak.
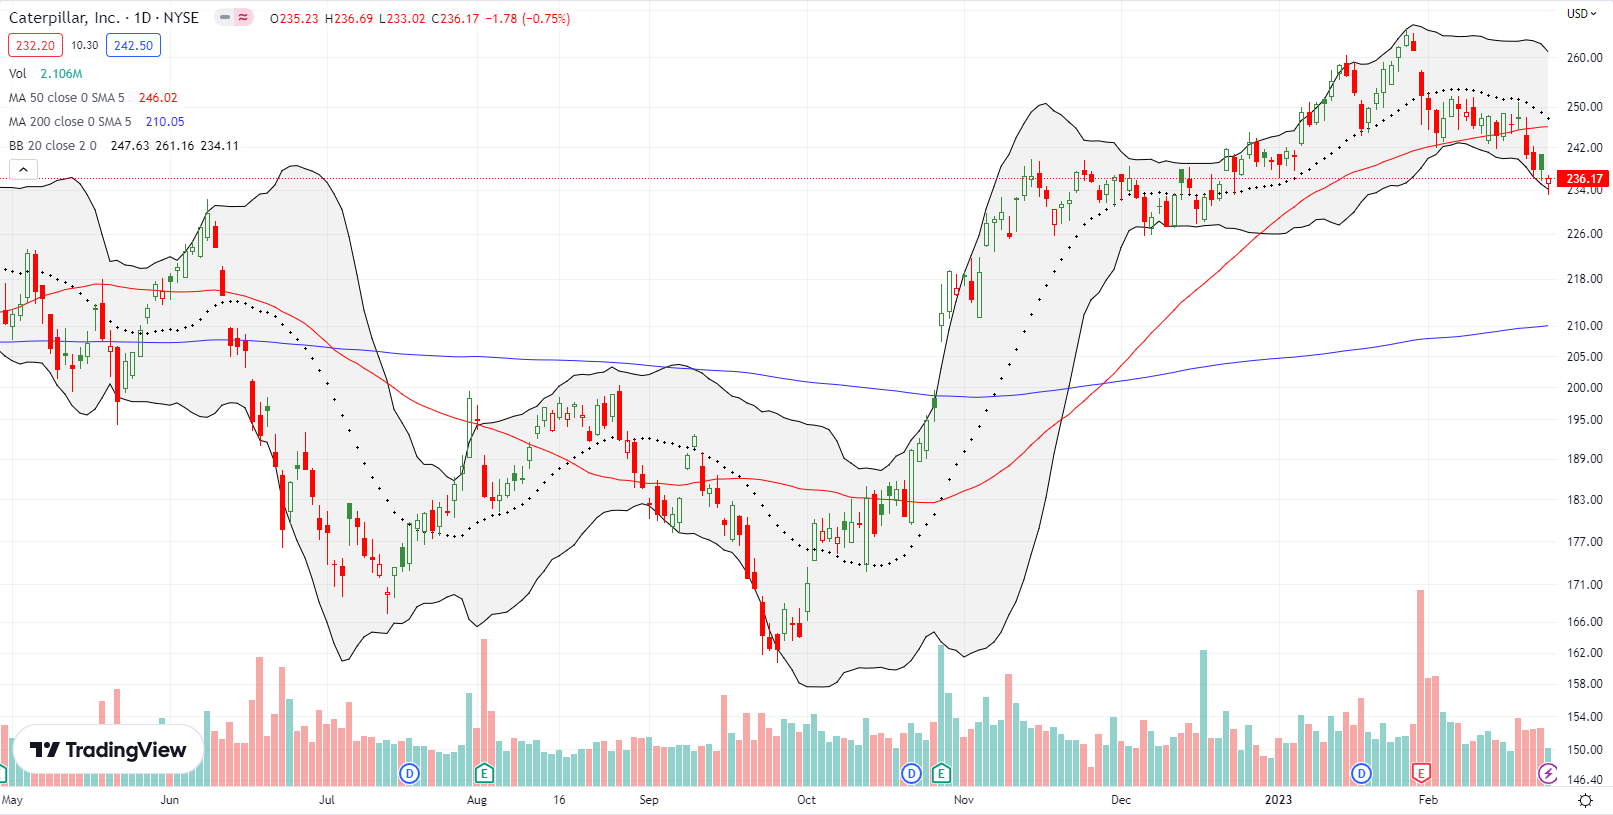
Caterpillar (CAT) reached an all-time high on January 27th. In retrospect, a 3.5% post-earnings loss 4 days later seemed to signal the coming peak for the major indices. It took two more weeks of choppy trading to weaken 50DMA support enough to drive the next breakdown. CAT bearishly answered the question for the first 6 weeks of the year with a complete reversal of its gains. CAT is down 1.4% year-to-date.
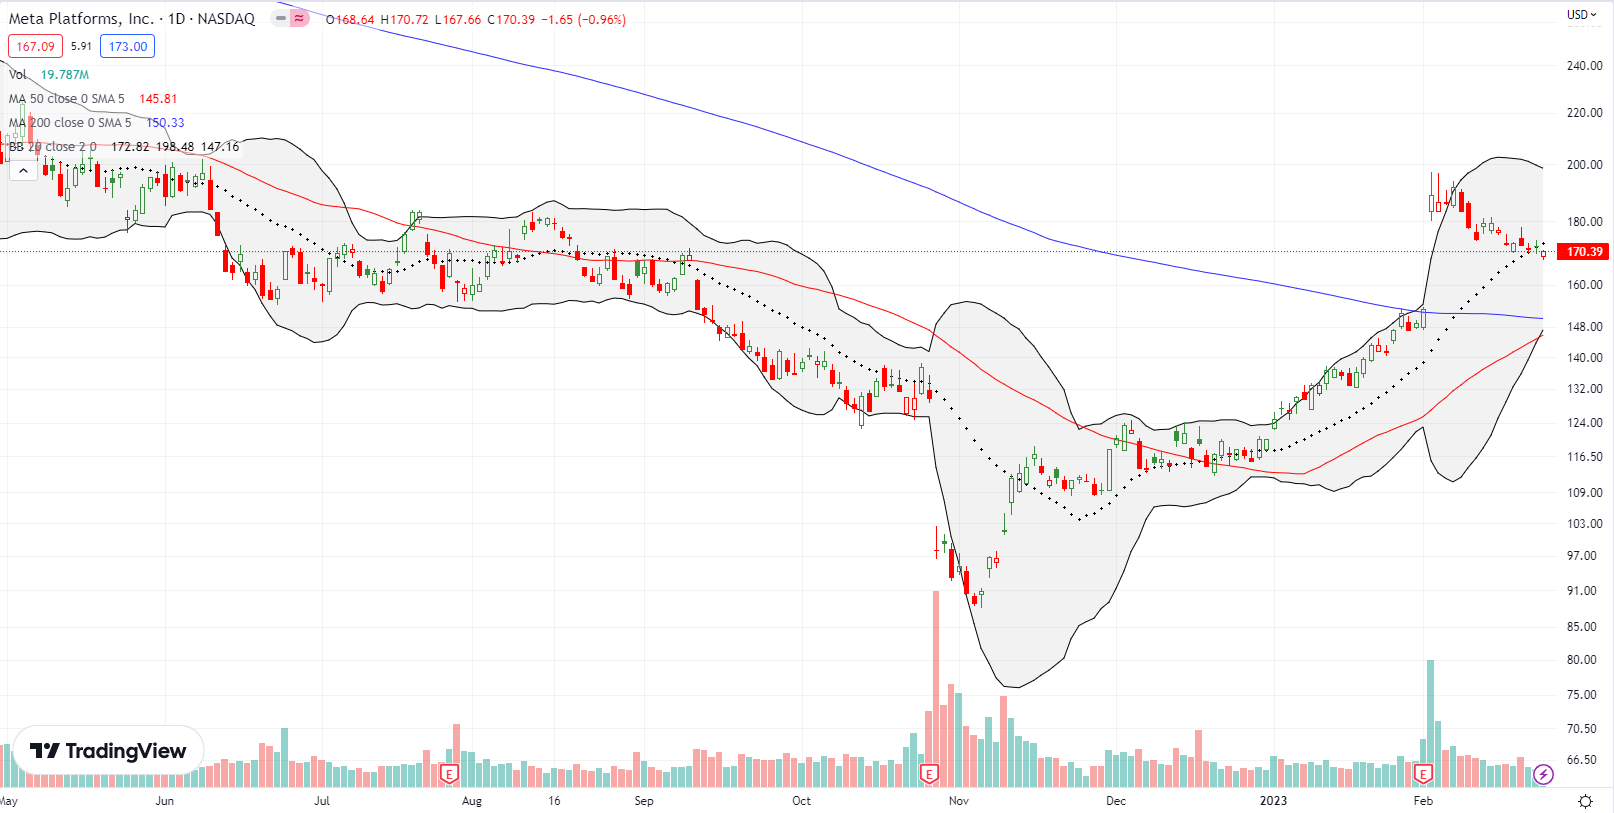
Meta Platforms, Inc (META) seems to be on track to reverse all its post-earnings gains as so many stocks have done in February. Over two weeks ago I sniffed out the top in META and opened a March put spread. The subsequent decline is not as steep as I expected, but META still seems on track to reverse its post-earnings gain by options expiration. A close above $180 or so would kick me out of the trade.
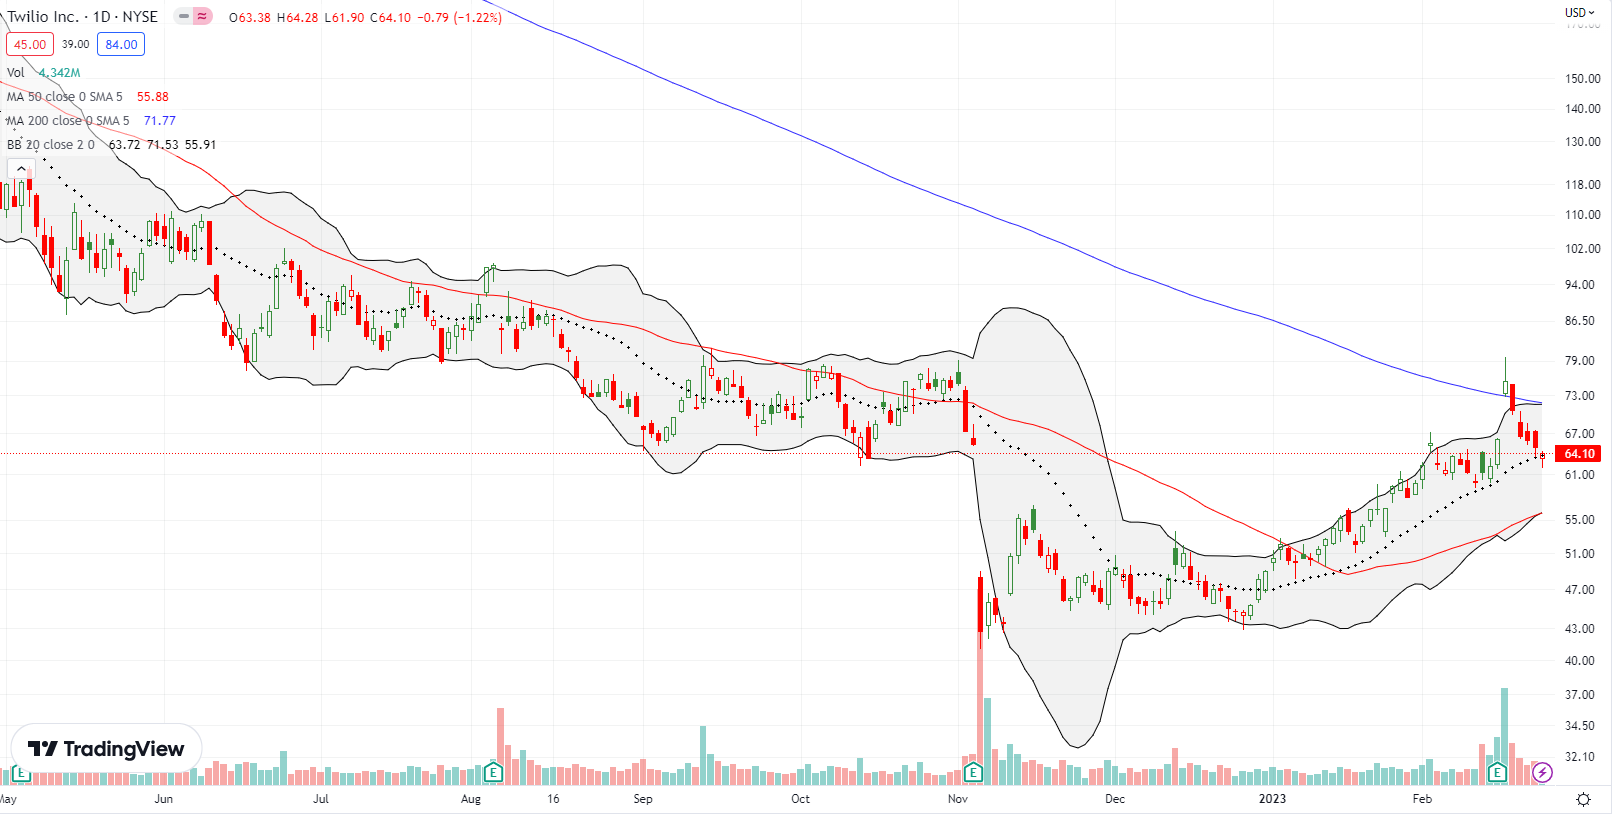
My skeptical pre-earnings trade in put options on Twilio (TWLO) could have waited for the 14% post-earnings pop. Sellers have relentlessly pressured TWLO since then despite the CEO’s purchase of shares and a massive buyback announcement. With those post-earnings gains now gone, the stock is struggling to hold uptrending 20DMA support. I looked out over the horizon of my bearish short-term trading call and bet on the eventual victory of the company’s buyback. I bought a July 70/85 call spread.
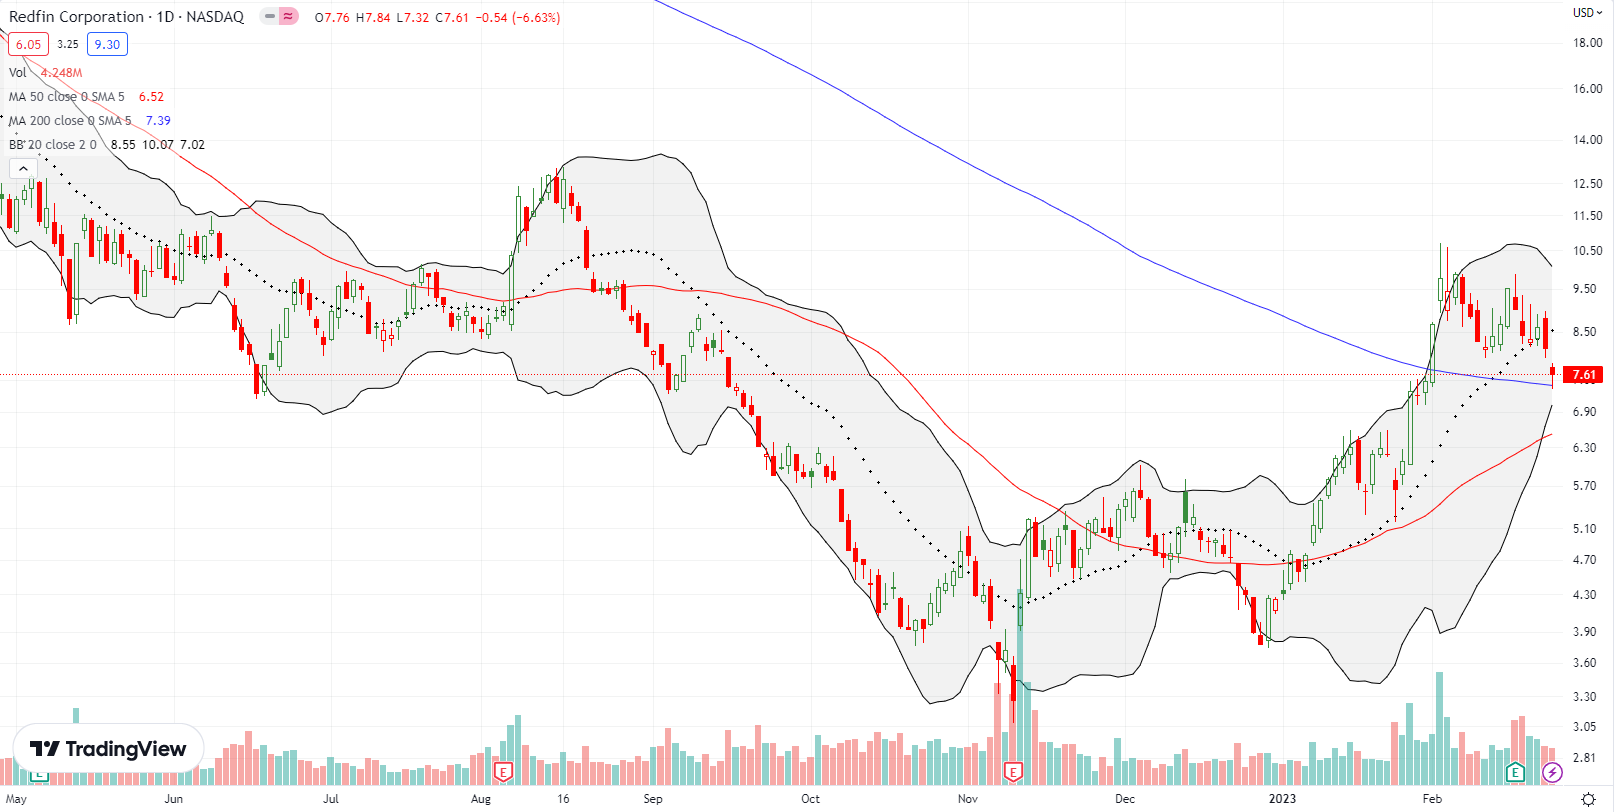
Sellers also ignored the typically bullish signs of insider stock purchases in digital realtor Redfin Corporation (RDFN). RDFN lost 7.6% on Friday despite news of a sizeable $305K purchase of 35,335 shares by the CEO. The stock is a tempting buy after rebounding slightly from 200DMA support. However, I think near-term upside from these levels is limited, so I will stay patient given short-term bearish trading conditions.
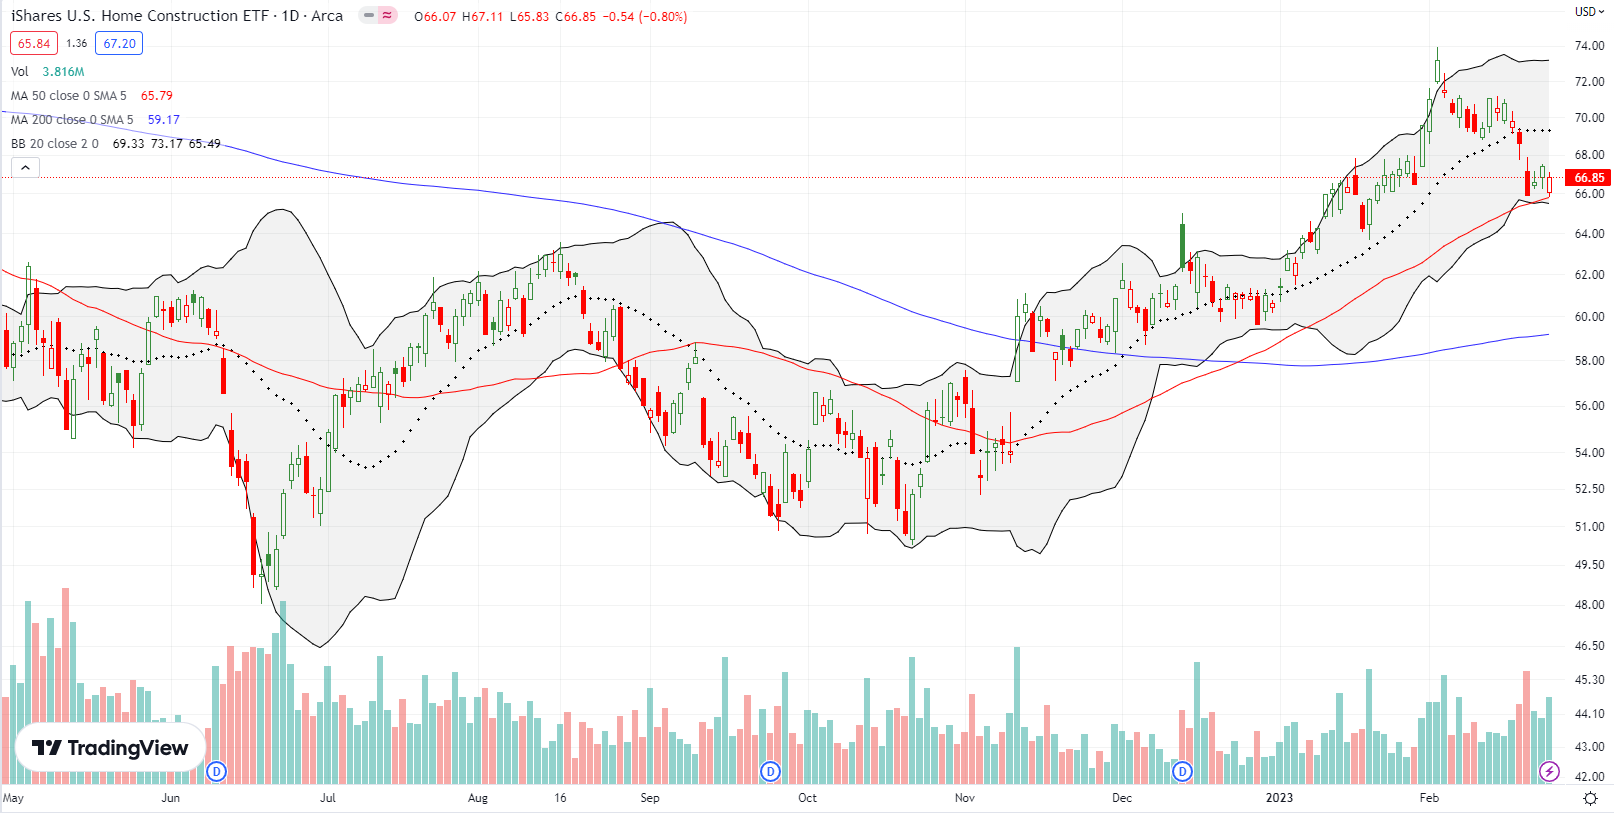
I published a video to explain the importance of the uptrend in the iShares US Home Construction ETF (ITB) (it’s a little more colorful on instagram). The early February peak is quite clear in ITB. The subsequent selling validates my call to close out trades on the seasonal strength in home builders. While it is tempting to dive back in at 50DMA support, I think this uptrend is fragile.
Be careful out there!
Footnotes
Subscribe for free to get email notifications of future posts!
“Above the 50” (AT50) uses the percentage of stocks trading above their respective 50-day moving averages (DMAs) to measure breadth in the stock market. Breadth defines the distribution of participation in a rally or sell-off. As a result, AT50 identifies extremes in market sentiment that are likely to reverse. Above the 50 is my alternative name for “MMFI” which is a symbol TradingView.com and other chart vendors use for this breadth indicator. Learn more about AT50 on my Market Breadth Resource Page. AT200, or MMTH, measures the percentage of stocks trading above their respective 200DMAs.
Active AT50 (MMFI) periods: Day #90 over 20%, Day #86 over 30%, Day #35 over 40%, Day #35 over 50% (overperiod), Day #4 under 60% (underperiod), Day #6 under 70%
Source for charts unless otherwise noted: TradingView.com
Full disclosure: long QQQ put spread, long TWLO call spread, long META put spread
FOLLOW Dr. Duru’s commentary on financial markets via StockTwits, Twitter, and even Instagram!
*Charting notes: Stock prices are not adjusted for dividends. Candlestick charts use hollow bodies: open candles indicate a close higher than the open, filled candles indicate an open higher than the close.


