
Stock Market Commentary
A great stock market divergence clarified itself last week. Growth stocks, especially the expensive and/or speculative kind, took a back seat to industrial and consumer names and other stocks primed to benefit most from the global economies reopening on a fresh wave of liquidity. This divergence renders a generalized view of the stock market less useful than a surgical one. Stocks and indices above their 50-day moving averages (DMAs) remain participants of the bull market and beneficiaries of money sloshing around in the system. Those under their 50DMAs are questionable. Finally, stocks and indices below their 200DMAs are in bearish territory and likely would be doing a lot worse if not for the memories of recent momentum.
The Stock Market Indices
The S&P 500 (SPY) ended the week with an all-time closing high. Led by energy, financials, and other reopening stocks, the index pushed away from its most serious test of 50DMA support (the red line below) since last October’s breakdown. Although the S&P 500 is firmly back in bullish mode, I bought a new May put spread as a partial backstop against sudden, negative surprises in the middle of the stock market divergence.
The NASDAQ (COMPQX) rallied back for most of the week but printed a new bearish pattern. On Thursday, the tech-laden indexed managed to peak above 50DMA resistance. However, the NASDAQ met a new challenge from a now declining 20DMA (the dotted line below). On Friday, buyers defended the lows of the day despite the 50DMA breakdown, but the NASDAQ still lagged the other major indices which printed gains on the day. If the NASDAQ breaks down below Friday’s low I plan to chase the fresh downward pressure with QQQ put options. A close above the 20DMA sets the NASDAQ up for an on-going recovery.
The iShares Trust Russell 2000 Index ETF (IWM) now looks as bullish as ever. It helps symbolize the great stock market divergence as reopening stocks leave growth and high-tech stocks behind. IWM closed the week with two all-time highs in a row. Despite declining trading volume all week, buyers scooped up the “bargains” in the land of small caps. Smaller companies stand to benefit greatly from a reopening economy as they have suffered against the capital and dominance of larger companies during the pandemic-related lockdowns.
The Select Sector SPDR Trust Financial (XLF) essentially ignored all the fuss causing churn with high-tech stocks. Along with IWM, XLF is leading the great stock market divergence.Trading last week included three all-time highs for XLF. Recall that financials benefit from higher interest rates and a steepening yield curve in particular. Banks can make more margin by lending long and borrowing short. I still wonder what happens in the accounting for the trillions loaned out at historically low rates. What happens if loan growth at higher rates slows down…?
Stock Market Volatility
The volatility index (VIX) lost out in the bear-bull battle. Yet again, the VIX proved unable to stay aloft for more than a few days at a time. The faders put in some serious work last week by driving the VIX from Monday’s gap up to 27.6 to Friday’s close at 20.7. As a reminder, a VIX below 20 would signal fresh fuel on the way for bullish sentiment. Until then, I am content to bet on the next temporary pop in volatility.
The Short-Term Trading Call In A Stock Market Divergence
- AT40 (T2108) = 63.9% of stocks are trading above their respective 40-day moving averages
- AT200 (T2107) = 87.3% of stocks are trading above their respective 200-day moving averages (TradingView’s calculation)
- Short-term Trading Call: neutral
AT40 (T2108), the percentage of stocks trading above their respective 40DMAs, spent the week creeping toward the overbought threshold of 70%. The potential double bottom in the low 40s from the previous week worked out well for my favorite technical indicator. That bottom triggered the great stock market divergence as the S&P 500, IWM, and XLF raced ahead. However, now I am on alert for fresh bearish signals. The most powerful signal would be a failure of AT40 to break through the overbought threshold. The stock market divergence could converge to the downside at that point.
While I have focused bearish trades on growth and high-tech, I am very mindful that at some point market sentiment can and will shift sharply in favor of these stocks again. Thus, I am paying more attention to now famed investor Cathie Wood. Wood provides regular updates on her research, trading, and market positioning. The video below from last week absolutely fascinated me. I like Wood as a non-conventional thinker; I particularly liked her digs at conventional analyst thinking. Wood personifies investment in innovation and disruption.
Institutional investors like Wood are very important. They provide defensible floors in their stocks and are not easily shaken from their positions. So buying dips in names that have their support can generate great returns. Similarly, when these favorites fall out of favor, the short opportunities can produce rapid gains on bearish positions as in the current stock market divergence.
As I noted in the previous Above the 40 post, the currency market barely participated in the bear-bull battle. The Australian dollar versus the Japanese yen (AUD/JPY) proceeded to rally the entire week. AUD/JPY provided clear confirmation of overall bullish sentiment. Now, this indicator of risk sentiment is trading at a 3-year high. Still, I am maintaining a neutral short-term trading call until: 1) tech stocks rejoin the rally (like the NASDAQ confirming a 20DMA breakout, 2) an oversold reading on AT40 (below 20% or “close enough”)
Stock Chart Video Reviews
Stock Chart Reviews – Below the 50DMA
MongoDB (MDB)
Database provider MongoDB (MDB) reported “mixed” results for its earnings report last week. In this environment where traders and investors (partially) care about valuations such news is underwhelming. MDB initially gapped up about 3% but proceeded to lose 5.6% at the close. However, buyers came back in force the next day with an 11.1% surge. This kind of impressive turnaround is the kind of stuff that marks the end of selling pressure…at least in a bull market. I have MDB on my radar for a continued rebound to 50DMA resistance. A 200DMA breakdown would be very bearish. MDB still does not turn a net profit and sells for 33 times sales.
Netflix (NFLX)
For a brief moment, Netflix (NFLX) looked like it would break out from its extended trading range. A 16.9% post-earnings surge did the trick. I was quite surprised to see sellers quickly take NFLX back into its trading range. The recent sell-off took down companies that benefited greatly from the behavior changes of the pandemic. Sellers took advantage and finished the job of reversing NFLX’s post-earnings gains. NFLX even closed below its 200DMA for the first time in almost a year. With the excitement squeezed out, NFLX looks ready to continue churning in a trading range, perhaps pivoting around its 200DMA.
iShares J.P. Morgan USD Emerging Markets Bond ETF (EMB)
I started watching the iShares J.P. Morgan USD Emerging Markets Bond ETF (EMB) as a potential sign of stress in emerging markets. With a timely buy into the iShares MSCI Brazil ETF (EWZ) and an on-going interest in Jumia Technologies (JMIA), I am very interested in seeing whether emerging market bonds can stabilize after a steep sell-off. I will start to worry if EMB breaks below last week’s low. EMB is already in a bearish position with a 200DMA breakdown below the previous 9-month trading range.
Nutanix (NTNX)
Another victim of the post-earning fade, Nutanix (NTNX) slid with the rest of high-tech. Like so many similar stocks, NTNX wrestled with 200DMA support last week. After a small rebound, I bought back into the shares. I first made the case for NTNX last July. As with my previous trade, I am willing to accumulate on further weakness. Nutanix is not currently generating a net profit, but it sells at just 4.1 times sales.
Qualcomm Inc (QCOM)
I found another irresistible 200DMA rebound in mobile technology company Qualcomm (QCOM). QCOM started the week with a 5.1% loss that took the stock through its 200DMA. Buyers turned around the stock the very next day. I jumped into call options the next day. I felt like a genius on Thursday’s 3.0% gain. QCOM lost 1.3% on Friday.
NVIDIA (NVDA)
A week ago, I noted a plan to chase NVIDIA (NVDA) on a 200DMA breakdown with put options. The stock market gave me the opportunity with a convincing 7.0% loss on Monday. NVDA broke its trading range and closed at a 7-month low. Given the large volatility premium on options, I opted for a March $410/April $400 calendar put spread. NVDA’s subsequent rebound quickly rendered the short side near worthless, so I covered it on Friday.
With NVDA apparently surviving its major breakdown, I am now holding the April put as a backstop (hedge). Note well that while a drop toward $400 in a month looks like an outlier, I submit that at NVDA’s February breakout to all-time highs, a subsequent 145 point plunge in just over three weeks looked similarly beyond the possible. I chose the $410 strike for the short side for extra premium to offset the cost of the long $400 side.
Tesla (TSLA)
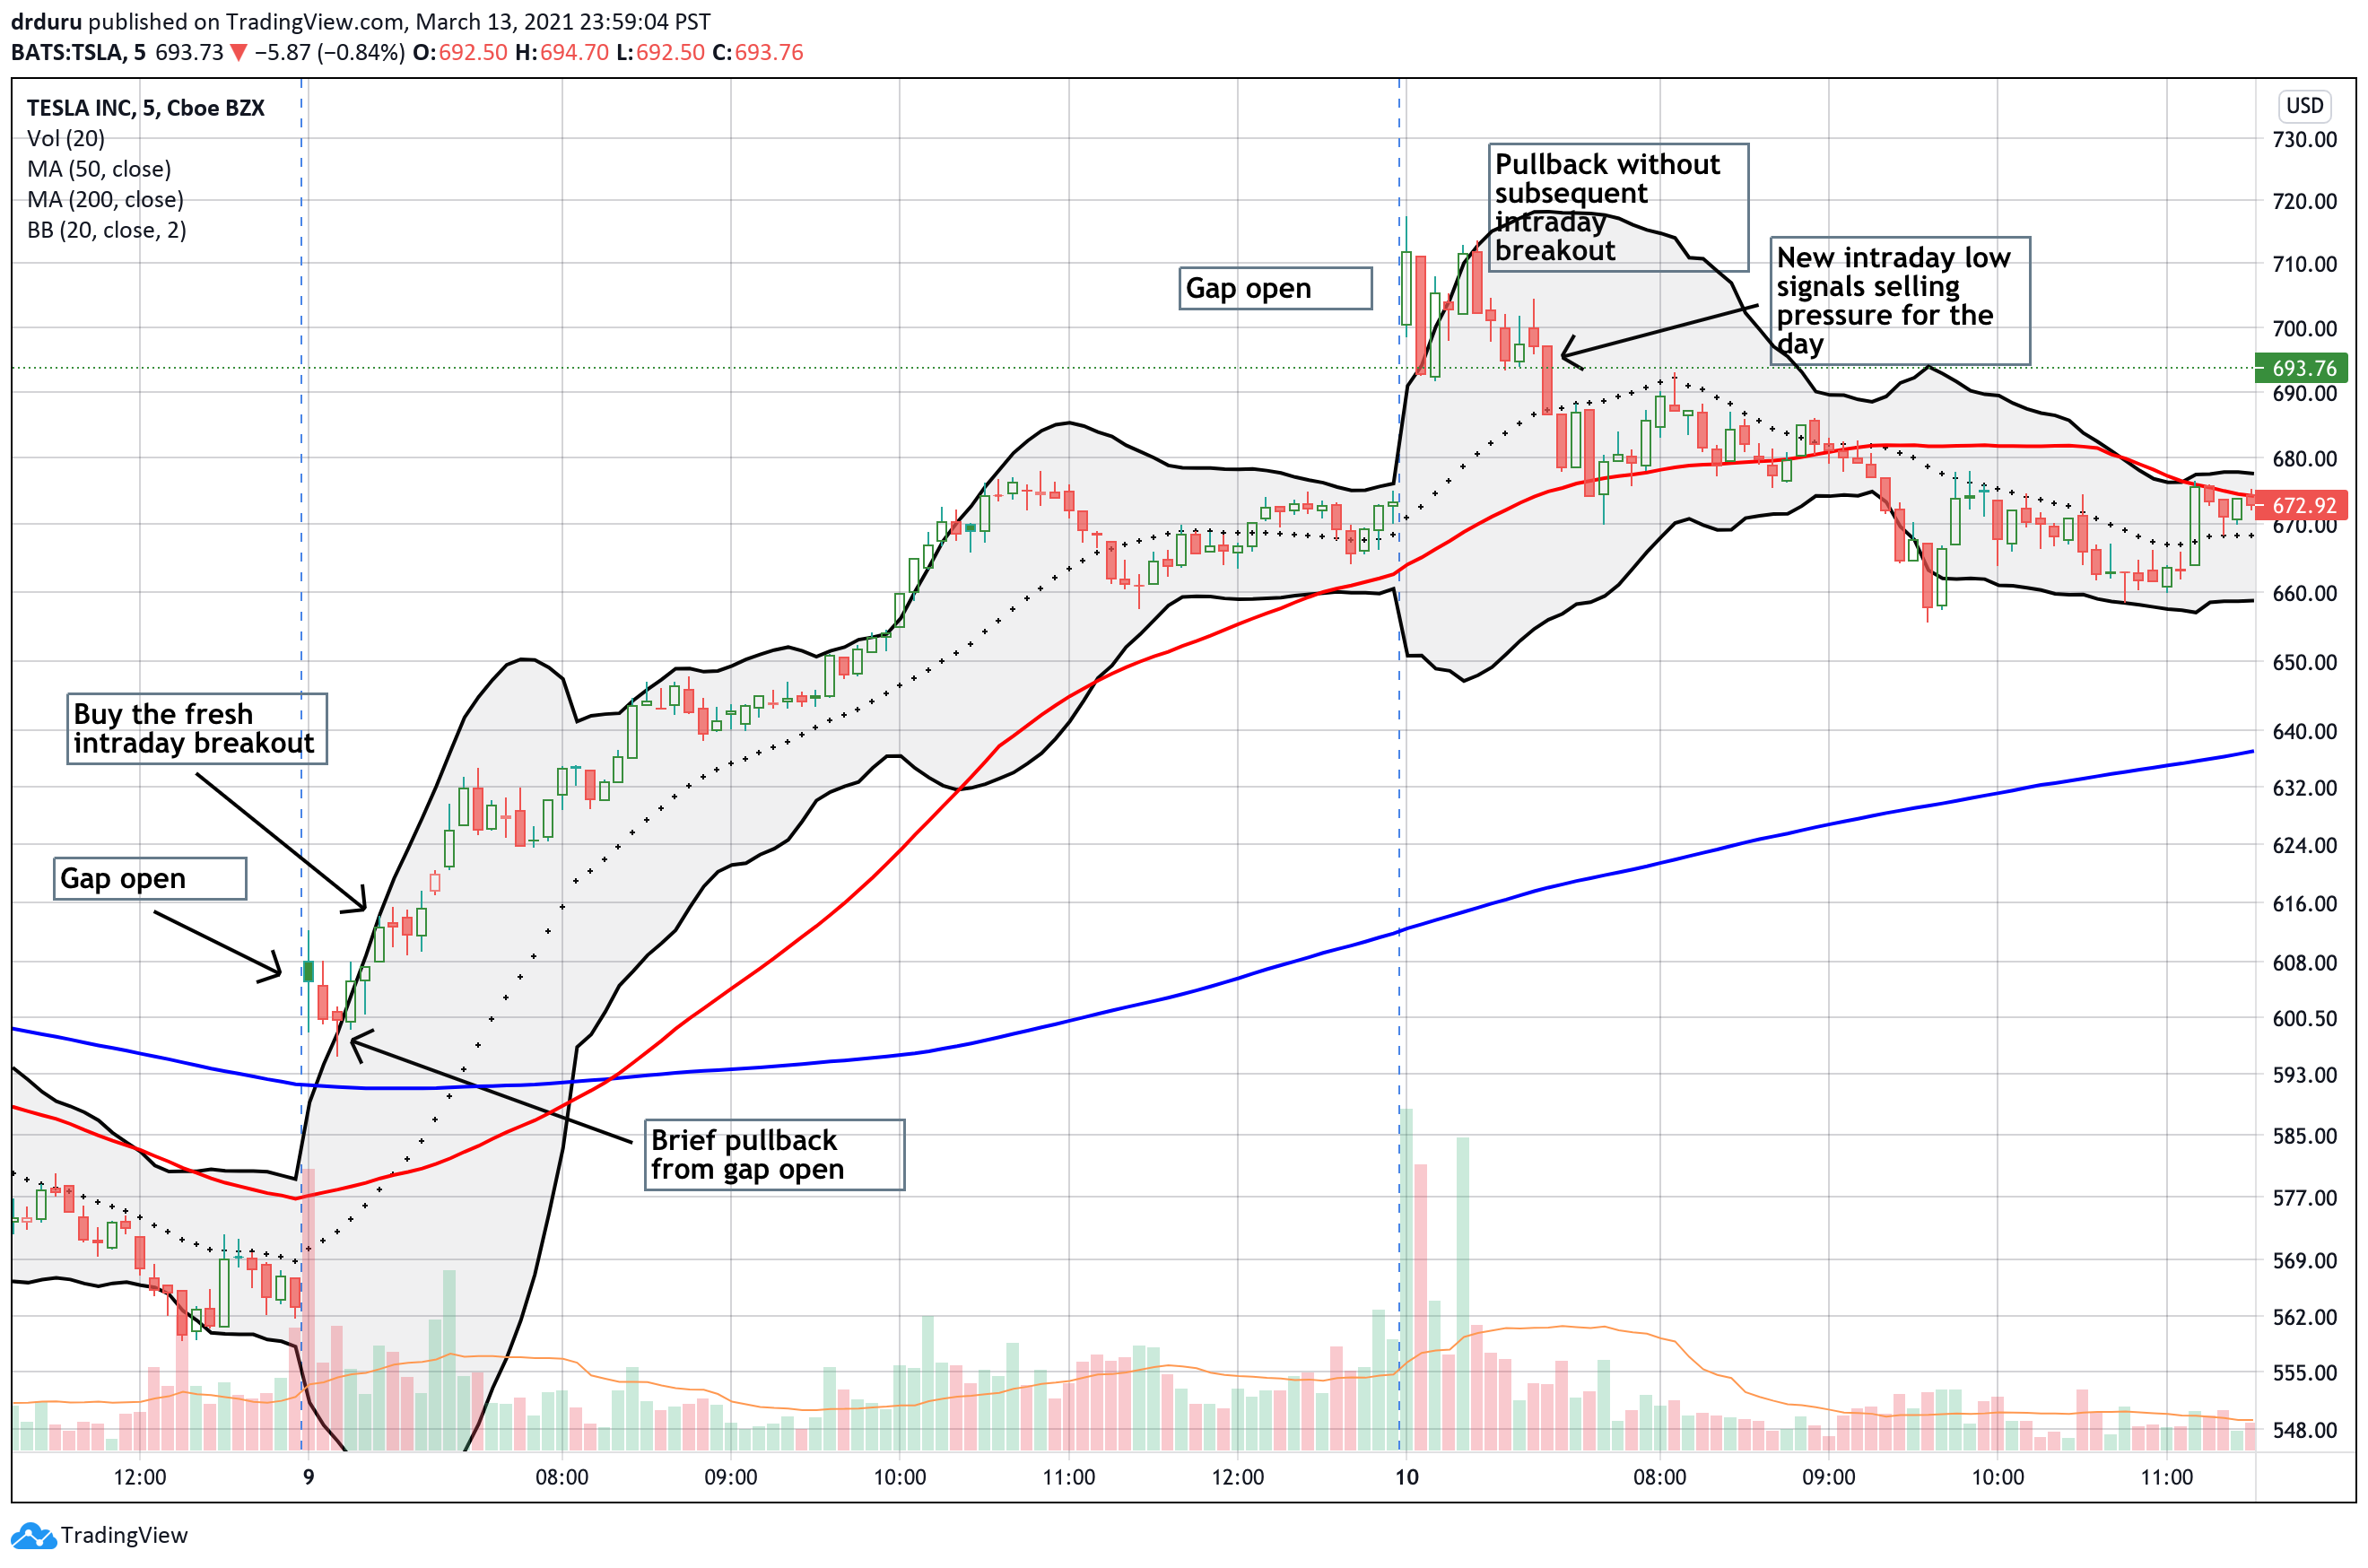
Electric car maker and solar power provider Tesla (TSLA) could be the poster child for the stark change in sentiment toward the previous favorites of pandemic investing and trading. At its worst point, TSLA fell 36.2% from its all-time high to last week’s closing low. TSLA also wiped out 80% of its gains from last November’s breakout. Still, this loss is of course a drop in the bucket compared to TSLA’s run-up since last March. Moreover, with Cathie Wood promising to produce a new TSLA price target sometime this month, it is time to try playing for a rebound. I am sure this thinking was behind the buyers who took TSLA up 19.6% the day after the lows. This quote from briefing.com sums up things quite well (emphasis mine):
“In case anyone needed a reminder of just how much money is sloshing around out there, take a look at Tesla… This is not a small stock and yet it is being pulled along as if it was a microcap play with a small float.
At its high today, TSLA was up just over 115 points or 20.4%. That’s a crazy, stupendous move for a stock that had a $540 bln market capitalization entering today. It equated to an ~$110 billion gain in market cap — not just in one day of trading but in just a little over four hours of trading!
That increase in market cap is greater than the entire market capitalization of all but 72 stocks in the S&P 500. Ho-hum… just another day in a highly liquid, policy-fueled market.”
This move is akin to a Bullish Steamroller pattern – a powerful technical trading pattern I recently learned. Buyers kept pressing the issue on TSLA for a good chunk of the day and created the steamroller. While the author of this technical pattern advises avoiding gap opens, I am taking liberties to suggest that a gap open is fine right after the stock makes a new intraday high after some kind of pullback. Indeed, I have seen this intraday Bullish Steamroller pattern in TSLA several times in the middle of overall bull runs.
An interesting twist in chasing Wood at this juncture is that she revealed she already used this sell-off to load up on TSLA to her fund’s maximum 10% allocation. In other words, other big buyers will need to step in and help defend TSLA in the middle of this stock market divergence.
Stock Chart Reviews – Above the 50DMA
BHP Group Ltd (BHP)
Shortly after paying a dividend, commodity producer BHP Group Ltd (BHP) tested its 50DMA support. I bought a fresh batch of (May) call options on Friday after seeing BHP bounce away from its 50DMA. The price of iron ore jumped again, and I fully expect the boom in commodities to continue as major economies race to devalue their currencies and distribute cash to their populations.
iShares U.S. Home Construction ETF (ITB)
The rebound in the iShares U.S. Home Construction ETF (ITB) demonstrated once again the beauty of trading rules. I made the case in my last Housing Market Review for sticking by the seasonal trade in home builders and buying the last dip. For ITB, I accumulated a sizable position in call options. I took profits as ITB approached its all-time high. ITB fell 1.2% under the weight of analyst downgrades of home builders M.D.C. Holdings (MDC) and Lennar (LEN) citing the well understood headwinds of tough comparables to 2020’s surprisingly strong performance, higher lumber costs, and rising mortgage rates. As more analysts pile on, I expect them to help bring the seasonal trade to a timely close for this cycle.
Wix.com (WIX)
Web site platform Wix.com (WIX) enjoyed a 13.9% post-earnings surge just ahead of the sell-off in growth. The sell-off helped change the interpretation of the earnings report (in other words, investors suddenly cared about how much they were paying for so little performance). Accordingly, WIX reversed all those gains in short order. Still, WIX survived a test of 50DMA support and continues to levitate. I like a buy here with a hard stop below 200DMA support and an upside target at the all-time high. So far, the stock has neatly reversed its breakout from a 7-month trading range. WIX is not yet turning a net profit and sells for 16.7 times sales.
Baidu (BIDU)
Chinese internet company Baidu (BIDU) fully participated in the great stock market divergence. At one point, BIDU was down 48.5% from its all-time high. Incredibly, that pullback was still a blip relative to BIDU’s triple from last summer. I decided to try a fade on BIDU’s bounce and bet on a fresh 50DMA breakdown and retest of the recent low. If BIDU instead rebounds, I expect tougher resistance at the now declining 20DMA.
Be careful out there!
Footnotes
“Above the 40” (AT40) uses the percentage of stocks trading above their respective 40-day moving averages (DMAs) to measure breadth in he stock market. Breadth indicates the distribution of participation in a rally or sell-off. As a result, AT40 can identify extremes in market sentiment that are likely to reverse. Above the 40 is my alternative name for “T2108” which was created by Worden. Learn more about T2108 on my T2108 Resource Page. AT200, or T2107, measures the percentage of stocks trading above their respective 200DMAs.
Active AT40 (T2108) periods: Day #103 over 20%, Day #87 above 30%, Day #85 over 40%, Day #6 over 50%, Day #3 over 60% (overperiod), Day #16 under 70%


Black line: AT40 (T2108) (% measured on the right)
Red line: Overbought threshold (70%); Blue line: Oversold threshold (20%). Source: FreestockCharts
Source for charts unless otherwise noted: TradingView.com
Full disclosure: long UVXY shares and calls, long SPY put spread, long AUD/JPY, long NTNX, long NVDA put, long BHP calls, long BIDU puts
FOLLOW Dr. Duru’s commentary on financial markets via StockTwits, Twitter, and even Instagram!
*Charting notes: Stock prices are not adjusted for dividends. Candlestick charts use hollow bodies: open candles indicate a close higher than the open, filled candles indicate an open higher than the close. TradingView.com charts for currencies use Tokyo time as the start of the forex trading day.