
Stock Market Commentary
The stock market continued its streak of trickiness. Buyers and sellers played a fierce bear-bull battle starting with one of the biggest fake-out one-day rallies since last September 2nd’s near parabolic run-up. Fresh money flowed into funds to start the month of March to for gains of 2.4% on the S&P 500 (SPY), 3.0% on the NASDAQ (COMPQX), and 3.6% for the iShares Trust Russell 2000 Index ETF (IWM). Sellers ate these gains in two days. The reversals included significant breakdowns and concentrated damage in high-tech stocks and other expensive and speculative stocks. In the midst of the carnage were a series of speeches from the Federal Reserve and the jobs report for February. Yet, the price action of the bear-bull battle speaks for itself.
The Stock Market Indices
The S&P 500 (SPY) ended the week with a 1.9% gain and, somehow, finished positive for the week. On the way there, the index suffered a breakdown at support from the 50-day moving average (DMA) (red line below) and then celebrated a fresh 50DMA breakout. The S&P 500 emerged from the week’s bear-bull battle scarred but brimming with hope.
The NASDAQ (COMPQX) severely under-performed. The tech-laden index gained 1.6% on Friday but still lost 2.1% for the week. The NASDAQ confirmed a 50DMA breakdown from the bear-bull battle, but it also ended the week with a bottoming type of hammer pattern. The hope for high-tech stocks lies in buyer follow-through. Note that long tails on hammers form shaky bottoms.
The iShares Expanded Tech-Software Sector ETF (IGV) helps tell a more focused story of the damage from the bear-bull battle. The selling was so steep that IGV almost touched its uptrending 200DMA support (blue line in the chart below) before rebounding to a 0.8% gain on Friday. IGV is down for the year and 12.8% off its all-time high.
The iShares Trust Russell 2000 Index ETF (IWM) maintained its relative strength by avoiding a close below its 50DMA in the midst of the bear-bull battle. The 2.1% gain on Friday maintained a veneer of bullishness for the index of small-cap stocks.
The Select Sector SPDR Trust Financial (XLF) remains the strongest of all. Its 1.9% gain returned the index to an all-time high. Financial stocks narrowly averted damage from the bear-bull battle.
Stock Market Volatility
The volatility index (VIX) was caught smack in the middle of the bear-bull battle. The VIX lost 11.8% for the week with a 13.7% loss on Friday. The lesson for the VIX remains that it cannot sustain large and abrupt surges. However, the VIX is now three weeks out from hitting exactly 20.0 on February 12th. The VIX has yet to look back on what seemed at the time the prelude to a very bullish breakdown of the fear gauge; the S&P 500 set its all-time high on that day. Since then, the VIX has enjoyed higher lows. Consider ourselves at least cautioned.
The Short-Term Trading Call for A Fierce Bear-Bull Battle
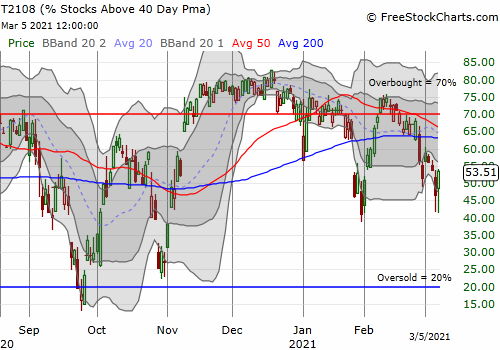
- AT40 (T2108) = 53.5% of stocks are trading above their respective 40-day moving averages
- AT200 (T2107) = 83.0% of stocks are trading above their respective 200-day moving averages (TradingView’s calculation)
- Short-term Trading Call: neutral
Just like the S&P 500, AT40 (T2108), the percentage of stocks trading above their respective 40DMAs, somehow closed higher for the week. My favorite technical indicator bounced twice off the 42% level and avoided a direct challenge of the January low. The inability of the bear-bull battle to crack this code encouraged me to switch the short-term trading call from cautiously bearish to neutral. Note I have no reason to go bullish until the market gets to true oversold levels.
This tricky market is more clearly moving at two speeds. The NASDAQ is in classic bearish position and signals that expensive, speculative stocks should still be faded on rallies. Fears of higher interest rates and inflation are hurting these stocks. Almost all my profits last week came from shorts and puts on these stocks (thanks to my bearish bias that held through Monday’s fake-out). The positions of the other indices indicate there are plenty of buying opportunities emerging from last week’s bear-bull battle. As a result, on-balance, it makes sense to take a neutral short-term stance on the stock market.
I enjoyed Jim Cramer’s colorful description of the five stages of stock market grief. We are apparently still stuck at denial with anger, bargaining, depression, and acceptance still ahead. Certainly the behavior of stocks outside of tech helps keep denial alive.
Interestingly, the currency market barely participated in the bear-bull battle. The Australian dollar versus the Japanese yen (AUD/JPY) maintained an upward bias for most of the week. I am looking for a break above or below the week’s range to provide the next clear signal on risk sentiment. Strong economic news from Australia confounded the signal a bit.
Stock Chart Video Reviews
Stock Chart Reviews – Below the 50DMA
Advanced Micro Devices (AMD)
I am watching Advanced Micro Devices (AMD) like a hawk. This stock has the potential to launch out of a 7-month trading range to higher heights….or suffer a massive breakdown that begins a reversal of the 2-week breakout and run-up that from late July. For now, AMD is clinging for dear life to its 200DMA support after its beating from the bear-bull battle. Like so many stocks on the day, AMD rebounded sharply off a steep sell-off. A second higher close gets me to speculate on an extended rebound to declining 20 or 50DMA resistance.
Amazon.com (AMZN)
Speaking of trading ranges, Amazon.com (AMZN) is desperately clinging to the bottom of its 8-month trading range. AMZN closed at $3000.46 after rebounding perfectly off the intraday low from September 21. In other words, the bear-bull battle almost pushed AMZN into bearish breakdown from its trading range. Instead, AMZN looks ready to challenge overhead 200DMA resistance after traveling 119 points off its intraday low.
Best Buy (BBY)
Keeping with the theme of clinging to the bottom of trading ranges, Best Buy (BBY) has put on quite a show since its 9.2% post-earnings plunge. Buyers tried to fill the gap down on the same day but sellers won the day. At its intraday low of the week, BBY touched the top of the big 7.8% gap-up on July 22nd. The 4.9% gain on Friday stopped just short of challenging 200DMA resistance. A close above resistance makes BBY a buy. A full reversal of Friday’s gain makes BBY a short with a target to fill July’s gap.
Chipotle Mexican Grill (CMG)
Friday’s set of dramatic rebounds created views into support levels buyers are willing to defend. For Chipotle Mexican Grill (CMG) buyers rushed in at the uptrending 200DMA. The close stopped the stock with a perfect reversal of the rebound from 50DMA support on January 5th. Still, in the short-term, I do not trust CMG beyond a test of overhead 50DMA resistance.
ADT Inc. (ADT)
Sometimes patience does NOT pay off. I made the case for buying ADT Inc (ADT) in late November. Despite securing a nice profit at the end of a 12% surge in late January, I held. The stock promptly reversed those gains and took another three weeks to bounce back in time for earnings. I still decided to sit on my recovered profits. The chart below says it all. ADT suffered a post-earnings 50 and 200DMA breakdown and is now trying to hold support from October. I probably suffered more from greed than too much patience. I kept eyeing the potential to return to the glory from last summer’s one day rocket launch higher.
3D Systems Corporation (DDD)
After reporting earnings in early November, 3D printing company 3D Systems Corporation (DDD) gained 9x in 3 months. A bearish 50DMA breakdown followed last week’s earnings. Given DDD is/was a momentum stock, it is likely to challenge 50DMA resistance before selling resumes. Over an extended period of time, I am looking for this high flyer to reverse January 7th’s doubling. A confirmed recovery of 50DMA support (two higher closes above the 50DMA) invalidates the near-term prospects for the reversal.
Editas Medicine Inc (EDIT)
Genome editing company Editas Medicine Inc (EDIT) has a stock that fell victim to the near inevitable reversal of outsized gains. EDIT had an amazing surge in December which I still do not understand. Since the January peak, EDIT has suffered selling pressure which also seems to lack specific news drivers. Regardless, the stock closed the week with a tentative recovery of 200DMA support. I will take a dip on a second higher close under the assumption of confirmed support.
Purple Innovation (PRPL)
When I saw the post-earnings headline for Purple Innovation (PRPL), I only had a vague memory about the company. The name suggests software technology. The Utah-based bedding company lost 32.6% post-earnings. Sentiment did a 180 degree turn the next day with a sharp 27.9% rebound that recovered 200DMA support. PRPL is a stellar example of the “rubber band” effect when a stock gets far over-extended below (or above) its Bollinger Band (BB) boundary. The buying volume was as heavy as the selling volume the previous day. So I have to assume this stock is back to a “buy the dip” at least back to 50DMA resistance. A fresh 200DMA breakdown would be very bearish.
Target Corp (TGT)
After reporting earnings, Target (TGT) lost 6.8% and suffered a 50DMA breakdown. Investors were apparently unhappy with all the money Target Corp will invest in the business and its employees – typical Wall Street angst. TGT is currently clinging to support from the December lows. Just as with other stocks fighting to confirm support, TGT is a decent short-term play for a rebound back to 50DMA resistance.
Walmart (WMT)
Walmart (WMT) lost 6.5% after reporting earnings and suffered its own 50DMA breakdown. Reinvesting profits into the business and its employees was another gut-wrenching theme for investors. Sellers took a rare pause on Friday with a 1.3% bounce. Incredibly, WMT dropped to an 8-month low and even trades lower than it did just one month into the coronavirus pandemic.
I have been looking for alternatives to hyper-expensive tech stocks, so I see much cheaper WMT as a juicy opportunity. I started buying at 200DMA support and added last week. This is a long-term hold.
Zoom Video Communications (ZM)
A vicious post-earnings fade for Zoom Video Communications (ZM) was a loud indicator for all things tech and expensive. ZM soared 9.6% into earnings and opened up another 7.4% after earnings. ZM closed that day down 9.0% and below its 50DMA. These kinds of fierce post-earnings rebukes are hard to find! Sellers followed up with an 8.4% loss and 200DMA breakdown. I am sitting on a March 330/310 put spread and decided to leave the position in place even as I closed out almost all my other shorts and put options.
NVIDIA Corp (NVDA)
Somehow, NVIDIA (NVDA) is stuck in a 7-month trading range. The stock briefly popped above the trading range ahead of earnings but fell in a near straight line from there. A 2.5% post-earnings gain provided a brief respite. On Friday, buyers fought back from the bottom of the trading range to save NVDA from a 200DMA breakdown. I will not wait to buy puts on NVDA if it closes below its 200DMA.
Amicus Therapeutics Inc (FOLD)
The CEO for Amicus Therapeutics (FOLD) told a good story after the stock lost 32.9% in the wake of trial results. I bought in, but clearly he did not have a good enough story to tell during earnings. The stock took a fresh leg downward from there. I treat these kinds of “bio-wreck” stocks as boom or bust, so I will just have to wait out the next catalyst(s). In the meantime, the stock made a decent attempt at a bottom on Friday with a hammer candlestick pattern that rebounded off an 11-month low.
Fastly (FSLY)
Fastly (FSLY) was one of the many expensive tech stocks that was set up for last week’s sell-off. The stock lost 15.5% post-earnings and two days later confirmed a 200DMA breakdown. I took profits on put options as the selling accelerated past the bottom of the 9-month trading range. Buyers picked FSLY off intraday lows two days in a row to hold that key support. As a trade, FSLY is now good for a bounce back to 200DMA resistance. However, a close below Friday’s intraday low sets up FSLY for a fresh wave of selling to lower support levels.
Okta Inc (OKTA)
After the 28.0% post-earnings plunge in Ping Identity Holding Corp (PING), Okta Inc (OKTA) looked vulnerable. That same day, OKTA lost 5.1% and broke below 50DMA support. OKTA confirmed the 50DMA breakdown with a 6.9% loss ahead of earnings. The stock gapped down another 6.2% post-earnings and sellers followed-up on Friday with another 4.5% loss. OKTA is more vulnerable with a confirmed 200DMA breakdown. However, even with a 17-point rebound from the intraday low, the stock remains a bit stretched with a close well below the lower Bollinger Band.
Roku (ROKU)
The main difference between Roku (ROKU) and other expensive high-flyers is that the stock remains well above long-term support at the 200DMA. When ROKU broke down below its 50DMA, I bought a calendar put spread. I did not believe sellers could follow-through that week and sure enough ROKU rebounded. During Monday’s rally, ROKU soared 6.3% and recovered from the breakdown for a day. My long weekly $360 put was flattened that day, but it soared going into the selling that created a fresh 50DMA breakdown. I took profits on Thursday. The 1.8% loss on Friday means ROKU did not quite pull off a bottoming hammer. However, if the stock pulls off a higher close, I will assume it is primed to challenge 50DMA resistance.
First Solar (FSLR)
I have been watching First Solar (FSLR) selling off steadily since its 50DMA breakdown. Since I am long-term bullish on alternative energy, and solar in particular, I focused on an entry point and not the shorting opportunity. I finally dared to buy shares on Thursday as the stock teetered on 200DMA support. After sellers flushed the stock all the way down to a 5-month low, I almost bought again. I thought better of the idea because of the bearish implications of a confirmed 200DMA breakdown. So now I just wait and watch.
Virgin Atlantic Holdings Inc (SPCE)
When Virgin Atlantic Holdings Inc (SPCE) fell back to 50DMA support in December, I decided to pass on making a new trade. That was a big mistake given the market’s bullish mood at the time. Now the stock is testing 200DMA support, and I am itching to take a swing. Despite a long rebound off 200DMA support, SPCE still lost 9.9%. My buy signal is a close above Friday’s intraday high. Otherwise, SPCE is a target for bearish bets given the way it so convincingly confirmed the 50DMA breakdown with Tuesday’s 11.5% loss. Of course, the sentiment downshift on overpaying for speculative stocks on money-losing companies carries a big risk for buying SPCE here.
Stock Chart Reviews – Above the 50DMA
Goldman Sachs Group (GS)
Along with other financials, Goldman Sachs survived last week’s selling pretty well. GS lost just 0.6% on Friday and is just a percent or so off its all-time high. The stock is streaky so buying the dip means waiting for a sustained sell-off like the one after GS reported earnings in January.
Alphabet Inc (GOOG)
The big cap tech stocks fell from grace in one way or another….except Alphabet (GOOG). GOOG remains well above uptrending support from its 50 and 200DMAs. The stock is pivoting around its 20DMA just below its all-time high. A Bollinger Band squeeze opened up last week, but it quickly fizzled into nothing. GOOG is one to buy the minute the stock market flips bullish again. Maybe GOOG will be one of the last stocks to sell-off before this latest selling cycle bottoms out.
Red Robin Gourmet (RRGB)
Red Robin Gourmet (RRGB) looks like a classic reopening trade. The burger joint has doubled since breaking out above its 200DMA in November. Yet, RRGB is just now reversing its entire pandemic-related losses. I made good trades on RRGB ahead of the breakout but failed to notice the truly bullish move in November. I am just happy that it looks like one of my favorite casual dining spots will survive this economic calamity.
Be careful out there!
Footnotes
“Above the 40” (AT40) uses the percentage of stocks trading above their respective 40-day moving averages (DMAs) to measure breadth in he stock market. Breadth indicates the distribution of participation in a rally or sell-off. As a result, AT40 can identify extremes in market sentiment that are likely to reverse. Above the 40 is my alternative name for “T2108” which was created by Worden. Learn more about T2108 on my T2108 Resource Page. AT200, or T2107, measures the percentage of stocks trading above their respective 200DMAs.
Active AT40 (T2108) periods: Day #98 over 20%, Day #82 above 30%, Day #80 over 40%, Day #1 over 50% (overperiod), Day #7 under 60% (underperiod), Day #11 under 70%


Black line: AT40 (T2108) (% measured on the right)
Red line: Overbought threshold (70%); Blue line: Oversold threshold (20%). Source: FreestockCharts
Source for charts unless otherwise noted: TradingView.com
Full disclosure: long UVXY shares and calls, long SPY put spread, long ZM put spread, long FOLD shares and short puts, long DDD puts
FOLLOW Dr. Duru’s commentary on financial markets via StockTwits, Twitter, and even Instagram!
*Charting notes: Stock prices are not adjusted for dividends. Candlestick charts use hollow bodies: open candles indicate a close higher than the open, filled candles indicate an open higher than the close. TradingView.com charts for currencies use Tokyo time as the start of the forex trading day.