
Stock Market Statistics
AT40 = 54.6% of stocks are trading above their respective 40-day moving averages (DMAs) (intraday low of 45.9% which was solid support in second half of July and early August)
AT200 = 46.9% of stocks are trading above their respective 200DMAs
VIX = 30.8
Short-term Trading Call: cautiously bearish
Stock Market Commentary
I thought I would be sitting on the sidelines watching the last 10% or so of a buying frenzy drive a parabolic run-up in the stock market. Instead, traders suddenly came to a screeching halt and cut off the case for a parabolic run-up.
The carnage in the stock market started on Thursday with the S&P 500 (SPY) tumbling 3.5%. Parabolic moves usually end badly, but this stock market correction was swifter and deeper than I could have expected. I did not see any specific news I want to credit with the selling. Profit-taking and buyer exhaustion are sufficient explanations.
For the first 15 minutes or so of trading on Friday, traders seemed to take encouragement in the jobs report for August. The subsequent selling in the stock market was swift but also brief. The next hour expanded the carnage to extreme levels. For example, big cap tech stocks shed 100s of billions in value in a flash. And then it stopped. For the rest of the day, “bargain hunters” fought their way back to a near flat close until 30 minutes of weakness to end the day.
The stock market delivered three elements of trading I like to play but in rapid succession. Firstly, the follow-through selling confirmed the earlier bearish signals. Secondly, the extremes at the intraday lows acted like oversold levels. Thirdly, the long road upward created a rally to fade.
The Stock Market Indices
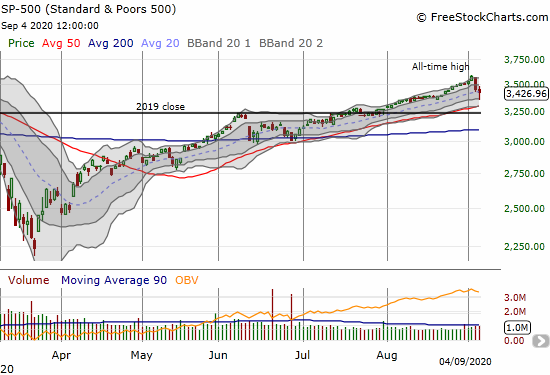
The S&P 500 (SPY) closed with a 0.8% gain. The index dropped below the previous all-time high set last February before the bargain hunters showed up. The S&P 500 ended the week precariously perched atop its 20-day moving average (DMA). The one-day parabolic in the S&P 500 became a distant memory.
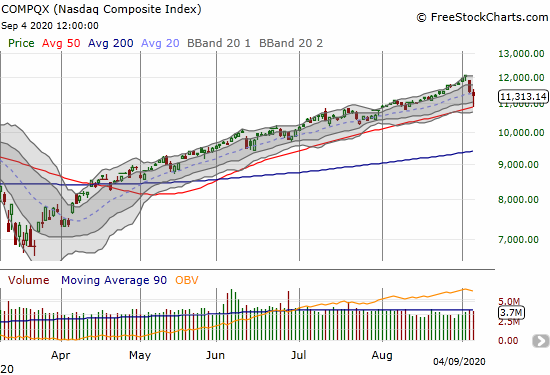
The NASDAQ (COMPQX) closed with a 1.3% loss. Moreover, the tech-laden index lost 4.3% at its intraday low. The bargain hunting started like clockwork right at 50DMA support. The NASDAQ closed under its 20DMA for the first time since July 28th and for only the third time since April 3rd. Overall, the chart below is the very definition of consistent and eager money flows.
Stock Market Volatility
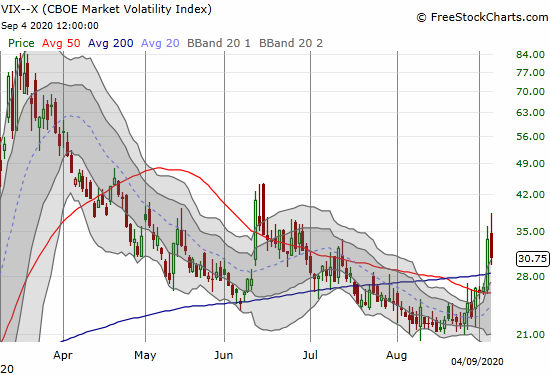
In recent posts I described the bottoming action in the volatility index (VIX). The pattern even forced me to build up a long volatility position ahead of “schedule.” On Wednesday, the VIX pulled off another small gain despite the stock market surging higher.
Thursday’s 26.5% surge sent the VIX to levels last seen in late June. After an initial jump to 38.3 on Friday, faders went back to their usual routine. As a result, the VIX closed with an 8.5% loss.
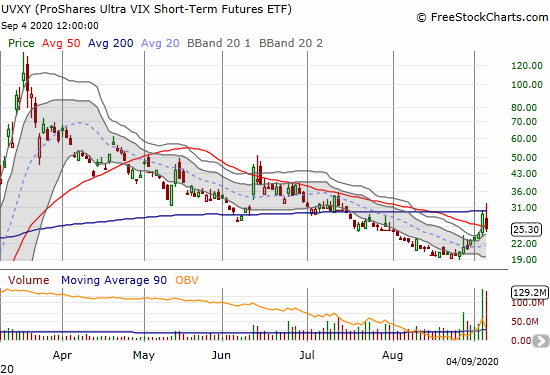
The VIX’s surge was enough to push the ProShares Ultra VIX Short Term Futures (UVXY) to a 20.0% gain. This move was extreme enough to motivate me to take profits. I missed out on Friday’s extra push higher, but I also avoided the volatility fade. As a result of the deep fade, I promptly started accumulating UVXY all over again. September through October should be full of spikes of volatility that will keep UVXY elevated.
The Short-Term Trading Call for This Stock Market
AT40 (T2108), the percentage of stocks trading above their respective 40-day moving averages (DMAs), kept me out of trouble. Accordingly, my favorite technical indicator provided a clear lens to see the underlying reality of the market. The need for mental preparation motivated my switch to “cautiously bearish” on August 22nd. Note that Friday’s close quickly erased all the gains the S&P 500 scratched out after my bearish switch. The intraday low temporarily took the index to August 11th prices.
I expect lower prices in due time. However, I remain cautiously bearish because the stock market is in the middle of a liquidity-driven mania. Conventional strategists are afraid to call it and many analysts are desperately chasing the market by inventing creative justifications for higher price targets. On the other hand, I also see more and more acknowledgement of a bubble in the making (or perhaps it is popping now).
I enter the coming week expecting the big-money funds to lock in summer profits. Accordingly, once I see the selling, I plan to resume flipping puts and shorts. I will more eagerly fade a rally on Tuesday with stops above Thursday’s highs.
Stock Market Subtext
CNBC Fast Money’s Carter Worth broke down some startling stats that speak to an over-extended and narrow market. AT40 neatly summarizes these warning signs.
- While the S&P 500 was making new all-time highs, only 13% of its components were doing so (I have yet to get stats on what we should normally expect).
- The average stock in the S&P 500 is actually down 25% from its all-time high.
- 50% of the stocks in the S&P 500 have no gains for two years.
Here is my favorite quote from this segment: “You don’t know when a fever will break, but you know what a fever looks like.”
Stock Market Props
News broke on Friday about a potential smoking gun that could explain the market’s frenzy, especially over big cap tech. CNBC reported news from the Financial Times that claims Softbank is the “NASDAQ whale” aggressively buying up out-of-the-money call options on big cap tech names.
“According to the Wall Street Journal, SoftBank had made regulatory filings showing it bought nearly $4 billion in shares of Amazon, Microsoft, and Netflix, plus a stake in Tesla. The paper quoted a source saying that SoftBank spent roughly $4 billion buying call options tied to its stock holdings, but also in other names. It then could profit from the run up in stocks and subsequently unload its position to other parties.”
Market makers hedge their risk on these options by buying stock. As a result, aggressive call buying translates into aggressive stock buying. Given the finiteness of money (until the next Federal Reserve money printing operation), this game has to come to an end at some point. When the whale’s resources and/or appetite finally reaches a climax, the whale suddenly finds out there are not enough fish left in the sea. Thus, the tide rolls out with a violent swoosh.
So the question now is whose billions are going to step into the latest breach? On Thursday alone, Apple (AAPL) lost a stock market record $180 billion in market cap with an 8.0% plunge. On Friday, AAPL lost another gut-wrenching 8.0% before bargain hunters rallied AAPL back to flat. Those are a LOT of billions sloshing around all at once!
Stock Chart Reviews: Video Summary
Stock Chart Reviews – Below the 50DMA
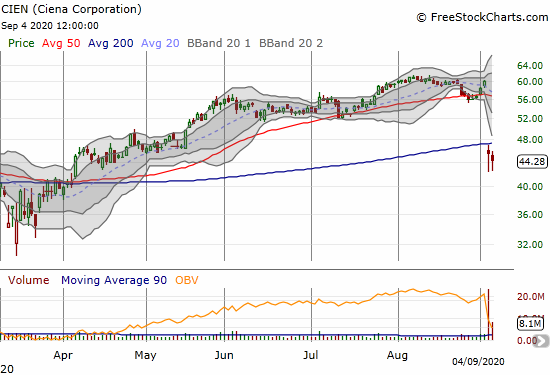
Ciena (CIEN)
Ciena (CIEN) lost a whopping 24.3% post-earnings on Thursday. The resulting combined 50 and 200DMA breakdown is quite bearish for the stock. However, so far, buyers keep picking the stock off intraday lows. A break of those lows will signal further selling ahead.
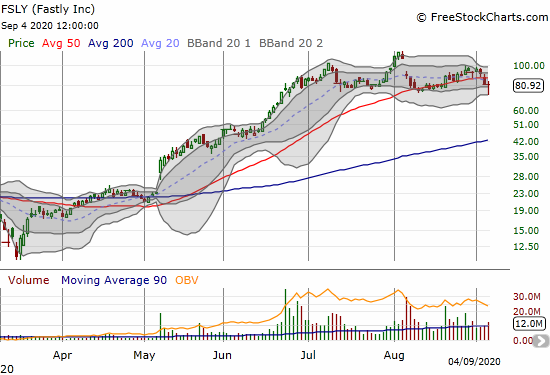
Fastly (FSLY)
At its intraday low, Fastly (FSLY) confirmed a head and shoulders top: left shoulder in early July, head at the all-time high in early August, and the right shoulder just ahead of the current sell-off. Like so many tech and momentum stocks, buyers picked FSLY off its lows. As a result, FSLY managed “only” a 1.0% loss on the day.
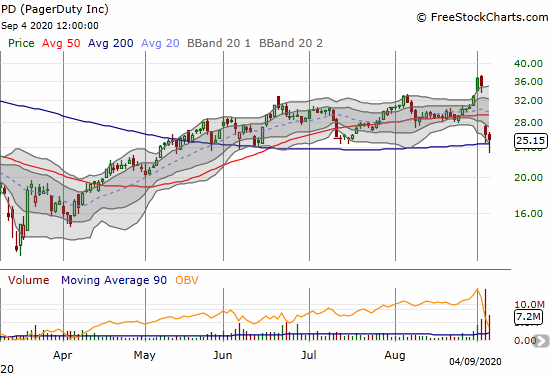
PagerDuty (PD)
PagerDuty (PD) plunged 25.8% post-earnings on Thursday. PD is now teetering on a bearish 200DMA breakdown. I asked a software engineer about PagerDuty’s software to get a feel for whether I should buy this dip in anticipation of a brighter day. He was very lukewarm, so I see little reason to stick my neck into this particular set of falling knives.
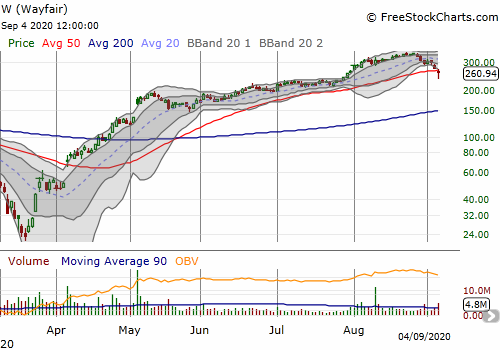
Wayfair (W)
Wayfair (W) lost 5.4% on a 50DMA breakdown. The stock pulled off an amazing 26-point rebound from the intraday low. Did that heroic effort exhaust buyers? I will be watching in the coming week.
Stock Chart Reviews – Above the 50DMA
Many stocks bounced off support at 50-day moving averages. SwingTradeBot.com has a long list of 256 such stocks. Some stocks like Square (SQ) featured very long tails, meaning that the bounce already represents a significant percentage gain. Trade these stocks with extreme caution. Buyers lucky enough to capture these moves are typically eager to lock in profits (I know I would be eager!). On the other hand, such eager buying shows counter-support that could rekindle interest in the Softbanks of the world.
Apple (AAPL)
Big cap stocks should not move in huge chunks. Yet, Apple (AAPL) pulled off three straight days of major moves. Apple’s bearish engulfing top was one of the warning signs I pointed out on Wednesday. My weekly AAPL call trading strategy (which I maintain largely independent of the short-term trading call) had me buying into Thursday’s plunge and again on Friday’s plunge. I took profits on Friday’s tranche in order to partially pay for Thursday’s adventures.

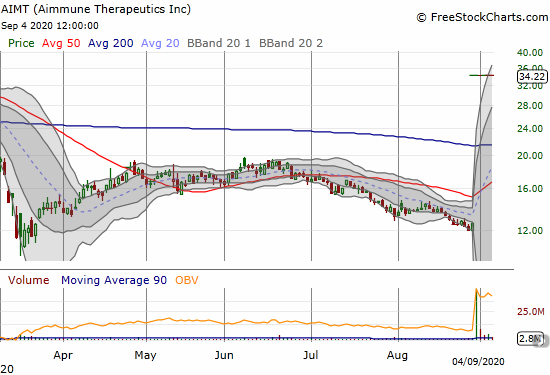
Aimmune Therapeutics Inc (AIMT)
I saw the above tweet while doing some mindless late-night Twitter scrolling. I practically fell out my seat and rushed to double confirm the authenticity of this news.
In mid-April I discussed my plan to accumulate AIMT. I bought one tranche and watched the stock go nowhere from there. As a result of the recent resumption in selling, I prepared to add another tranche of stock; I was waiting on a test of the March lows. Nestle made sure that test will never happen. Now I await the day when Aimmune’s ambitious goal to eliminate food allergies becomes a success.
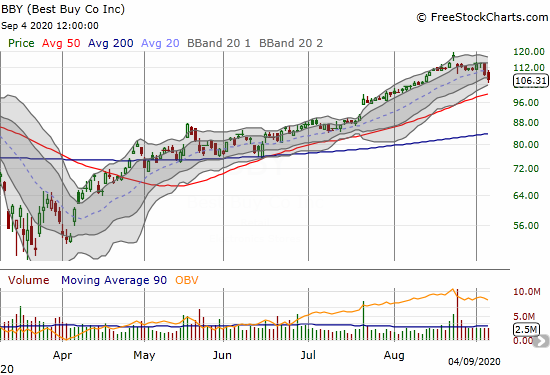
Best Buy Co Inc (BBY)
Best Buy (BBY) looks like a top in the making. For example, the stock lost 4.0% post-earnings and left behind an abandoned baby top. The last two days of selling seem to confirm the top. From here, put options make the most sense after fading a rally and/or after a 50DMA breakdown.
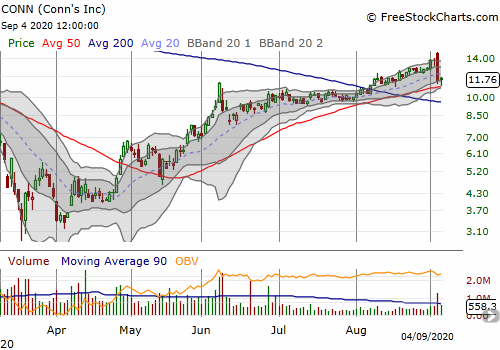
Conn‘s (CONN)
I decided to pass on Conn’s (CONN) as a breakout play because I just downgraded my short-term trading call to cautiously bearish. A post-earnings sell-off has me looking back in relief.
Salesforce.com (CRM)
Salesforce.com (CRM) is one of the select stocks I am eyeing for a buy for this sell-off. On Tuesday’s close and Wednesday’s gap open CRM looked ready to launch into an extended post-earnings rally. Like AAPL, CRM instead turned into an early warning sign.

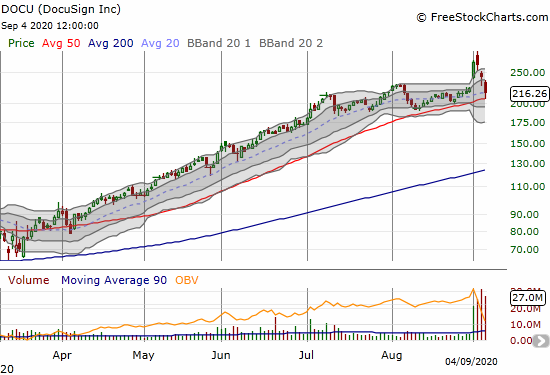
Docusign (DOCU)
“‘Trying to guess what’s going to happen on Wall Street is always dangerous. We were somewhat surprised the week before our earnings announcement to see our stock go up some 30-odd percent, and then after we announced, kind of give back all of that change that was built up before the earnings announcement,’ Springer told Yahoo Finance’s The First Trade.”
Source: Yahoo Finance
Docusign (DOCU) CEO Dan Springer made an insightful observation on the behavior of his company’s stock. Sure the post-earnings tumble was dramatic, but MORE puzzling was the parabolic run-up going into earnings. The net result is a stock the neatly tested 50DMA support. If the rest of the stock market cooperates, DOCU will resume its relentless push higher in short order.
Speaking of heavy call buying, traders tripped over themselves buying weekly calls on DOCU ahead of earnings. As a result, one Fast Money trader concluded the action represented a stock replacement strategy. The rest of the panel affirmed their affection for the digital signature company but not the stock.
I did not see this segment before I took a hedged pre-earnings position with a weekly calendar call spread at $280 and a weekly put at $210. I was looking for the same kind of extreme outcome that traders anticipated (+/- 20%!). With a 10.6% loss at the close, DOCU fell far short of options expectations. However, I was able to take profits on the put by waiting out a drop to 50DMA support. I am still holding the long side of the spread just in case wild upside action erupts in the coming week.
Fedex Corp (FDX)
So far Fedex Corp (FDX) is surviving the sell-off just fine. For example, FDX even gained 2.3% on Friday. I will be watching earnings on September 15th very closely. I suspect the stock will experience a large pre-earnings move, so I might put in a hedged options trade this week.

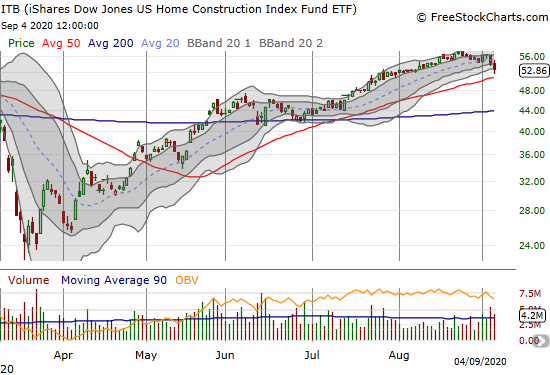
iShares Dow Jones US Home Construction Index Fund (ITB)
The iShares Dow Jones US Home Construction Index Fund (ITB) lost 2.2% and looks ready for a rest. Incredibly, the housing market evaded the pandemic recession. A more serious stock market downturn will likely cool the heels of the eager buyers in the market.
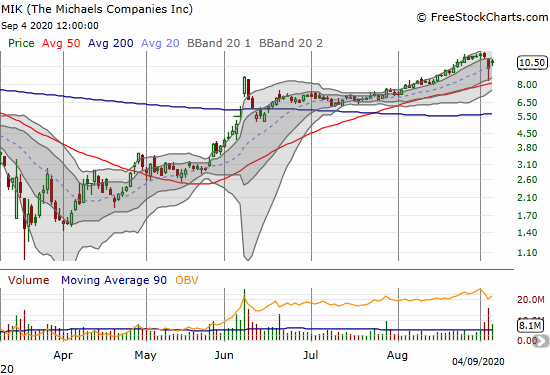
Michaels Company (MIK)
I thought of Michaels Company (MIK) as a buy-the-dip trade. The stock just kept creeping higher until the company reported earnings. MIK dropped as much as 25.6% before closing with a 13.6% loss. Subsequently, MIK rebounded another 8.3%. Now, I am even more curious about the resurrected Michaels Company story. Still, I am content to continue waiting things out.
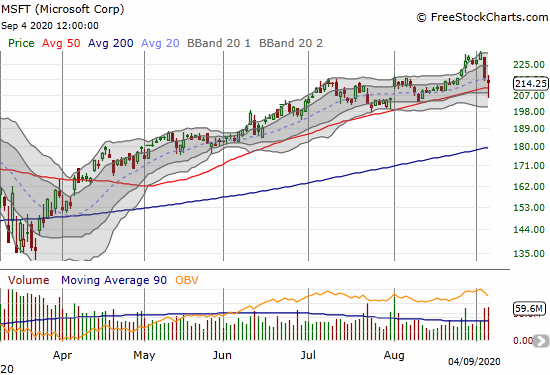
Microsoft (MSFT)
On Thursday, Microsoft (MSFT) swiftly erased its latest breakout. On Friday, the stock dropped below its 50DMA only to rebound right back. MSFT is at the top of buy list when the time comes. Of course if Softbank gets busy again, the time may be this week.
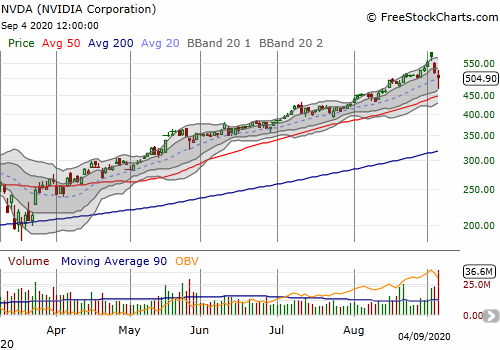
NVIDIA Corporation (NVDA)
NVIDIA Coropration (NVDA) should be at the top of every dip-buying list. However, a gap and crap and two days of follow-through selling left behind an abandoned baby top. Accordingly, NVDA is actually a bearish play until it can manage to print a fresh all-time high (or drop low for a low enough discount).
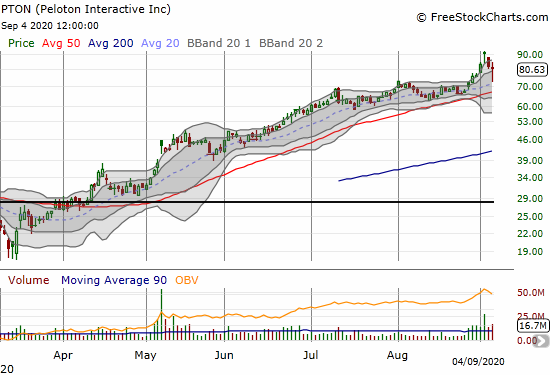
Peloton Interactive (PTON)
Peloton Interactive (PTON) may be launching a bike priced under $3000. With seemingly every wealthy person in America buying into Peloton for indoor, pandemic-safe exercise, the expansion to lower price tiers is absolutely necessary for Peloton.
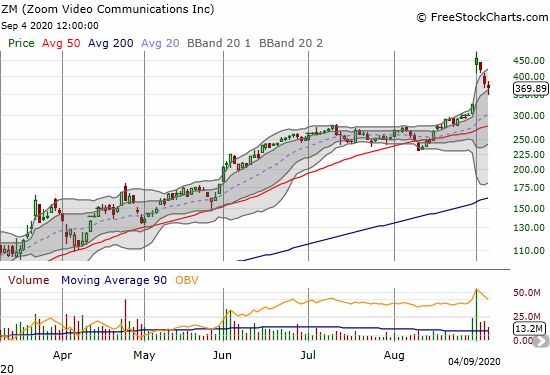
Zoom Technologies (ZM)
We all may look back at the 40.8% post-earnings gain for Zoom Technologies (ZM) as THE blow-off top of this manic era. Sellers quickly moved in to take profits: 7.5%, 10.0%, and 3.0% losses in daily succession. Buyers held the line for ZM at the lower part of its upper Bollinger Band (BB). Now I imagine the bravest bargain hunters will move right into ZM in the coming week. If ZM breaks to a new all-time high anytime in the next 3-6 months, I will be shocked.
Stock Chart Spotlight – Bullish Breakout
I am giving this section a break for now!
— – —
FOLLOW Dr. Duru’s commentary on financial markets via email, StockTwits, Twitter, and even Instagram!
“Above the 40” uses the percentage of stocks trading above their respective 40-day moving averages (DMAs) to assess the technical health of the stock market and to identify extremes in market sentiment that are likely to reverse. Abbreviated as AT40, Above the 40 is an alternative label for “T2108” which was created by Worden. Learn more about T2108 on my T2108 Resource Page. AT200, or T2107, measures the percentage of stocks trading above their respective 200DMAs.
Active AT40 (T2108) periods: Day #102 over 20%, Day #96 over 30%, Day #41 over 40%, Day #37 over 50% (overperiod), Day #2 under 60% (underperiod), Day #5 under 70%
Daily AT40 (T2108)
")
Black line: AT40 (T2108) (% measured on the right)
Red line: Overbought threshold (70%); Blue line: Oversold threshold (20%)
Weekly AT40 (T2108)

*All charts created using FreeStockCharts unless otherwise stated
The T2108 charts above are my LATEST updates independent of the date of this given AT40 post. For my latest AT40 post click here.
Be careful out there!
Full disclosure: long UVXY shares, long AAPL calls, long DOCU call
*Charting notes: FreeStockCharts stock prices are not adjusted for dividends. TradingView.com charts for currencies use Tokyo time as the start of the forex trading day. FreeStockCharts currency charts are based on Eastern U.S. time to define the trading day.