
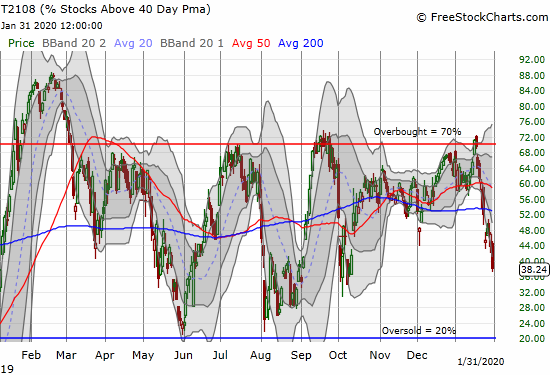
AT40 = 38.2% of stocks are trading above their respective 40-day moving averages (DMAs)
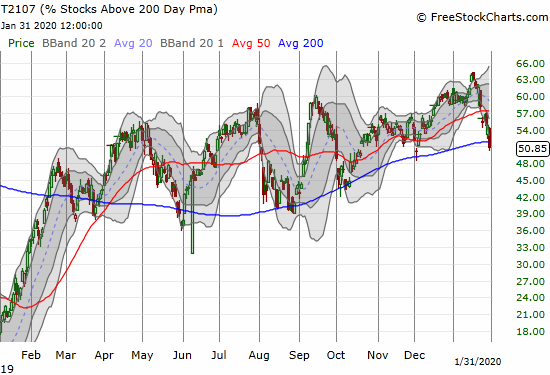
AT200 = 50.9% of stocks are trading above their respective 200DMAs
VIX = 18.8
Short-term Trading Call: cautiously bearish
Stock Market Commentary
Last week, I switched from neutral for the first time in, I believe, months. I downgraded to “cautiously bearish” because the trading action last Monday (January 27, 2020) seemed to confirm the topping pattern I described the previous Friday (January 24). The S&P 500 (SPY) also dropped below my bear/bull line of 326 on SPY. With characteristic resilience, the index bounced from there in an attempt to heal the damage, but Friday’s 1.8% loss took the index negative for the year.
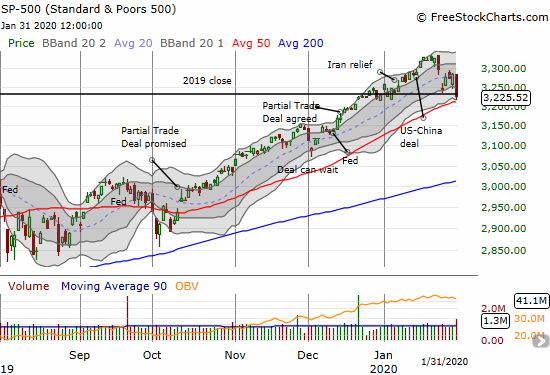
The S&P 500 is within a hair of 50DMA support. Given the importance of the previous congestion around the 2019 close, I am expecting buyers to defend 50DMA support whether it is direct or after an initial breakdown (gap down Monday anyone?). Either way, I expect the index to display the same stubborn resilience in place for the last 13 months.
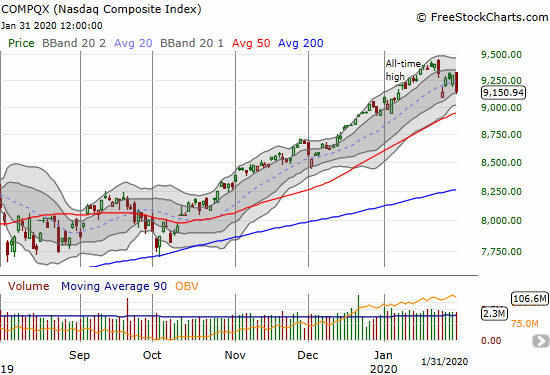
The NASDAQ (COMPQX) sold off as well but held onto its low for the week. The index looks primed to soon test its uptrending 50DMA support with yet another bearish engulfing pattern on display.
In my previous Above the 40 post, I claimed that a failure of the Fed to provide sufficient salves for the market would lead to a quick trip toward oversold conditions. Sure enough, Friday’s sell-off was deep enough to send AT40 (T2108), the percentage of stocks trading above their respective 40DMAs, below 40%. While oversold is technically below 20%, I consider the 30s to be “close enough” during a bull market.
Similarly, T2107, the percentage of stocks trading above their respective 200DMAs, continued its plunge from recent highs. Suddenly, the market is right back to a 50/50 split between stocks in bullish versus bearish positions relative to the all-important 200DMA dividing line.
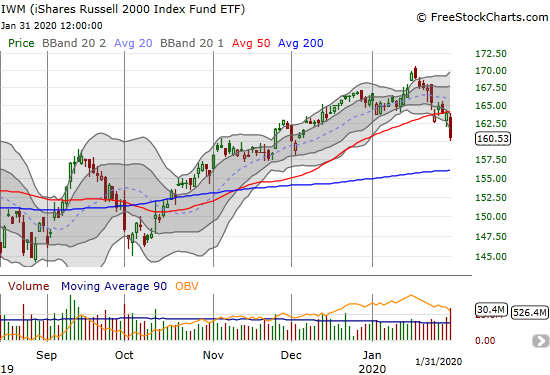
When the iShares Russell 2000 Index Fund ETF (IWM) suffered its 50DMA breakdown, I described its last run-up as an over-extended move fading in the rear-view mirror. With the 50DMA breakdown confirmed by Friday’s heavy selling, 200DMA support is in play.
Overall, the indices are less healthy and breaking down. The short-term indicators are all pointing downward with Friday displaying exceptionally strong selling pressure: 4070 decliners versus 910 advancers, 395 new lows versus 285 new highs, and, most importantly 2677 bearish signals versus 1114 bullish signals (stats from SwingTradeBot).
Volatility
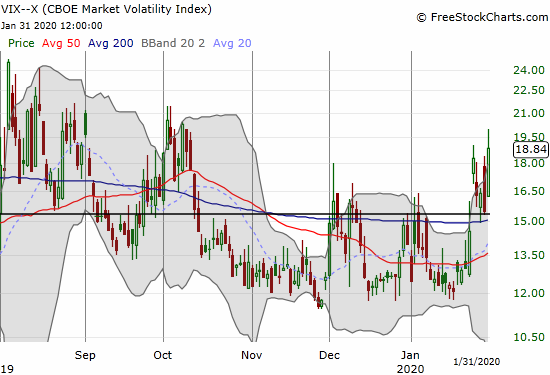
When the volatility index (VIX) surged 25.2% last Monday, I described the move as extended and noted “history says these kinds of surges are not sustainable. Even if the latest fear cycle takes the VIX even higher, it could easily pull back before gathering enough energy to hit 20 and above.” Predictably, the VIX fell back the next day. After the VIX rebounded off lows on Wednesday (Fed day) and gapped higher on Thursday, faders returned with a vengeance to close the VIX right above the 15.35. pivot line. The swing to 20 on Friday was equally sharp. I am now looking to the VIX to test the highs from August/October before this complete cycle ends. Such a move should happen in conjunction with AT40 dropping to or close to oversold (20%).
The Currency Market Speaks
The Australian dollar (FXA) versus the Japanese yen (FXY) has fallen 10 of the last 12 trading days. This handy check on the market’s underlying risk sentiment has spoken even louder than AT40. Friday’s large drop took AUD/JPY to early October levels. The currency pair is so extended now, I decided to start accumulating now ahead of the ultimate rebound when the market is coming out of or rebounding away from oversold conditions.
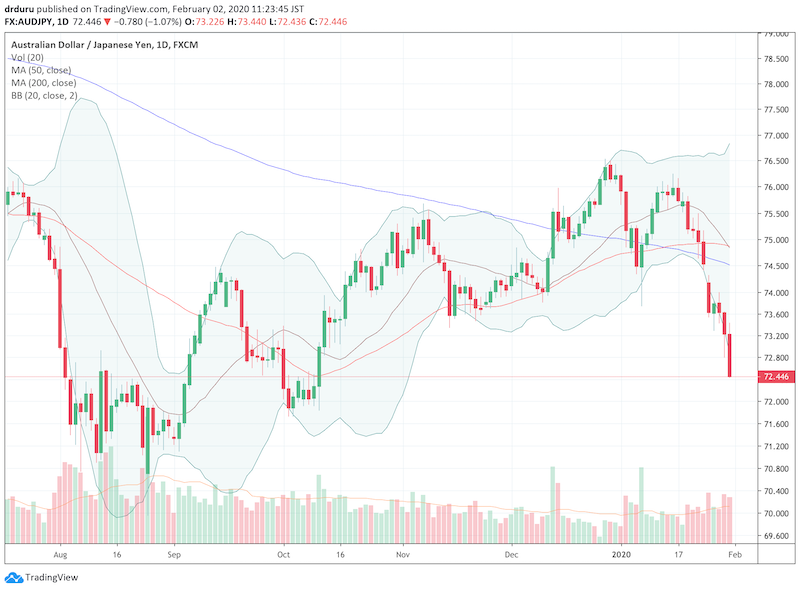
Source: TradingView.com
The Short-Term Trading Call
The rebound from Monday’s sell-off allowed me to take profits on some of my opportunistic longs while also facilitating positioning for my new bearish trading bias. Despite my bearish bias, I could not resist trying a few typical longs in Friday’s sell-off (see below). Unlike the previous Friday, I did NOT take profits on all my put options in the green. At that time I should have anticipated a gap down Monday, but I was not yet fully tuned to the bearish signals. I am inclined to take quick profits when I happen to get them on long positions.
I had to reposition my bearish SPY bets after my $320 calendar put spread closed out at its target price. Volatility surged enough to send the price of the long side surging. I was actually hoping the short side would expire worthless AND leave me with the long SPY puts for the coming two weeks. I tried a new diagonal spread configuration with the $320 strike price: short Feb 3 and long Feb 5. I am assuming a gap down would send implied volatility much higher on the long side than the short side. In other words, Monday would create enough of an additional spread to place the position into a profit. If the market quickly rebounds and/or rallies on Monday, I will still have the long SPY puts in place for a bearish reversal on Tuesday or Wednesday.
There is a lot of focus on the risks of the coronavirus, but I think predictions are futile. I scoff at pundits who get on the air and provide their reassuring words or their red siren alarms; they are mostly guessing. Market signals are sufficient for sorting through the noise. The management of the growing pandemic is following a typical pattern: spotty info, downplaying, slow concessions to containment measures, aggressive containment measures, and now growing reports all over the globe. Through it all, politicians and health officials will scramble to keep the public calm. The stock market was already posied to ignore the growing risks until it absolutely could not. Thursday’s late rally on news that the World Health Organization (WHO) finally declared a global health emergency was a classic sign that market participants are biased to buy. I guess traders and investors assumed the declaration meant the worst was already over. In reality, the declaration was more an admission that officials are only just know understanding and comprehending the full scale and scope of what is happening.
“The Committee agreed that the outbreak now meets the criteria for a Public Health Emergency of International Concern and proposed the following advice to be issued as Temporary Recommendations. The Committee emphasized that the declaration of a PHEIC should be seen in the spirit of support and appreciation for China, its people, and the actions China has taken on the frontlines of this outbreak, with transparency, and, it is to be hoped, with success. In line with the need for global solidarity, the Committee felt that a global coordinated effort is needed to enhance preparedness in other regions of the world that may need additional support for that.
From “Statement on the second meeting of the International Health Regulations (2005) Emergency Committee regarding the outbreak of novel coronavirus (2019-nCoV)” by the World Health Organization (WHO), January 30, 2020
Stock Chart Reviews – Below the 50DMA
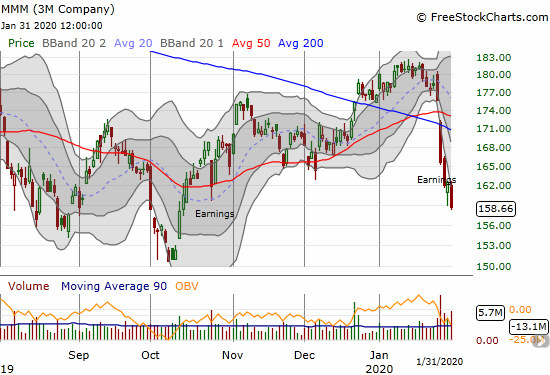
3M Company (MMM)
I have been eyeing 3M Company (MMM) as a sneaky contrarian play for 2020. The latest breakdown in the stock once again dissuaded me from taking a dip. A test of the October low is in play.
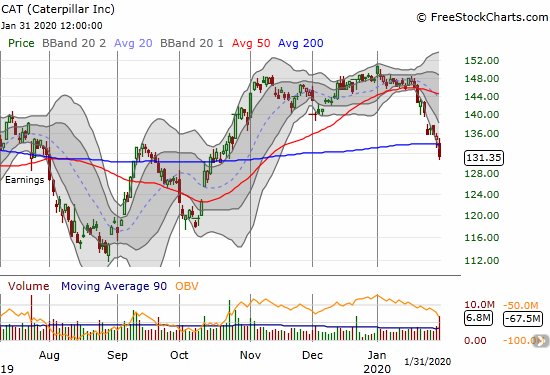
Caterpillar (CAT)
The 2 1/2 months of churn going nowhere lulled me into a sleep on Caterpillar (CAT), one of my favorite stocks for put buying. While I managed to catch the sell-off (and 50DMA) breakdown in the previous week, I somehow failed to keep CAT on the menu during last week’s churn. With a 200DMA breakdown in effect, I will have CAT front-and-center. Earnings on February 4th should be telling. If the VIX is still high ahead of earnings, I will likely choose a put spread.
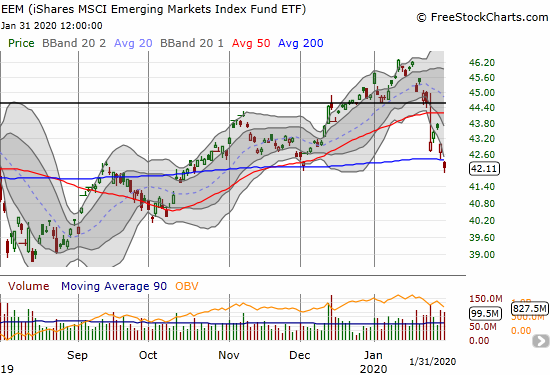
iShares MSCI Emerging Markets Index Fund ETF (EEM)
After watching iShares MSCI Emerging Markets Index Fund ETF (EEM) getting over-extended on Monday and then bouncing sharply, I put EEM on the buy list after the next sell-off. EEM is even a good pairs trade opportunity with my SPY and QQQ put options. I bought call options on Thursday only to watch them get sliced in half on Friday. With a 200DMA breakdown in play, I will not be adding to those calls (and instead I will be more likely to press bets against SPY and QQQ).
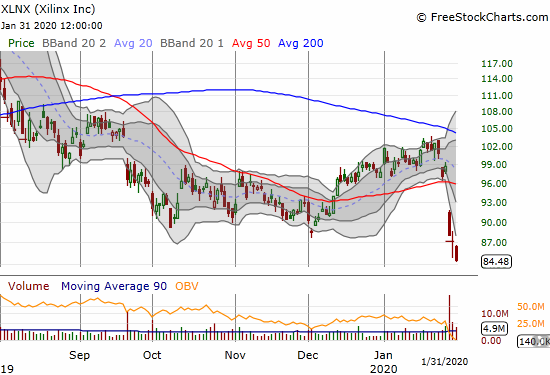
Xilinx (XLNX)
Xilinx (XLNX) suffered mightily post-earnings. XLNX has finally finished reversing all its gains for 2019. When I bought XLNX shares in mid-December, I targeted an eventual 200DMA breakout. I should have abandoned ship after the gap down away from 200DMA resistance. Now I will just wait things out further. XLNX is clearly in a down cycle, but I am not quite ready to take the loss.
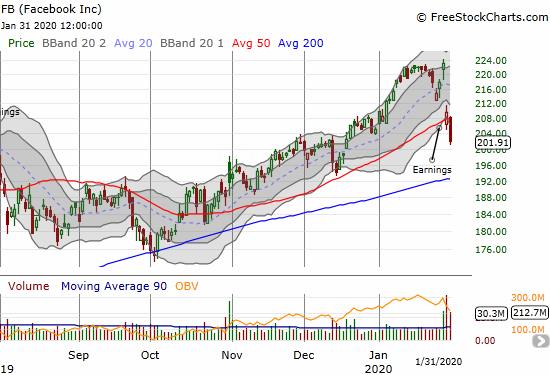
Facebook (FB)
Facebook (FB) dipped and then ran up ahead of earnings only to gap down post-earnings to its 50DMA. The balancing act looked purely technical so I reached for put options. I got a weekly $205 calendar put spread and failed to add $202.50 weekly puts. Friday’s 50DMA breakdown became a missed opportunity. I moved the calendar put spread into a vertical put spread, and I plan to fade rallies.
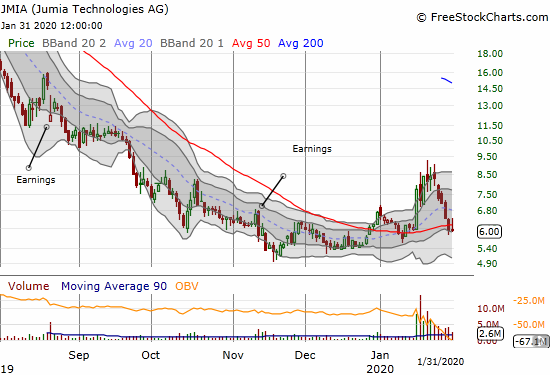
Jumia (JMIA)
The run-up was exciting while it lasted. Jumia (JMIA) unceremoniously fell back to its 50DMA and neatly reversed all my gains from the last timely purchase. The dire global headlines proved too much for the e-commerce platform that operates in many African countries. I did not take profits while I had them because I think of JMIA as a long-term position with tremendous upside potential. I hope I never have to look back at this time to reference for a mea culpa!
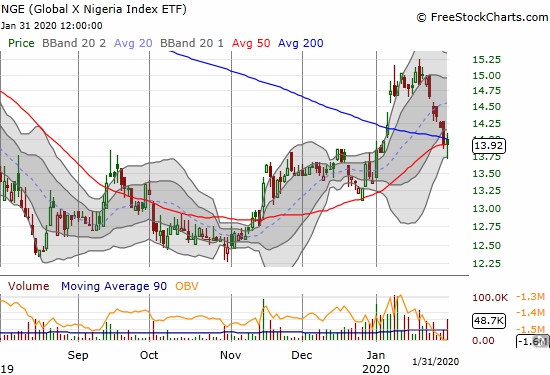
Global X Nigeria Index ETF (NGE)
Like JMIA, Global X Nigeria Index ETF (NGE) could not hold up against the global news flow. The sell-off slowed down around converged 50 and 200DMA support, but I am assuming near-term prospects are poor. A reader recently emailed me with a host of reasons to doubt the bounce in NGE, and I am seeking answers to those questions. I will post them here when I get them.
In related news, on Friday, the U.S. announced a ban on immigration VISAs for Nigerians. The U.S. blamed Nigeria’s inability to meet security and information-sharing requirements.
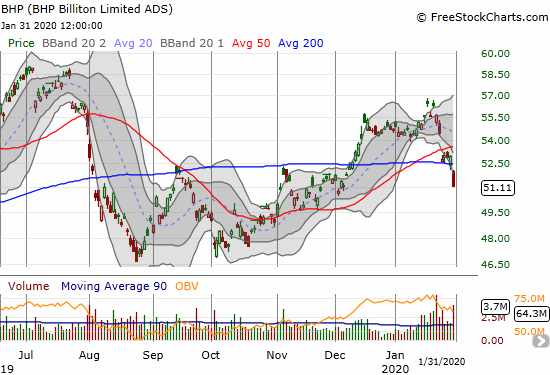
BHP Billiton Limited (BHP)
I was primed to buy puts on BHP Billiton (BHP) on a 50/200DMA breakdown. Friday’s gap down was so swift and steep I could not move fast enough to chase. I am looking to fade a rally in the coming week.
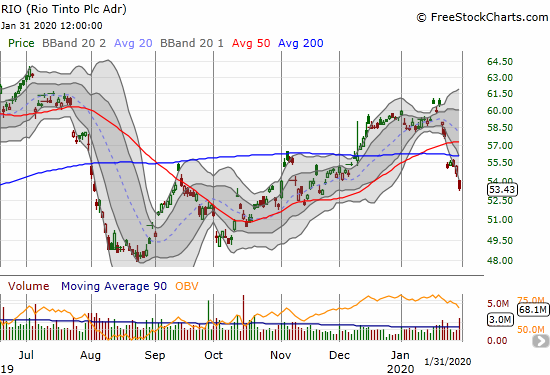
Rio Tinto (RIO)
I sold my put options on Rio Tinto (RIO) into Monday’s gap down. The stock never rebounded much to entice me into a new position. With downward momentum firmly in place, I think the October lows are in play.
Stock Chart Reviews – Above the 50DMA
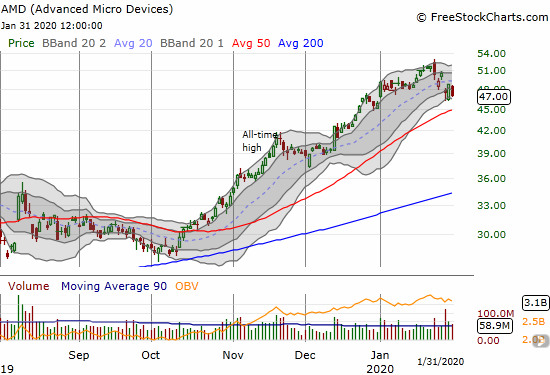
Advanced Micro Devices (AMD)
Advanced Micro Devices (AMD) experienced a post-earnings pullback that put the stock back on my buy radar. I held my call options through Thursday’s sudden rally only to lose most of the profits on Friday’s pullback. The stock still looks resilient so I think there is better than a 50/50 chance I could still profit in the coming week.
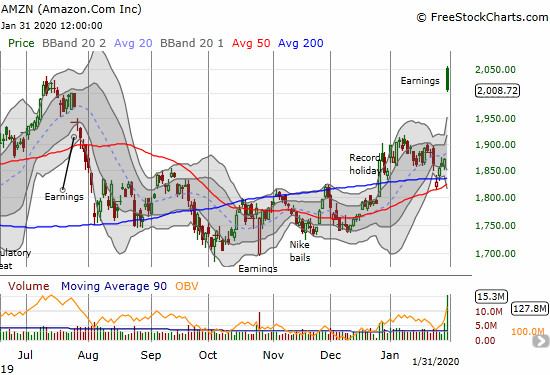
Amazon.com (AMZN)
Amazon.com (AMZN) took me completely by surprise. I went into earnings short a $1910/$1920 call spread. I blithely ignored the stock’s steady rebound from Monday’s gap down which confirmed 50DMA support and created a fresh 200DMA breakout. Those moves should have warned me that my bearish thesis was misplaced even with the darkening skies over the stock market. AMZN was up as much as 12% or so in the after hours. The stock opened up around 9.7% and closed with a 7.4% gain just below the previous all-time high. Needless to say, AMZN is set up here for a major gap and crap top. A close above 2056 invalidates the bearish signal.
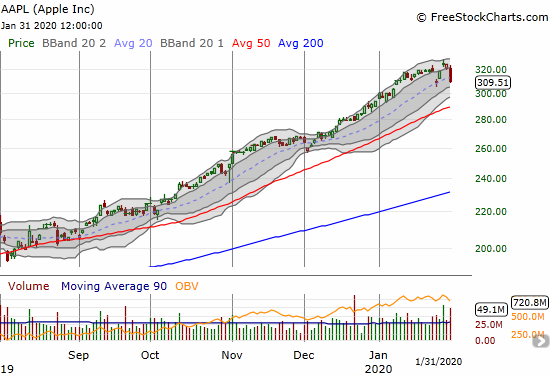
Apple (AAPL)
I did something on Apple (AAPL) I have not done since the fall 2018 sell-off: I bought put options. On Thursday and Friday I went about setting up my typical weekly call options for next week’s trade. After the stock went from a 2.5% loss to a 4% loss on the day, I suddenly woke up to the bearish possibilities; investors and traders have a LOT of profits to preserve in AAPL. I switched to a hedged position with a calendar put spread layered with a put spread. AAPL previously led the market indices higher and helped to soothe sentiment despite bearish breadth indicators. AAPL helped provide the impression that all is well. A fresh post-earnings low would deliver a hard blow to complacency.
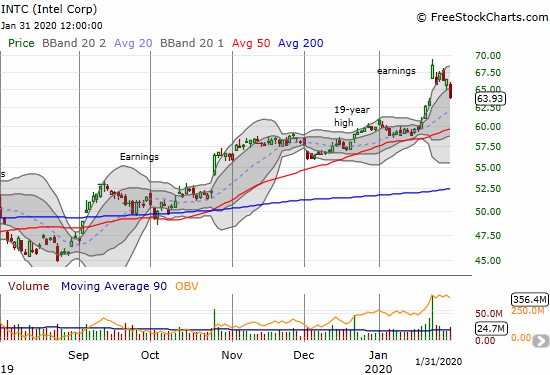
Intel (INTC)
When Intel (INTC) went sky high post-earnings I lamented only trading INTC between earnings. Suddenly, opportunity presents itself in the form of a near complete reversal of the post-earnings gains. I am VERY conflicted on this trade given I am bearish on the stock market overall. I do not expect INTC to trade contrary to market sentiment. So for now, I will try to stay patient. INTC will be on the top of my list to buy if/when the stock market flips oversold.
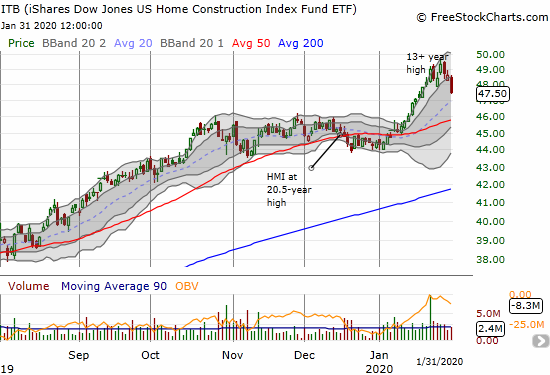
iShares Dow Jones US Home Construction Index Fund ETF (ITB)
The iShares Dow Jones US Home Construction Index Fund ETF (ITB) is exhibiting topping behavior again. I will have a lot more to say about home builders in my next Housing Market Review. For now, suffice to say that I am warily eyeing this latest buying opportunity.
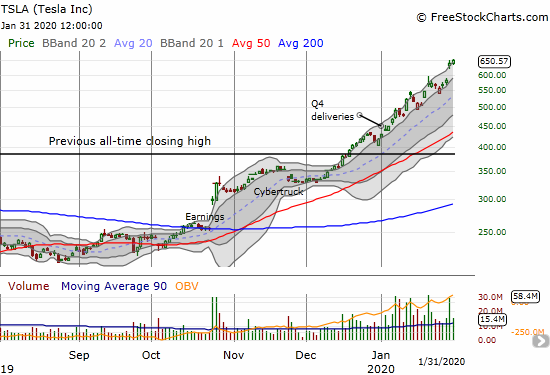
Tesla (TSLA)
Wow. ‘Nuff said on Tesla (TSLA). TSLA closed the week at a new all-time high as one of the 910 advancers on the day. This stock has left me breathless on the consistent profits I am earning on playing call options. I am also lamenting having ANY shares short as a backstop (hedge)!
— – —
FOLLOW Dr. Duru’s commentary on financial markets via email, StockTwits, Twitter, and even Instagram!
“Above the 40” uses the percentage of stocks trading above their respective 40-day moving averages (DMAs) to assess the technical health of the stock market and to identify extremes in market sentiment that are likely to reverse. Abbreviated as AT40, Above the 40 is an alternative label for “T2108” which was created by Worden. Learn more about T2108 on my T2108 Resource Page. AT200, or T2107, measures the percentage of stocks trading above their respective 200DMAs.
Active AT40 (T2108) periods: Day #259 over 20%, Day #98 over 30% (overperiod), Day #1 under 40% (ending 72 days over 40%), Day #5 under 50%, Day #6 under 60%, Day #10 under 70%
Daily AT40 (T2108)
")
Black line: AT40 (T2108) (% measured on the right)
Red line: Overbought threshold (70%); Blue line: Oversold threshold (20%)
Weekly AT40 (T2108)

*All charts created using FreeStockCharts unless otherwise stated
The T2108 charts above are my LATEST updates independent of the date of this given AT40 post. For my latest AT40 post click here.
Be careful out there!
Full disclosure: long VIXY calls, long JMIA, long NGE, long SPY calendar put spread, long EEM calls, long XLNX, long AMD calls, long FB put spread, short TSLA shares and long call option and calendar call spread, long AAPL calls, long AAPL calendar put spreads, long ITB call spread and calls, long QQQ puts
*Charting notes: FreeStockCharts stock prices are not adjusted for dividends. TradingView.com charts for currencies use Tokyo time as the start of the forex trading day. FreeStockCharts currency charts are based on Eastern U.S. time to define the trading day.