
AT40 = 65.6% of stocks are trading above their respective 40-day moving averages (DMAs)
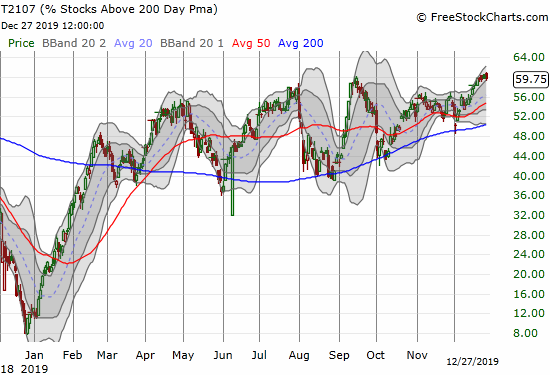
AT200 = 59.8% of stocks are trading above their respective 200DMAs (just under the high for 2019 of 60.2%)
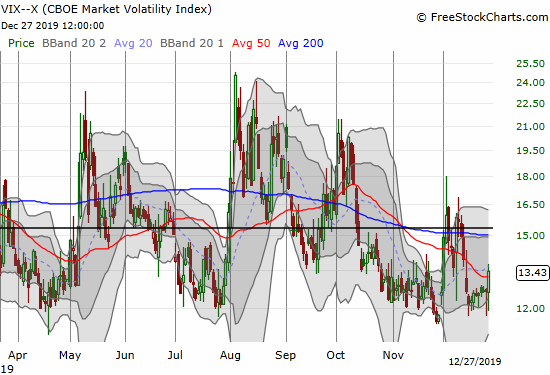
VIX = 13.4
Short-term Trading Call: neutral
Stock Market Commentary
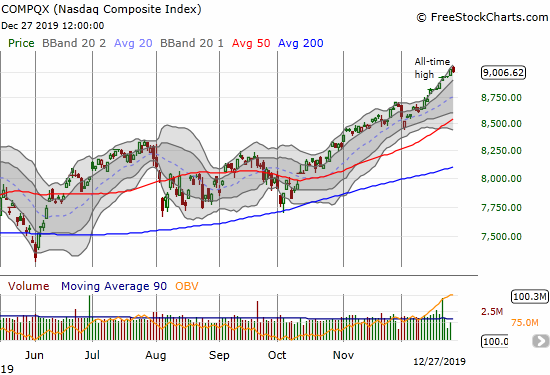
A week after my last Above the 40 post, the volatility index (VIX) is my only headline market data point that changed. Despite the VIX increasing over that time (thanks mainly to Friday’s surge), the S&P 500 (SPY) gained 0.6% and the NASDAQ (COMPQX) increased 0.9% over that time (mainly thanks to a one day post-Christmas burst). These gains against the grain are a microcosm of the big story for this year’s historic (year-to-date) performance for the major indices: the S&P 500 is up 29.2% and the NASDAQ is up 35.7%. These numbers have come despite the inability of the stock market to deliver broad buying power. AT40 (T2108), the percentage of stocks trading above their respective 40-day moving averages (DMAs), has spent very little time in overbought territory in 2019 and was definitively rejected from the overbought threshold four times.
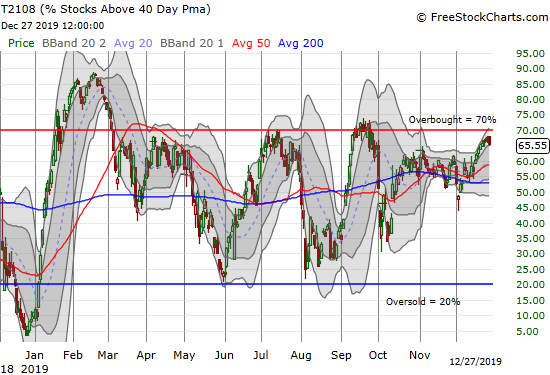
Each rejection from the overbought threshold delivered a pullback as I would expect from the AT40 Trading Rules. March was the shallowest pullback with a 2-day post-Fed bout of selling. May was the most convincing pullback with a month-long sell-off. The S&P 500 impressed by coming back from May’s selling stronger than ever with new all-time highs in July. Of course the rally from October to now has been even more impressive.
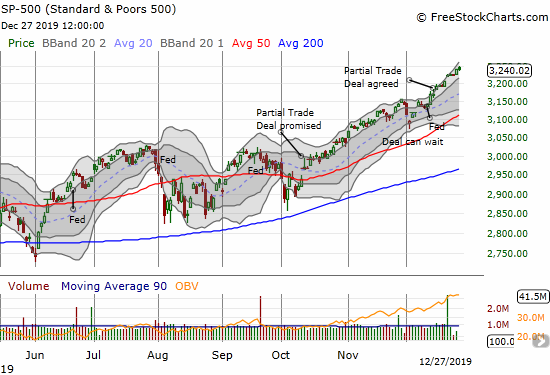
The NASDAQ (COMPQX) is even more impressive than the S&P 500. After a picture-perfect test of 200DMA support in October, the NASDAQ is up 14.4% so far. Compare to the S&P 500’s 11.3% gain over that same time period.
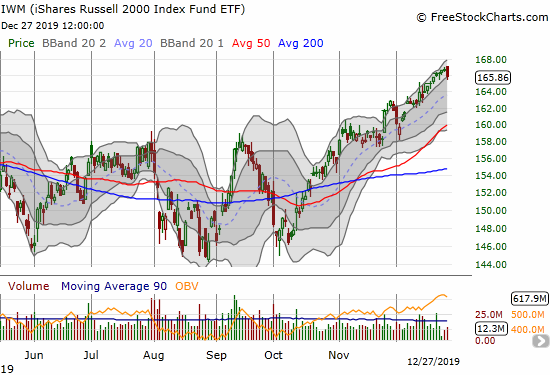
The iShares Russell 2000 Index Fund ETF (IWM) hit a 15-month high last week. On a relative basis, the small caps are significantly lagging the S&P 500. IWM last made an all-time high in August, 2018 around $173.
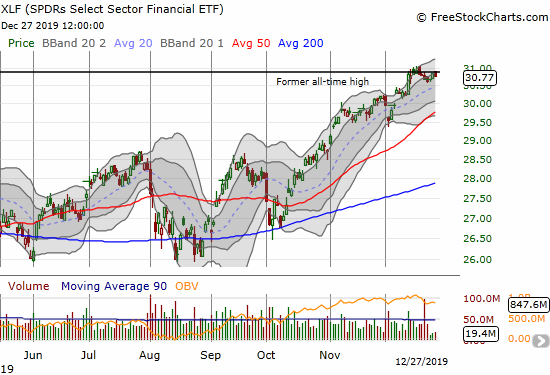
After a a big one-day burst on December 12th right under the former all-time high, the SPDRS Select Sector Financial ETF (XLF) has essentially sputtered. this challenge is a key battleground for determining the next tenor of market sentiment.
No Oversold
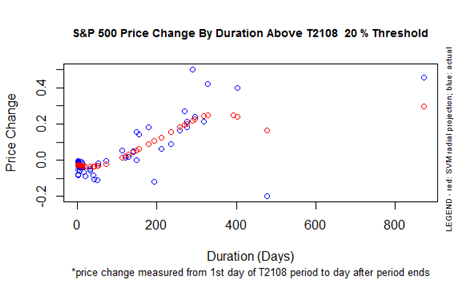
AT40 started the year launching out of extreme oversold conditions and never looked back. Close encounters in May and August delivered the next two best buying opportunities of the year. AT40 has closed 236 trading days above the 20% oversold threshold. The chart below is almost 5 years old (perhaps the start of a new decade will finally be the time I do a fresh and comprehensive update of my AT40/T2108 Analyses), but it tells the right story: when AT40 goes long stretches above 20%, the S&P 500 tends to perform extremely well. A pivot point at 250 days opens up to all but one strong historical outcomes. However, the projected performance for the S&P 500 between trips to oversold territory tops out around 25%. The S&P 500 is up 28.0% since ending the last oversold cycle on January 4th. In other words, the AT40 Trading Model tells me the S&P 500 has likely topped out for this cycle.
AT200 (T2107), the percentage of stocks trading above their respective 200DMAs, is an interesting case. If AT200 could make a clean break to a high for 2019, I could consider it a minor confirmation of the strength in the S&P 500. Until then, it continues to be a source of wariness about the sustainability of the current highs.
Volatility
The volatility index (VIX) continues to refuse to cooperate with the latest surge of bullish price action. On Friday, the VIX even surged 6.2%. I have to assume that the flurry of VIX activity is related to institutions scrambling to buy some protection for their juicy 2019 gains.
The Short-Term Trading Call
Overbought conditions still loom overhead. On a short-term basis, this is the exact wrong time to buy into the S&P 500 (SPY). If the overbought threshold holds, some kind of pullback will ensue. In that scenario, I like buying put options on SPY below 320 which would take the ETF below its mini launchpad for the last all-time high and below the upper Bollinger Band (BB). Based on the AT40 Trading Model (as discussed above), a sustained pullback to oversold conditions would create a 5-10% loss. For now, it is hard to imagine a steep sell-off, so my money would be on a shallow 5% pullback.
If buyers prove their strength and defy the odds by pushing AT40 into overbought conditions, I prefer buying call options on IWM as a “catch-up” trade and/or call options on XLF on a presumed breakout above its extremely important former all-time high. My profit expectations would be quite muted.
Stock Chart Reviews – Below the 50DMA
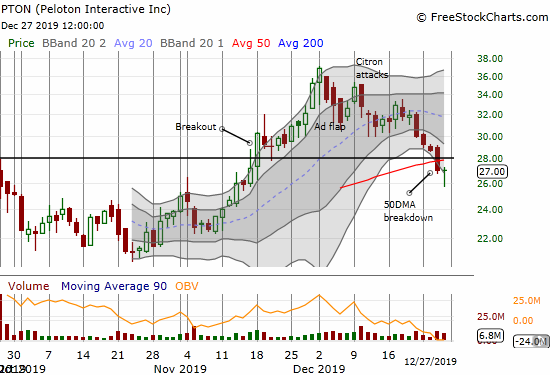
Peloton (PTON)
The short-sellers won the fight on Peloton (PTON). I did not take profits for the brief moment I had them, and I paid he price. PTON under-performed the market by selling off 4 out of the last 5 days. The last day should have been another down day to confirm a 50DMA breakdown. Instead, buyers finally showed up and closed the stock flat to create a bottoming hammer pattern. PTON is not a buy until the stock confirms the hammer with a higher close. Moreover, PTON needs to close above its 50DMA and the former breakout line to solidfy a return of bullish sentiment.
Stock Chart Reviews – Above the 50DMA
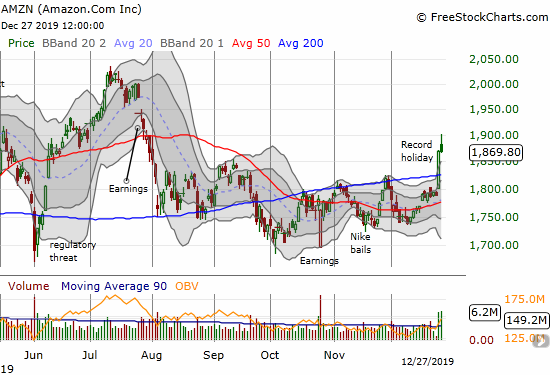
Amazon.com (AMZN)
Amazon.com (AMZN) put on a post-Christmas show. After announcing record holiday sales, AMZN jumped 4.4% for a 200DMA breakout. I am surprised buyers did not confirm the breakout on Friday but holding momentum well above the upper Bollinger Band is extremely difficult to pull off. From the press release (emphasis mine):
“Amazon today announced that this holiday season was record-breaking thanks to its customers all around the world – billions of items were ordered worldwide and tens of millions of Amazon Devices were purchased worldwide. Throughout the season, Amazon offered customers incredible deals every day and deeper discounts and more Deals of the Day than ever before during shopping events like Black Friday and Cyber Monday.”
The discounts and deals caught my attention and makes me wonder whether Amazon.com will report disappointing profit numbers next month.
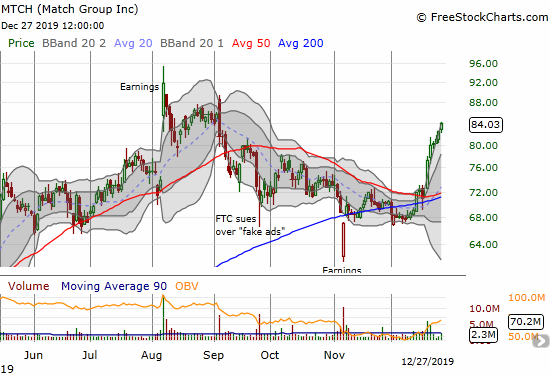
Match Group (MTCH)
Match Group (MTCH) started an impressive turn-around starting with a rush of buyers after a post-earnings gap down. The stock surged on December 19th after announcing it worked out a deal with parent company IAC to become 100% independent. The move confirmed a 50 and 200DMA breakout. The buyers have yet to stop the party…
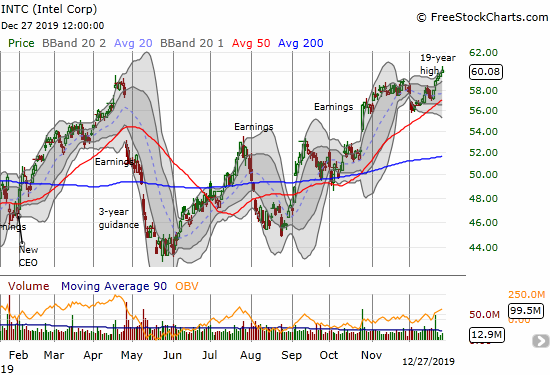
Intel (INTC)
For the first time in a long time, I made no between earnings play with Intel (INTC). After October’s impressive surge, INTC crept ever so slowly to finish filling the post-earnings gap down from April. I did not buy into the gap down that opened December. I should have bought the fresh breakout on December 20th.
Looking back, INTC is an intriguing example of a stock that reveals how little the market sometimes understand the prospects for a company. Sell-offs after April earnings and 3-year guidance the next month made INTC look like dead money. Now, just 7 months later, INTC is at a 19-year high. Did something happen to nullify the news of the 3-year guidance? Did that guidance already change so dramatically? What a head-scratcher…
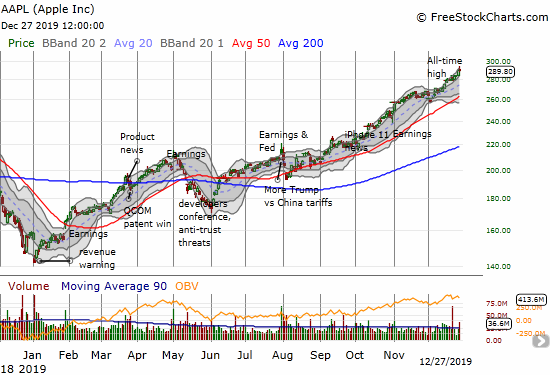
Apple (AAPL)
Speaking of comebacks, Apple (AAPL) gets the award for comeback of the year just because the warning the company issued to start the year seemed to confirm the bleak economic prospects implied by 2018’s year-end sell-off. AAPL never looked back after that revenue warning. The weekly AAPL call trade benefited greatly from 2019’s near relentless upward push in AAPL. The stock is up 103.8% year-to-date. Wowza.
— – —
FOLLOW Dr. Duru’s commentary on financial markets via email, StockTwits, Twitter, and even Instagram!
“Above the 40” uses the percentage of stocks trading above their respective 40-day moving averages (DMAs) to assess the technical health of the stock market and to identify extremes in market sentiment that are likely to reverse. Abbreviated as AT40, Above the 40 is an alternative label for “T2108” which was created by Worden. Learn more about T2108 on my T2108 Resource Page. AT200, or T2107, measures the percentage of stocks trading above their respective 200DMAs.
Active AT40 (T2108) periods: Day #236 over 20%, Day #75 over 30%, Day #50 over 40%, Day #17 over 50%, Day #9 over 60% (overperiod), Day #63 under 70% (includes corrections)
Daily AT40 (T2108)
")
Black line: AT40 (T2108) (% measured on the right)
Red line: Overbought threshold (70%); Blue line: Oversold threshold (20%)
Weekly AT40 (T2108)

*All charts created using FreeStockCharts unless otherwise stated
The T2108 charts above are my LATEST updates independent of the date of this given AT40 post. For my latest AT40 post click here.
Be careful out there!
Full disclosure: long VIXY calls, long PTON
*Charting notes: FreeStockCharts stock prices are not adjusted for dividends. TradingView.com charts for currencies use Tokyo time as the start of the forex trading day. FreeStockCharts currency charts are based on Eastern U.S. time to define the trading day.
Thanks for the at40,and the T2108
Charts. It was a very good day
Indeed in volatility today!
Ray
You’re welcome and thanks for reading!