
Housing Market Intro/Summary
When I wrote the Housing Market Review for October, the stocks of home builders were failing their moment of truth. The iShares US Home Construction (ITB) soon rebounded, including a near picture-perfect test of support at its 50-day moving average (DMA). Last week, ITB actually printed a fresh 21-month high before pulling back.
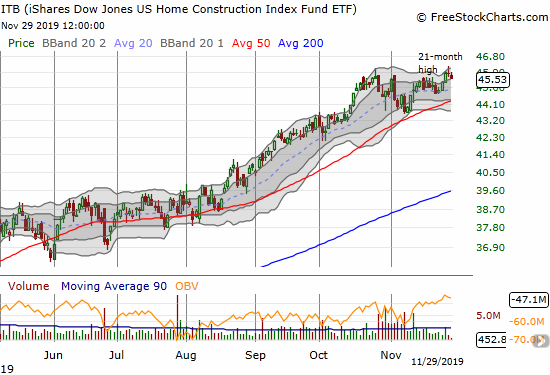
Home builders are still facing down a moment of truth until ITB can confirm a breakout with two closes at 21-month highs (or better). This threshold is particularly important as a notable performance divergence has developed across home builders. I have covered these dynamics in prior posts on home builders including my last Housing Market Review.
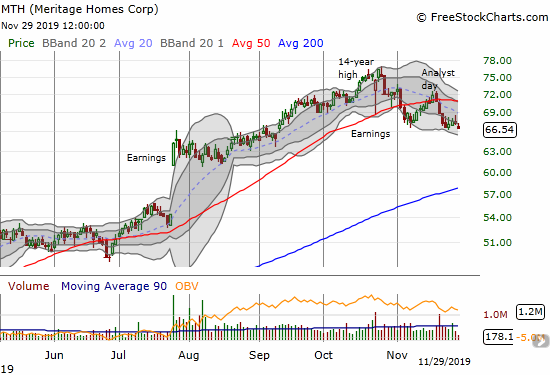
Meritage Homes (MTH) rose to the top of my list of concern after it closed at a 3-month low on Friday amid on-going selling pressure. I have yet to review the presentation from the company’s Analyst Day, but clearly analysts left displeased. With a confirmed 50DMA breakdown, MTH looks like it has topped out at its 14-year high from October.
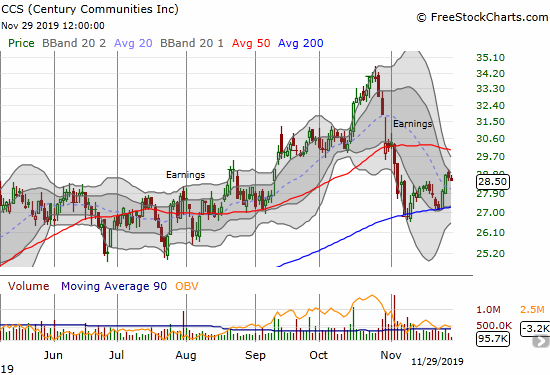
Century Communities (CCS) already confirmed a top in October with a 50DMA breakdown amid heavy post-earnings selling. On the positive side, CCS twice held support at its 200DMA. CCS is an important tell because smaller builders like Century Communities have found great success selling affordable homes in affordable housing markets. A 200DMA breakdown for CCS alongside other smaller builders that are currently selling off sharply from recent highs would deliver a very negative signal for the housing market.
In the meantime, the seasonally strong period for builders is well underway. So far, I am still waiting for a compelling reason to get aggressive with the seasonal trade. The current dips are creating more alarm than a sense of opportunity, especially given the stubborn strength in the S&P 500 (SPY). At the current rate, it is very possible I will not trigger my usual basket of trades until January when my current $40/$4 ITB call spread expires.
New Residential Construction (Single-Family Housing Starts) – October, 2019
Housing starts continue a slow and steady ascent to return to the post-recession high set January, 2019.
Single-family housing starts for September were revised slightly downward from 919,000 to 918,000. October starts increased month-over-month by 2.0% to 936,000. On an annual basis, single-family housing starts increased by a healthy 8.2%. From October, 2018 to May, 2019, the year-over-year percentage gains were negative except for January’s 9.4% gain. The last five months delivered single-digit year-over-year gains with October the highest in the series; starts performance is benefiting from favorable comparisons to the housing slowdown last year. Now the big question is whether builders will continue to pick up the pace.
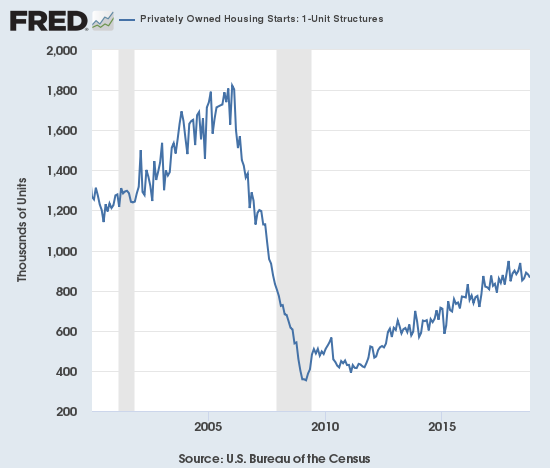
Source: US. Bureau of the Census, Privately Owned Housing Starts: 1-Unit Structures [HOUST1F], retrieved from FRED, Federal Reserve Bank of St. Louis, November 28, 2019.
On a regional basis, the changes were extreme and widely distributed. Last month, the Northeast ended four straight months of year-over-year losses, but this month returned to a loss in a dramatic way. The Northeast, Midwest, South, and West each changed -43.1%, -1.6%, +25.8%, and -2.9% respectively. The furious construction activity in the South leads the way and seems to be the key for aggregate starts to punch through to a new post-recession high.
Existing Home Sales – October, 2019
The 16-month streak of year-over-year declines for existing home sales came to an end, just barely, in July. Now I have a more optimistic watch in place awaiting the achievement of new post-recession highs. I remain wary given the slow and reluctant upward progress. Existing home sales have essentially gone nowhere since 2015/2016.
The seasonally adjusted annualized sales in October of 5.46M were down 2.2% month-over-month from the slightly downward revised 5.36M in sales for September. Year-over-year sales increased 4.6%. August remains the highest point for existing home sales in 2019.

(As of the March, 2018 data, the NAR further reduced historical data to just 13 months. For historical data from 1999 to 2014, click here. For historical data from 2014 to 2018, click here) Source for chart: National Association of Realtors, Existing Home Sales© [EXHOSLUSM495S], retrieved from FRED, Federal Reserve Bank of St. Louis, November 30, 2019.

The National Association of Realtors (NAR) talked optimistically about rising sales assuming “adequate” inventories and yet referenced its typical refrain and request to home builders to help relieve tight inventories.
“We will likely continue to see sales climb as long as potential buyers are presented with an adequate supply of inventory…
In order to better counter and even slow the increase in housing prices, home builders will have to bring additional homes on the market.”
The irony here is that home builders do not have a core mission to slow the steady climb of housing prices except to the extent that market-wide pricing pressures force the issue.
The median price of an existing home hit $270,900, a year-over-year increase of 6.2% and the 92nd straight year-over-year gain. This relentless ascent in price has little changed whether inventories happen to drop or gain in any given month. However, prices dropped sequentially for the fourth month in a row. If a changing mix toward lower-priced homes is driving the short-term trend, perhaps by the first half of 2020, the streak of year-over-year gains will finally end.
Absolute inventory levels of 1.77M homes declined 2.7% from September and down 4.3% year-over-year. Based on months of supply, inventory also declined: “Unsold inventory sits at a 3.9-month supply at the current sales pace, down from 4.1 months in September and from the 4.3 month figure recorded in October 2018.” The on-going decline in inventory works against the NAR’s core thesis of improving home sales with adequate inventories.
The recent shift toward first-time buyers in the existing home market seems to have slowed. October’s share dropped to 31% from September’s 33% and is flat year-over-year. The average share for first-time homebuyers for 2016 was 35%. The NAR’s 2017 Profile of Home Buyers and Sellers reported an average of 34% for 2017, 33% for 2018, and 33% for 2019.
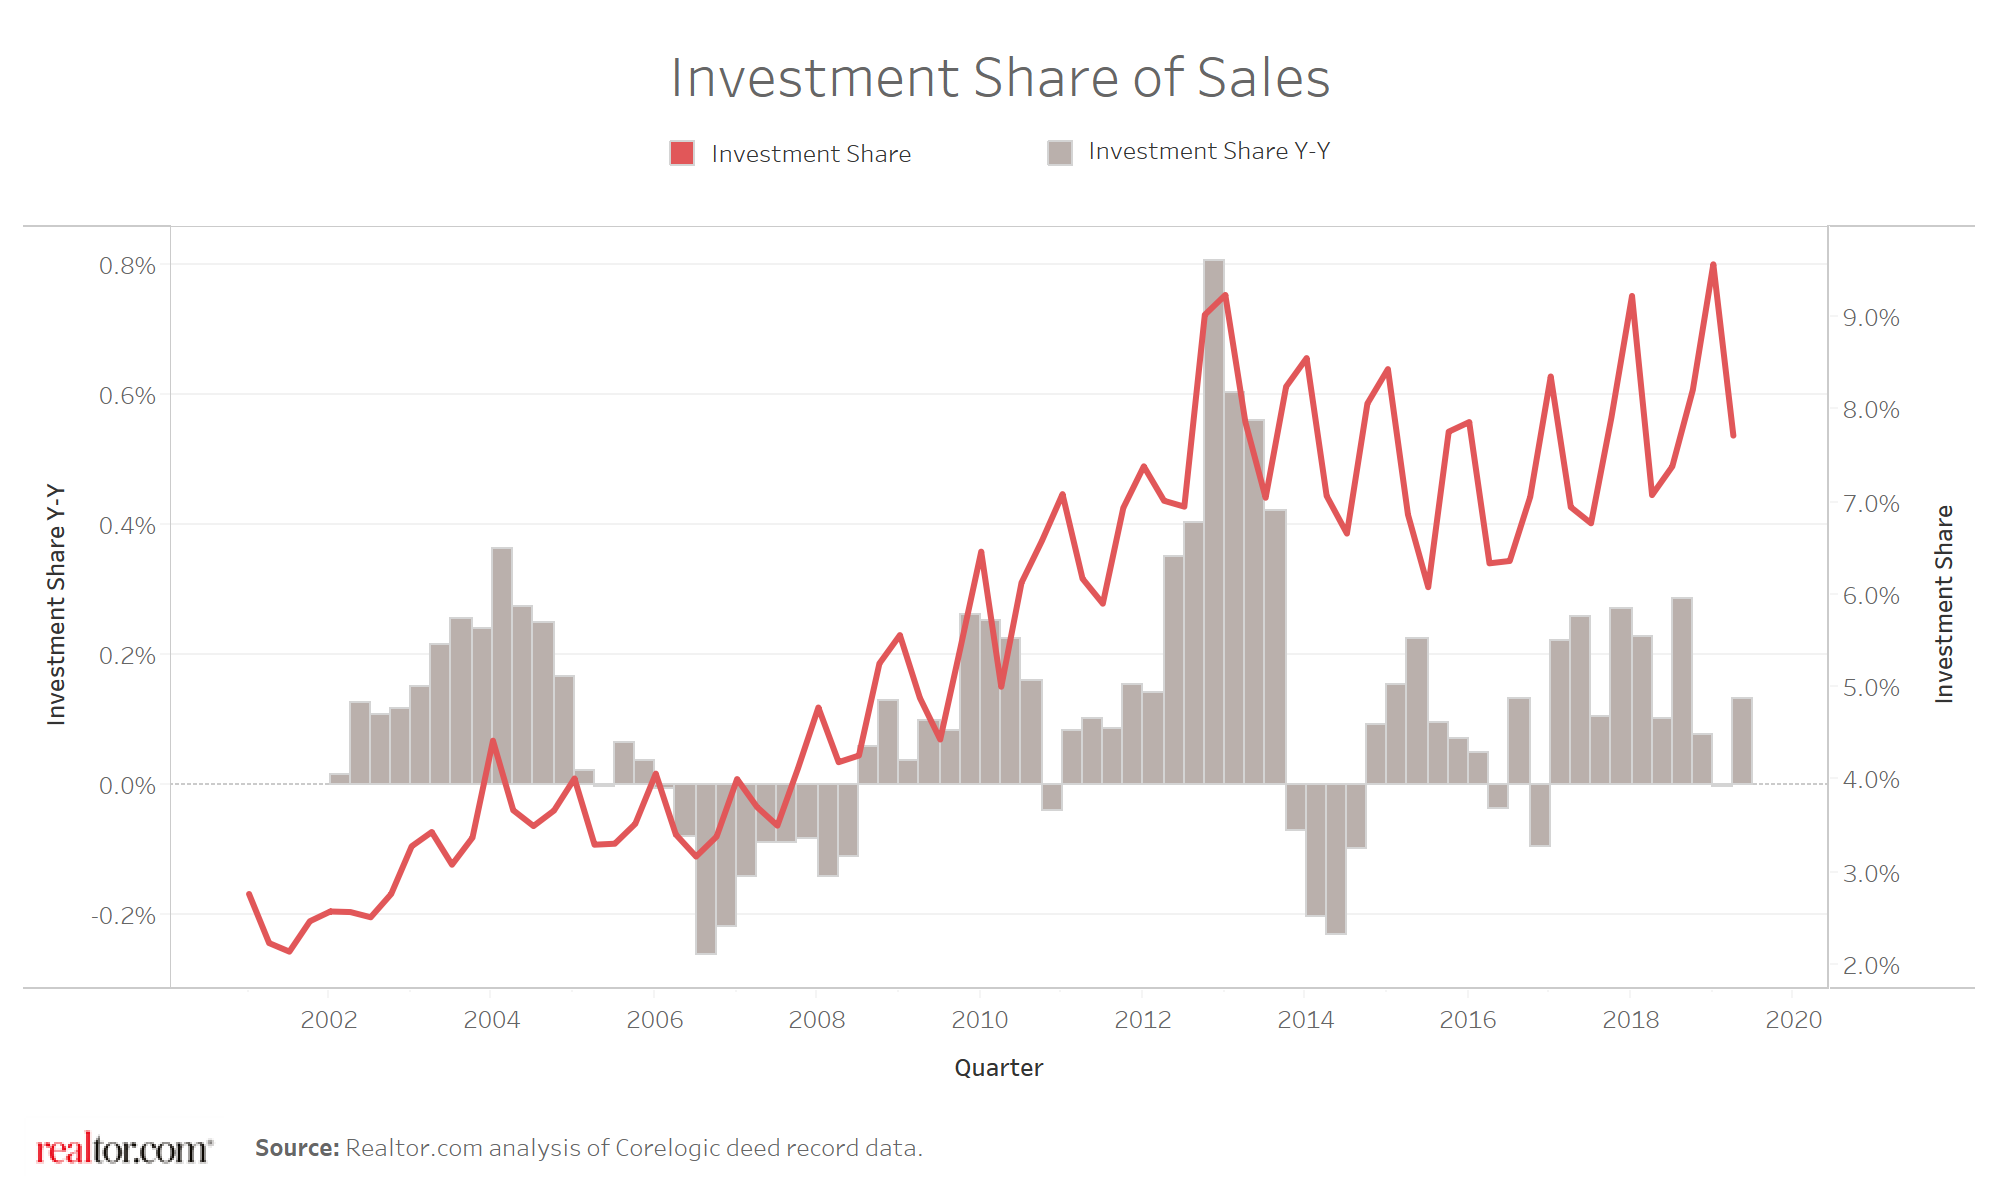
Investors purchased 14% of homes in October, flat with August and September but down one percentage point from last year’s October. Investor sales averaged a share of 15% in 2017 and 14% in 2016. Given data availability, I have started reporting on the NAR’s overall measure of investor sales. The chart below shows a range of 7% to 9% since 2012. In other words, there are no fundamental changes to report. (The NAR never answered my question seeking clarification on the base of the data in the chart below). I will update this chart periodically.
The highlight for regional sales in August was the end of a 13-month streak of declines for year-over-year sales in the West. Only the Midwest failed to gain in September and only the Northeast failed to gain in October. The South continued a torrid pace. Here are the regional changes: Northeast 0.0%, Midwest +2.4%, South +7.8%, West +3.7%.
Like September, all regions experienced notable and robust price jumps in October. Here are the regional year-over-year changes in median home prices: Northeast +5.7%, Midwest +6.7%, South +6.0%, West +7.8%.
Single-family sales decreased 2.1% from September and increased on a yearly basis by 5.4%. The median price of $273,600 was up a healthy 6.2% year-over-year, much higher than the tight 4.5% to 4.7% range from May to August and similar to the 6.1% (unrevised) in September.
California Existing Home Sales – October, 2019
California continues to present an existing sales market that includes a few bright spots amid some troubling trends.
The California Association of Realtors (CAR) reported sales of existing Californian homes at a 10-year low in January. July sales were at a 15-month high and the 1.1% year-over-year gain ended a 14-month losing streak. Year-over-year sales are now up four months straight although mostly flat sequentially over that same time. October sales were up 0.1% from September and up 1.9% year-over-year. September’s year-over-year gain of 5.8% was the largest annual gain in 30 months.
February’s median price was the lowest in 12 months. The median price suddenly swung to record highs from June to August. October’s median price fell 0.1% from September and increased 6.0% year-over-year, the largest annual gain since July, 2018. The San Francisco Bay Area was the only region in California to experience a year-over-year decline in median prices. In fact, the region is now on its ninth straight month of such declines. Three of the nine Bay Area counties drove October’s decline.
The CAR’s lamentation about the persistent price surge echoes a familiar refrain from the NAR:
“The latest surge in home prices is the consequence of an ongoing mismatch between supply and demand…While low interest rates will reduce borrowing costs for buyers and temporarily alleviate affordability concerns at the micro level, without an increase in housing supply — including new housing construction for sale or rent — fundamental issues remain at the macro level, which will worsen the affordability crisis down the road.”
In September, the number of active listings dropped 11.8% year-over-year, the largest such drop since December, 2017. October’s 18.0% year-over-year drop was the fourth straight month of declines and the largest since May 2013. These declines represent a significant slowdown in selling activity.
“Experts” predict that Bay Area home prices have finally hit a peak. If so, it will be as a result of affordability issues…
New Residential Sales (Single-Family) – October 2019
The Census Bureau revised September sales of new single-family homes significantly upward from 701,000 to 738,000. This large revision ends a short period of stabilization after substantial revisions during the summer. This change pushed September new home sales to a post-recession high. October sales decreased from September sales by 0.7% to 733,000. Given last year’s sales slowdown, these sales were still worth a large 31.6% year-over-year gain. The current sales numbers all but end my lingering expectations for a late year sales slowdown; this is quite an impressive run!
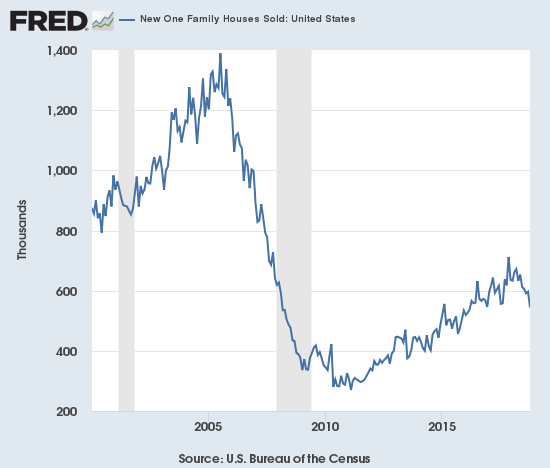
Source: US. Bureau of the Census, New One Family Houses Sold: United States [HSN1F], retrieved from FRED, Federal Reserve Bank of St. Louis, November 28, 2019.
Since hitting a post-recession peak in November and December, 2017, the median price of a new single-family home has trended slightly downward largely thanks to a surge in entry-level and lower-priced new homes. The Census Bureau provided significant upward revisions in median prices. July’s median price of $308,300 no longer matches January’s $305,400 which was a 2-year low. September is no longer at a level not seen since February, 2017 with a revision from $299,400 up to $310,200.
The revisions involved a notable boost in the number of higher-priced homes that were sold. In particular, homes sold from $300,000 to $399,999 increased from 13K to 16K. October’s median of $316,700 is a 3.5% year-over-year decline, yet still represents a significant shift toward higher-priced homes from September: the $300,000 to $399,999 range dropped from 29% to 24% of sales while the next three tiers increased by 1, 1, and 3 percentage points respectively. The share of home sales at $750K and over matched highs for the year.
Ever since the inventory of new homes for sale jumped to 6.0 months of sales in June, 2018, inventory has pivoted around that 6.0 level. June 2019’s inventory sat at 6.3 days of sales. July increased ever so slightly to 6.4. However, sales in August were high enough to send inventory plunging back to 5.5 days of sales where they stayed for September. October’s inventory dropped further to 5.3 days of sales.
All regions experienced strong, double-digit sales increases. October sales in the Northeast jumped 17.4%, the Midwest jumped 17.2%, the South surged 40.6%, and the West increased 21.9%.
Home Builder Confidence: The Housing Market Index – November, 2019
The Housing Market Index (HMI) hit a 20-month high in October at 71. The HMI was last that high coming off the soaring optimism that closed out 2017 and launched 2018. The HMI fell by a point to 70 in November. The National Association of Home Builders (NAHB) is clearly not worried about a topping given the title of the press release: “Builder Confidence Holds Firm in November.” Indeed, the NAHB pointed out “this is the fourth consecutive month where at least half of all builders surveyed have reported positive buyer traffic conditions.” This streak is truly impressive given the amount of time this indicator has spent below 50% since the financial crisis (granted the first two months of this streak were right at 50%). The true test of this optimism will come when/if it approaches the post-recession high set December, 2017. As the chart below shows, the peak in optimism operated like a “blow-off top.” Builders have been a lot more cautious (forward-looking) since then.
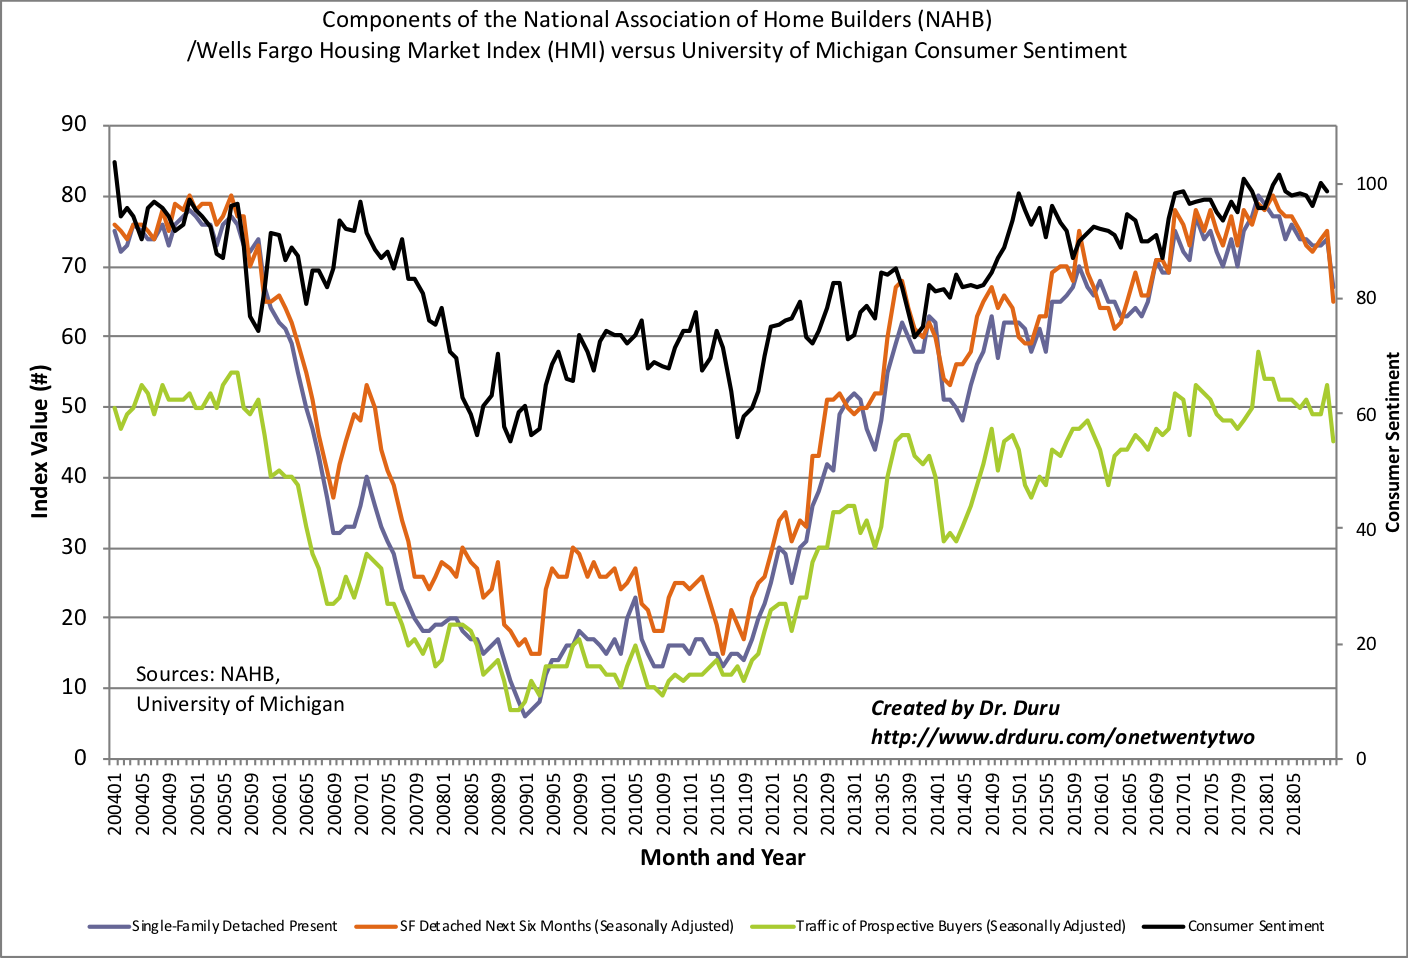
Source: NAHB
The regional results were a bit of a head-scratcher for a second month in a row. In the last Housing Market Review I pointed to signs of an imminent topping. That possibility remains intact. However, for November the Northeast and the West gained three and two points respectively. Both regions are significantly lagging the South in housing activity. Yet the South’s HMI retreated by 2 points from 76 to 74. The West’s HMI has not been this high since December, 2016. That kind of strength implies much better housing activity than the West is currently experiencing. I am not quite sure how to explain this divergence.
Parting thoughts
Bidding Wars in 2020?
Redfin (RDFN) reported that bidding wars hit a 10-year low in October, 2019. The offers written by Redfin agents plunged from 39% experiencing bidding wars a year prior to just 10% in October. Yet, Redfin is predicting a rebound for 2020 to 25% of offers experiencing bidding wars as low mortgage rates and a lack of supply combine to apply buying pressures in the housing market. Redfin tends to do a good job analyzing the housing market, so the 2020 predictions have me on board for at least a bullish first half of next year. This prediction also makes me more likely to find an opportunity by January to play the seasonal strength in home builders.
The Silver Tsunami: The Senior Sell-Off With A More Clever Name?
A few years ago alarm bells were ringing over an imminent deluge of homes dumped by aging homeowners. I dismissed these fears in a series of articles addressing the flaws in logic, timing, and data of a demographic trend called the “Senior Sell-Off.” I last discredited this theory in a piece called “The Future of Housing: The Senior Sell-Off Still Gives Way to Aging In Place.” Last month, Zillow (ZG) examined the imminent supply surge coming from aging seniors with the clever moniker the “Silver Tsunami” in an article called “The Silver Tsunami: Which Areas will be Flooded with Homes once Boomers Start Leaving Them?”
From the title, I thought the article would simply regurgitate the Senior Sell-Off theories. I was pleasantly surprised by a more nuanced analysis.
According to Zillow:
“Well-known retirement destinations, including Miami, Orlando, Tampa and Tucson, will experience the most housing turnover in the wake of the Silver Tsunami…
Regions including Cleveland, Dayton, Knoxville and Pittsburgh are also more likely to see bigger effects from the Silver Tsunami. Younger residents have tended to leave these areas in recent decades, in many cases pursuing better job opportunities elsewhere, leaving older generations to make up a larger share of those who remain.”
I give credit to Zillow for a more detailed and non-sensationalistic analysis of this generational transfer of housing stock. Zillow is not predicting a housing recession or depression as in the Senior Sell-Off. Instead, Zillow is pointing out that some areas will gain and others will lose. Zillow particularly gets credit in noting that areas that have suffered housing supply shortages could experience upside from the Silver Tsunami (emphasis mine):
“…the most-impacted areas appear to be pricey, relatively exclusive enclaves of older residents within otherwise mixed surroundings…These areas have been more affluent and expensive compared to their surroundings for decades, which has made them less affordable to the young…
Unlike popular retirement communities that may suffer from a dearth of housing demand down the line, these older, long-affluent enclaves may see more demand pour in from neighboring areas and more residents churn when the Silver Tsunami brings more homes on the market...
New home construction activity skews towards the metropolitan periphery. But much of the existing housing set to be released by seniors in coming decades is better-located to meet growing demand for living closer to the center.
Most importantly, Zillow comes short of predicting economic calamity as a result of the Silver Tsumani. Zillow is most confident in the potential for the construction industry to renovate and rehabilitate homes (emphasis mine).
“The Silver Tsunami will boost the supply of housing on a magnitude comparable to the fluctuations that new home construction experienced in the 2000s boom-bust cycle. Of course, whether that means there will be a glut or a continued shortage of housing depends on how new construction fares and, crucially, on future demand for housing. Whether housing released by the Silver Tsunami is appropriately located, priced and to meet future demand could be an important issue as well.
What seems most likely amid all the uncertainty is that, in the coming two decades, the construction industry will need to place a greater emphasis than before on updating existing properties, in addition to building new ones. The construction industry may be bracing for a tsunami of old-new housing supply that crowds out new development, but renovation could be where the real silver is at.”
For investors in home builders, this shift in economic activity could still mean declines in stock prices for those builders who do not make the needed shifts. Do-it-yourself hardware companies like Lowe’s Companies (LOW) and Home Depot (HD) stand to benefit for years to come.
Speaking of Home Depot, I like trading HD here for a post-earnings rebound going into its Analyst Day on December 11th.
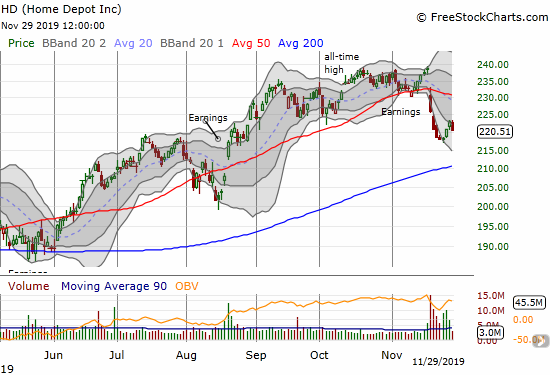
Source for charts: FreeStockCharts
Be careful out there!
Full disclosure: long ITB call spread, long ZG call option