
AT40 = 59.3% of stocks are trading above their respective 40-day moving averages (DMAs)
AT200 = 53.9% of stocks are trading above their respective 200DMAs
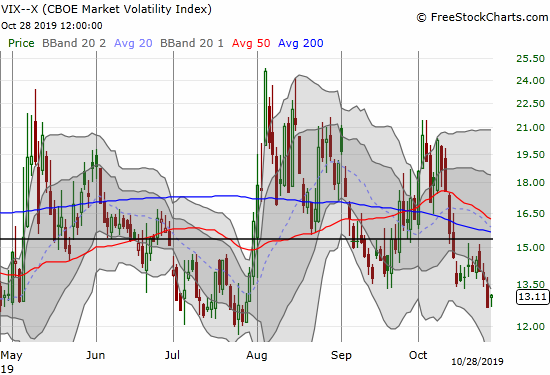
VIX = 13.1
Short-term Trading Call: neutral
Stock Market Commentary
A Sufficient Resolution
Seems about right. Just as I switch from a (cautiously) bearish stance to neutral, the stock market throws more definitively bearish vibes.
The S&P 500 (SPY) darted confidently into a new all-time high with a 0.6% gain while T2108 (AT40), the percentage of stocks trading above their respective 40-day moving averages (DMAs), definitively failed to confirm the highs with a fade back to flat on the day.
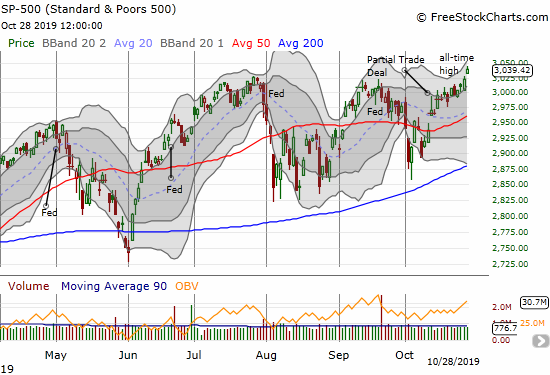
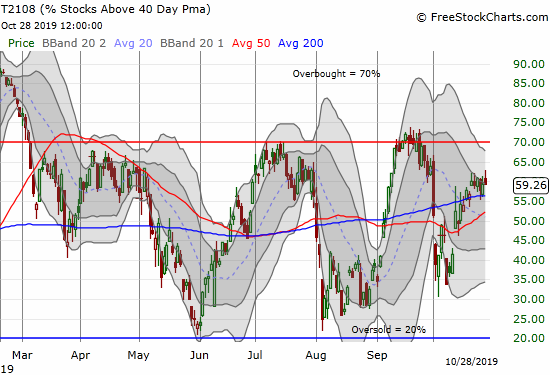
The divergent paths of the two indices is bearish because the rising tide is not lifting enough boats. The bearish divergence is a specter looming larger and larger over the upward price action. These ghosts are largely hidden from bulls who are focused on the price action of major indices. While the S&P 500 (SPY) pushes higher, fewer and fewer stocks are effectively participating in the upward momentum.
Only AT200 (T2107), the percentage of stocks trading above their 200DMAs, provided a small caveat with a small breakout to 53.9% and a one-month gain. Still, AT200 remains six percentage points away from a new high for the year.
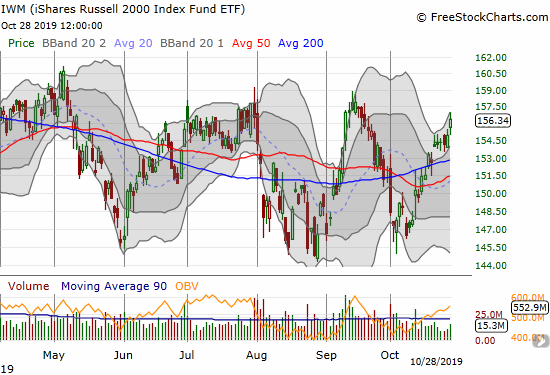
The iShares Russell 2000 Index Fund ETF (IWM) actually did not contribute to the bearish divergence. IWM gained 0.9%. Per my plan, I bought IWM calls right after the open. IWM’s slight out-performance suggests that IWM is indeed ready to play catch-up with the upward push of the S&P 500.
Volatility
I did not complete the other part of my plan to refresh a bet long volatility ahead of the Federal Reserve’s next announcement on monetary policy on Wednesday. The small gain in the volatility index (VIX) despite the gains for the S&P 500 gave a small confirmation of troubles ahead with the Fed’s announcement. I still find it hard to fathom that the Fed is cutting rates with the S&P 500 at or even near all-time highs. Add to the scene a macro picture that is supposedly improving with a Partial Trade Deal, and I have to believe the Fed will feel compelled dial back its dovishness. I will make sure to get refreshed long volatility during Tuesday’s trading.
Stock Chart Reviews – Below the 50DMA
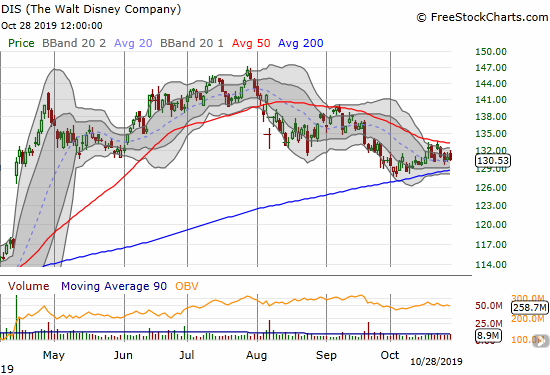
Disney (DIS)
Disney (DIS) is back on my radar as the stock sits 11.0% below its all-time high set in July. DIS is a framed picture of a major stock failing to confirm the new all-time high in the S&P 500. DIS is a clear buy on a 50DMA breakout and a short below 200DMA support. I think either move should be sustained and tradable given it would break through a narrowing wedge (or triangle) pattern.
Stock Chart Reviews – Above the 50DMA
iShares Dow Jones Home Construction ETF (ITB)
Even more than Disney, iShares Dow Jones Home Construction ETF (ITB) screamed out the non-confirmation of a bearish divergence. ITB suffered a rare bout of under-performance by losing 1.7% on the day. This pullback happened right after ITB on Friday directly challenged its multi-year high from January, 2018. The question now is whether today’s sharp selling marks some kind of top or a short pause ahead of the next breakout.
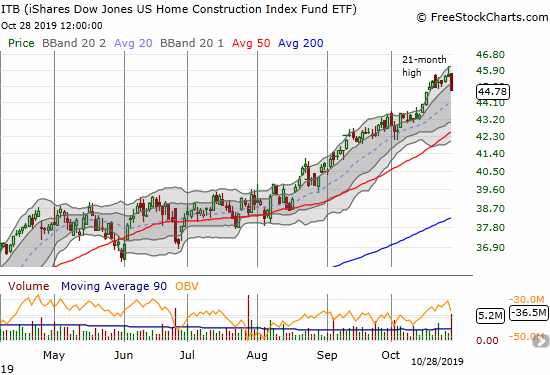
CNBC Fast Money’s Carter Worth used the specter of a double-top in ITB to make a short-term trading call down to the low $40s. As a reminder, I plan to take profits on my January $40/44 call if ITB closes below $44. Given the seasonally strong period for home builders is underway, I will look to buy whatever dips are coming.
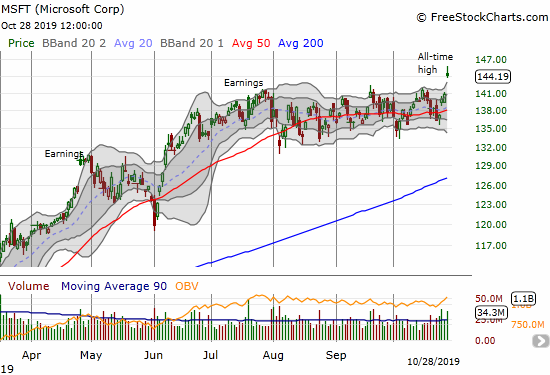
Microsoft (MSFT)
Microsoft (MSFT) made a clean breakout to a new all-time high on news of winning a major contract with the U.S. Department of Defense. Before this bullish move, MSFT was stuck in a 4-month trading range. MSFT is a buy again down to a close below the top of the trading range.
— – —
FOLLOW Dr. Duru’s commentary on financial markets via email, StockTwits, Twitter, and even Instagram!
“Above the 40” uses the percentage of stocks trading above their respective 40-day moving averages (DMAs) to assess the technical health of the stock market and to identify extremes in market sentiment that are likely to reverse. Abbreviated as AT40, Above the 40 is an alternative label for “T2108” which was created by Worden. Learn more about T2108 on my T2108 Resource Page. AT200, or T2107, measures the percentage of stocks trading above their respective 200DMAs.
Active AT40 (T2108) periods: Day #199 over 20%, Day #38 over 30%, Day #13 over 40%, Day #10 over 50% (overperiod), Day #3 under 60%, Day #26 under 70%
Daily AT40 (T2108)
")
Black line: AT40 (T2108) (% measured on the right)
Red line: Overbought threshold (70%); Blue line: Oversold threshold (20%)
Weekly AT40 (T2108)

*All charts created using FreeStockCharts unless otherwise stated
The T2108 charts above are my LATEST updates independent of the date of this given AT40 post. For my latest AT40 post click here.
Be careful out there!
Full disclosure: long VIXY calls, long ITB call spread, long IWM calls
*Charting notes: FreeStockCharts stock prices are not adjusted for dividends. TradingView.com charts for currencies use Tokyo time as the start of the forex trading day. FreeStockCharts currency charts are based on Eastern U.S. time to define the trading day.