
AT40 = 61.4% of stocks are trading above their respective 40-day moving averages (DMAs)
AT200 = 52.8% of stocks are trading above their respective 200DMAs
VIX = 17.2
Short-term Trading Call: cautiously bearish (caveats below)
Stock Market Commentary
A Conditionally Bearish Breakdown
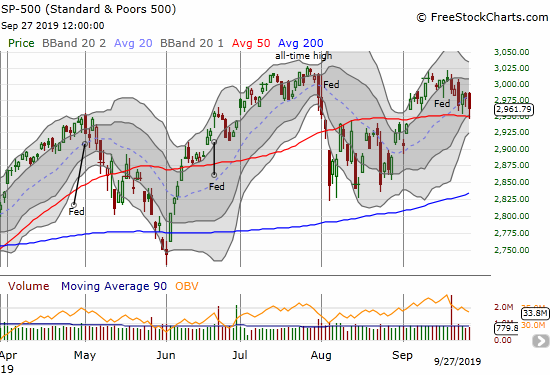
Friday’s trading action triggered my prime condition for flipping bearish. AT40 (T2108), the percentage of stocks trading above their respective 40-day moving averages (DMAs), dropped below 65% which is enough of a move to suggest that my favorite technical indicator has made a bearish failure to break into overbought trading conditions (above 70%). However, the S&P 500 (SPY) bounced back from a test of 50DMA support and ended the day with a 0.5% loss. The rebound prevents me from making as confident of a bearish call as I expected at this point, so the short-term trading call flips to cautiously bearish instead of an unqualified bearish. I bought October monthly $SPY puts as a first dip of the toe in the bearish side of the pool.
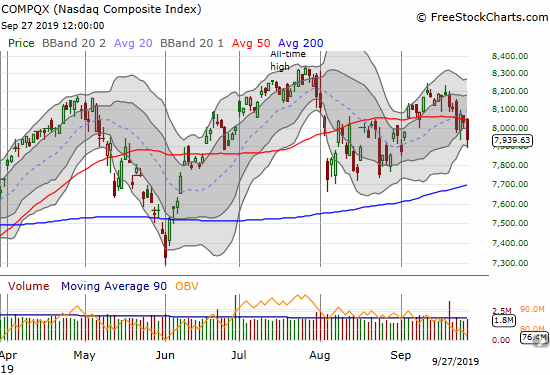
The NASDAQ (COMPQX) on the other hand is back in bearish territory as its 1.1% loss confirmed two previous 50DMA breakdowns. A test of 200DMA support is back in play.
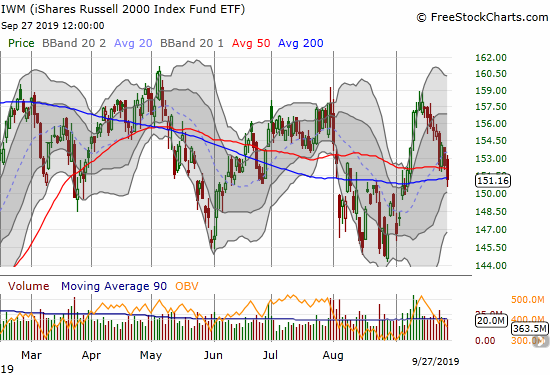
The positivity of the previous 50 and 200DMA breakouts for the iShares Russell 2000 Index Fund ETF (IWM) quickly ended. IWM still cannot pull away from a pivot around its major trendlines.
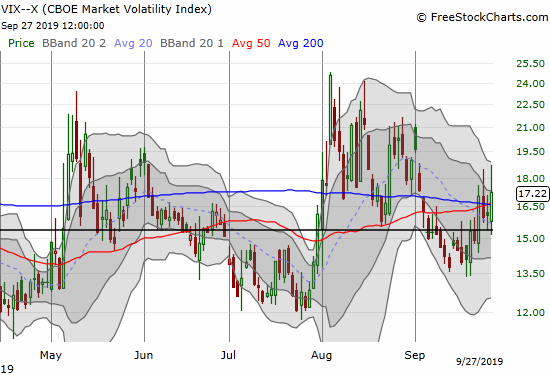
The volatility index (VIX) is confirming a bearish turn in sentiment as repeated efforts by volatility faders to push the VIX below its 15.35 pivot have failed. The VIX looks like it has easy upside potential to 20 despite the two big fades from intraday highs in the week. I remain surprised by the overall “sag” in volatility given what I perceive as an increase in risk and uncertainty in the macro environment (and no, I do not believe in climbing the proverbial “wall of worry”).
Currency Market Fails to Confirm
I looked to the currency markets for a final confirmation for flipping bearish but instead I saw more reason to caveat my bearishness. The Australian dollar (FXA) managed to rally against the Japanese yen (FXY). So AUD/JPY moved from unfolding an earlier bearish divergence to moving toward the edge of a bullish divergence. The fade from the intraday high and close at the declining 50DMA just barely disqualified this move from providing a bullish divergence (read “Why the Australian Dollar and Japanese Yen Matter for Stock Traders” for an explanation for why AUD/JPY matters for traders).

Source: TradingView.com
The Elephant in the Room
This blog focuses on financial markets, and I do what I can to ignore the political dramas acting on the periphery of financial risk and opportunity. The recent launch of an impeachment inquiry by House Democrats and the still developing facts and stories that catalyzed the inquiry are an irresistible distraction to the stock market. The U.S. government is sure to be paralyzed by the climactic acrimony. More importantly, the drama is sure to feed into the deteriorating prospects for a deal with China in the Trade War.
On balance, I see a stock market doing its best to ignore the swirl and the mounting risks. This relative complacency should provide opportunity especially on going short weakening stocks where I can expect an overdue extreme push downward. The tensions should mount with earnings coming next month, the second most dangerous month of the year for the S&P 500. Given September’s maximum drawdown was just a fractional loss, I think there is pent-up pressure to feed into the prospects for October’s maximum drawdown.
Stock Chart Reviews – Bearish
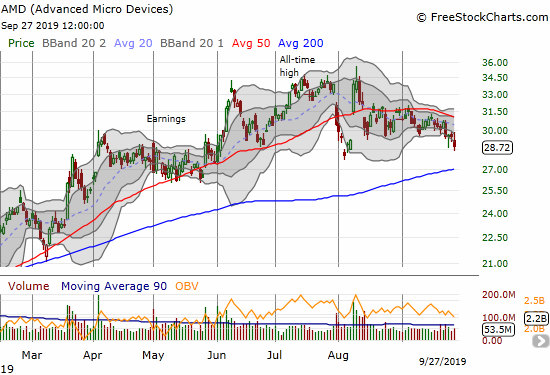
Advanced Micro Devices (AMD)
I think it was just a few months ago I called Advanced Micro Devices (AMD) one of the most bullish charts in the stock market. Times change fast! Now, AMD is in a bearish position after confirming 50DMA resistance and heading for the August low.
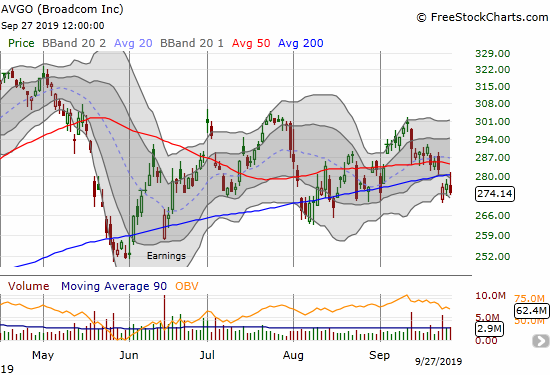
Broadcom (AVGO)
Broadcom (AVGO) has been here before. The stock suffered a 200DMA breakdown last week and confirmed the breakdown on Friday with a closing low for the week. AVGO survived 200DMA breakdowns 2 out of the last 3 months. Will this month be any different? The stock is bearish until it closes above its 50DMA again.
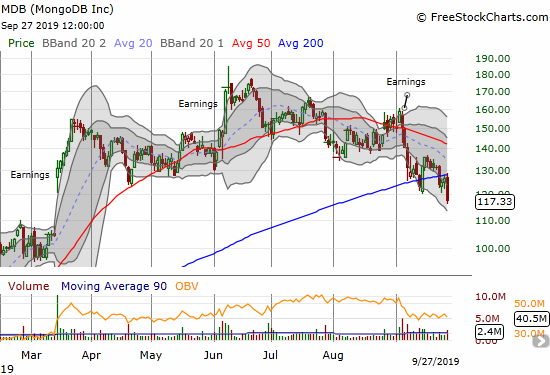
MongoDB (MDB)
I was wrong about MongDO (MDB). I thought the earlier 200DMA breakout marked a sustainable recovery. Instead, the stock traded higher only one more day before sliding right back into a 200DMA breakdown. With a 6-month closing low, the stock looks like it is headed for a fill of the March gap up. I decided to try to wait this one out with a put option in hand.
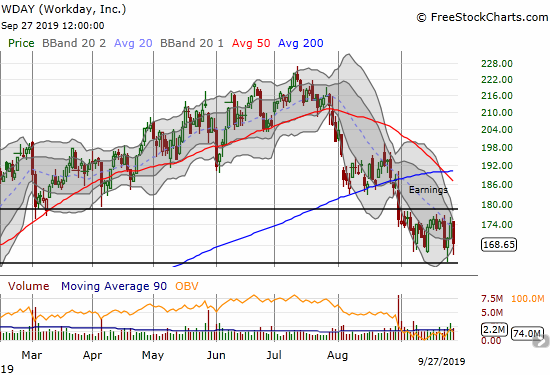
Workday (WDAY)
Sellers in Workday (WDAY) tried all month to follow-up the weakness from August earnings. The result has been a month of churn. I drew horizontal lines to mark a presumed trading channel. A breakout likely just has upside to declining 50DMA resistance. I am expecting an eventual breakdown.
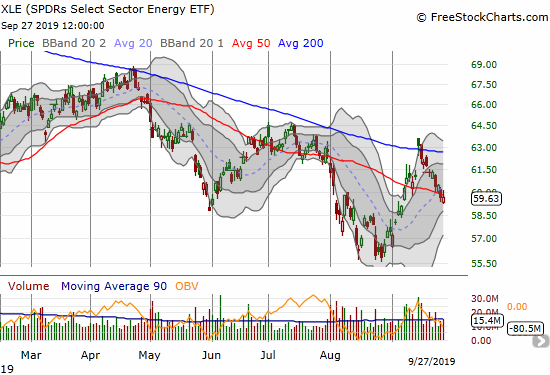
The SPDRS Select Energy ETF (XLE)
The SPDRS Select Energy ETF (XLE) quickly reversed its gap up in the wake of the attack on Saudi oil facilities. The reversal confirmed 200DMA resistance and now XLE even trades below its declining 50DMA again. While XLE is bearish, I like buying some calls as a fresh contrary play. Moreover, oil is presumably weak because of weak global economic conditions. Going long oil-related plays then becomes a double bonus play on fresh optimism on global growth and future supply disruptions.
Stock Chart Reviews – Bullish
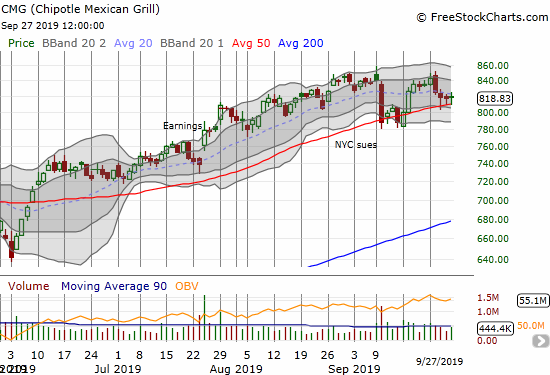
Chipotle Mexican Grill (CMG)
Chipotle Mexican Grill (CMG) is fighting a fascinating battle at 50DMA support. The last three days CMG tapped and bounced off 50DMA support. I think the next move will be decisive and sustained. Accordingly, I reloaded on a weekly call option ($840 strike) and a weekly $800/$790 put option. The technical bias here is for a jump higher.
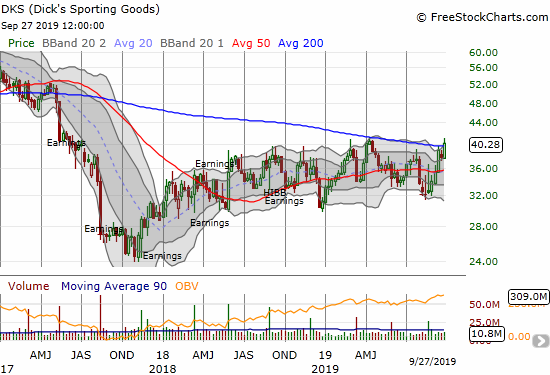
Dick’s Sporting Goods (DKS)
Dick’s Sporting Goods (DKS) has been a laggard for a long time. Yet, the stock provided several good opportunities to trade a very extended trading channel. The weekly chart below shows that DKS may finally be ready to break out…and make me wish I was still holding stock instead of patiently waiting for the next test of the bottom of the trading channel. For many months I have been buying shares and selling calls against the position whenever the stock trades close to the bottom of this channel.
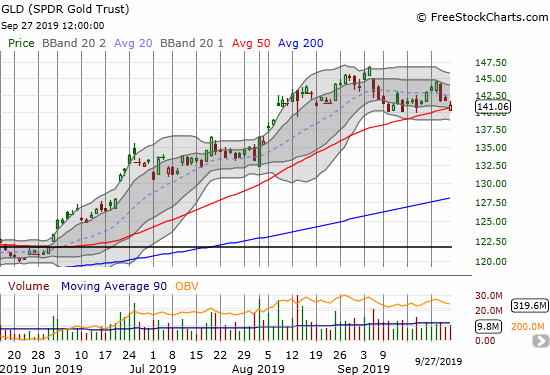
SPDR Gold Trust (GLD)
SPDR Gold Trust (GLD) was one of my “concerning signals.” The concern suddenly abated with GLD turning right around to challenge support at its 50DMA. A breakdown that pushes past September’s low would flip GLD from bullish to bearish….and leave me scratching my head. I will be reluctant to drop GLD from the bullish list until/unless it violates the consolidation period between June and August. I will finally buy some GLD call options in the coming week.
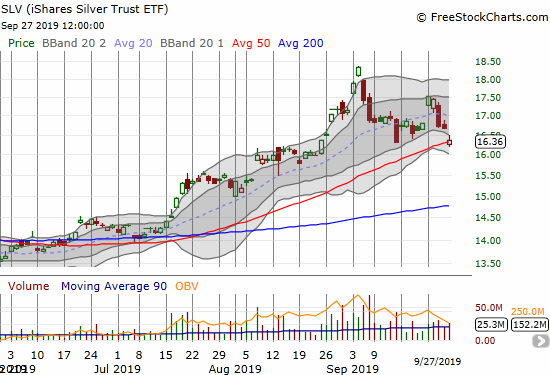
iShares Silver Trust iShares (SLV)
The iShares Silver Trust ETF (SLV) has a similar issue with GLD although its pullback is more dramatic. SLV went from a very bullish gap up and breakout to a complete reversal and precarious test of 50DMA support. So one more concerning signal has faded. I will be reluctant to drop SLV from the bullish column until/unless it breaks down below its 200DMA. I stubbornly added to my SLV call options.
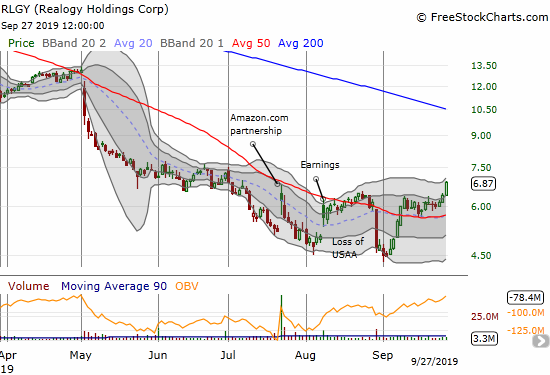
Realogy (RLGY)
I have been trying to put Realogy (RLGY) out of mind. Yet, the stock keeps reappearing on my radar. RLGY ended the week with a very bullish breakout on a 7.7% gain. Normally, I would put such a move on the buy list. For now, I am staying on the sidelines after being burned with my last buy. The main good thing I can say about that episode is that I sold early after the 50DMA breakdown; otherwise, I would have stopped out at the all-time low.
— – —
FOLLOW Dr. Duru’s commentary on financial markets via email, StockTwits, Twitter, and even Instagram!
“Above the 40” uses the percentage of stocks trading above their respective 40-day moving averages (DMAs) to assess the technical health of the stock market and to identify extremes in market sentiment that are likely to reverse. Abbreviated as AT40, Above the 40 is an alternative label for “T2108” which was created by Worden. Learn more about T2108 on my T2108 Resource Page. AT200, or T2107, measures the percentage of stocks trading above their respective 200DMAs.
Active AT40 (T2108) periods: Day #179 over 20%, Day #18 over 30%, Day #30 over 40%, Day #14 over 50%, Day #13 over 60%, Day #6 under 70%
Daily AT40 (T2108)
")
Black line: AT40 (T2108) (% measured on the right)
Red line: Overbought threshold (70%); Blue line: Oversold threshold (20%)
Weekly AT40 (T2108)

*All charts created using FreeStockCharts unless otherwise stated
The T2108 charts above are my LATEST updates independent of the date of this given AT40 post. For my latest AT40 post click here.
Be careful out there!
Full disclosure: long VIXY calls, short AUD/JPY, long SPY puts, long GLD shares and calls, long SLV shares and calls, long CMG call and put spread
*Charting notes: FreeStockCharts stock prices are not adjusted for dividends. TradingView.com charts for currencies use Tokyo time as the start of the forex trading day. FreeStockCharts currency charts are based on Eastern U.S. time to define the trading day.