
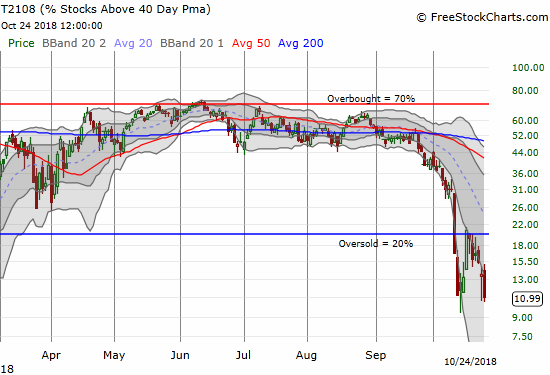
AT40 = 11.0% of stocks are trading above their respective 40-day moving averages (DMAs) – 6th day of oversold period following 4-day oversold period (as low as 10.6%)
AT200 = 25.5% of stocks are trading above their respective 200DMAs (as low as 26.7%)
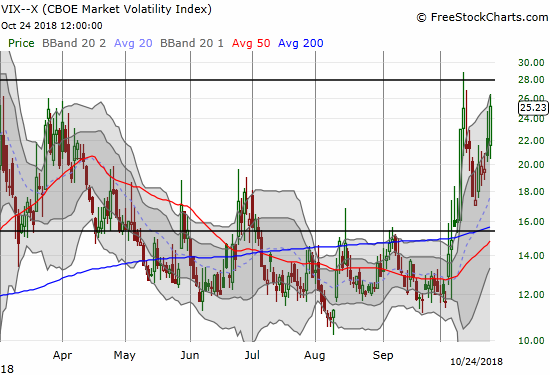
VIX = 25.2
Short-term Trading Call: bullish
Commentary
Time to take a step back and re-evaluate the the market. This oversold period has turned into a true battle.
AT40 (T2108), the percentage of stocks trading above their respective 40DMAs, closed at 11.0%, near its intraday low. This was a marginal new closing low for this and the previous oversold period. The oversold period has dragged on for 6 days and is separated by the previous 4-day oversold period by just one day. Assuming that one-day breakout was more noise than signal, the 10 total oversold days signals that the S&P 500 will not likely emerge from these oversold periods with gain. The good news is getting harder and harder to find for AT40. Only the intraday low from the previous oversold period provides a sliver of hope that the selling closer to an end than its beginning.
AT200 (T2107), the percentage of stocks trading above their respective 200DMAs, is a growing concern that clouds optimistic interpretations of the market action. This longer-term indicator closed at its intraday low with a reading of 25.6%. AT200 was last this low during the vicious January, 2016 sell-off. The new low solidified this oversold period as materially worse than the previous one. The technical damage in the market is pointing more and more to an extended oversold period or series of oversold periods.
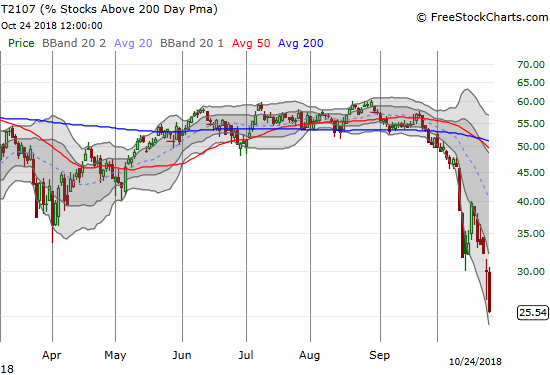
As a reminder, the broad technical damage signified by AT200 means that everyone with a diversified portfolio is looking at a collection of stock holdings that have largely broken down. It is a “second derivative” moment when the selling becomes so extreme that the bull market itself gets questioned and scenarios for a bear market loom more possible. It is a moment when the extreme of an oversold condition itself reaches historical extremes, and market participants should start considering a wider range of potential outcomes. This is the point where I expect the next rally out of oversold conditions to lead to an opportunity for selling and/or shorting. Resistance at 200DMAs loom larger and larger. This also happens to be the FIRST day that the 200DMA declined from the previous trading day since May 25, 2016; a yet steeper slope for this second derivative moment. May 25, 2016 ended months and months of 200DMA declines. It is now time for me to update and reference my 200DMA model for flagging significant tops and significant market sell-offs (title “How The S&P 500’s Current Breakdown Increases The Odds Of Further Selling”). I used a 5-day decline as the warning sign.
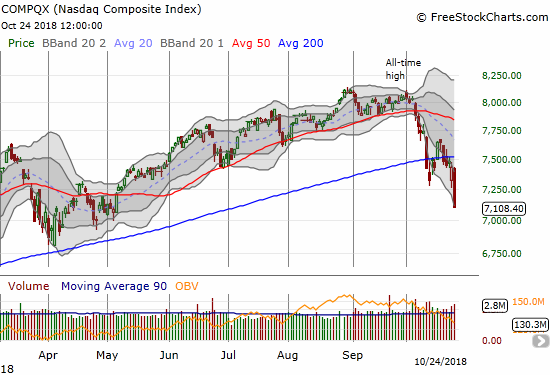
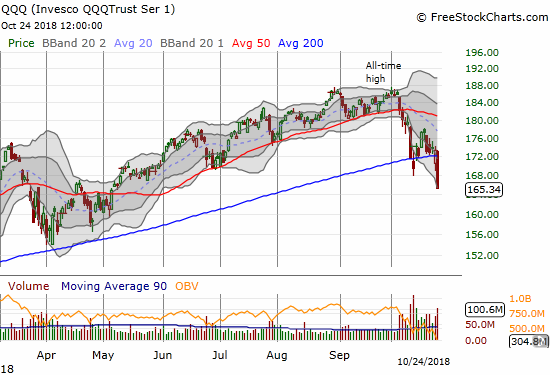
The NASDAQ now has a flattening 200DMA which will likely start a decline very soon. The NASDAQ plunged a gut-wrenching 4.4% to close near a 6-month low. The tech-laden index is once again stretched below its lower Bollinger Band (BB). The move also confirms the NASDAQ’s 200DMA breakdown. The Invesco QQQ Trust (QQQ) lost 4.6% and closed below its 200DMA for only the second time during this selling cycle. Its 200DMA is still pointing upward.
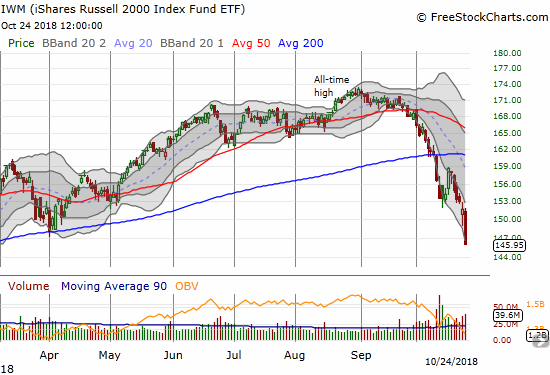
In the previous post I noted that the iShares Russell 2000 ETF (IWM) has a year-to-date loss, but it still had a ways to go to make new 2018 lows. Who knew that milestone was just a day away? Small caps rushed downward for a 3.8% loss and a test of the 2018 closing low set February 7th.
For Tuesday, I took solace in the inability of the volatility index, the VIX, to surpass the intraday high from the previous oversold period. Today, the VIX closed above the closing high of that period. This milestone opens up a greater likelihood that the VIX can soar a lot higher from current levels. The intraday high of 28.8 becomes a critical line in the sand.
The short-term trading call remains bullish because I expect an eventual bounce out of these oversold conditions, and I am sticking to the rules for trading oversold periods. I recognize the bearish nature of the current trading. However, almost without fail in the past, my efforts to get bearish at these market junctures have resulted in unacceptable losses and the inability to change my mindset fast enough to benefit sufficiently from the inevitable oversold rally. With the prospects for an exit extending to a longer time frame and given the looming resistance at 200DMAs, I will adjust my trades away from time-sensitive and volatility vulnerable options and more toward shares. I may also very selectively pick on post-earnings fades in individual stocks (Caterpillar (CAT) was a great example of a fade I should have tried today – it closed down another 5.6%!).
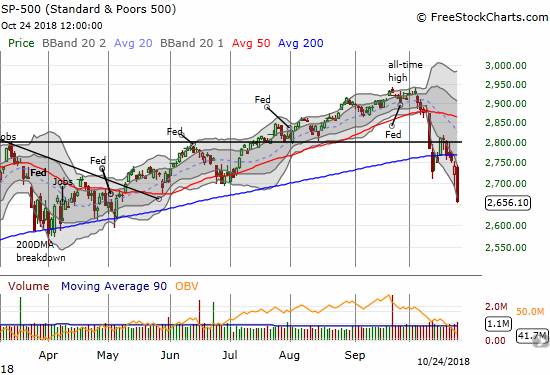
Again, the knowledge that November and December are two of the stock market’s tamest months as measured by average and median drawdowns should keep me from getting bearish for the remainder of the year. That analysis gave me a downside target for October of 2681 for the S&P 500 based on one standard deviation from the average drawdown. Now the S&P 500 is down 8.8% for the month with the close at 2656.10. A two standard deviation move takes the maximum drawdown to 13% and a target of 2535 on the S&P 500. So in the most extreme scenario I am willing to contemplate for October, the S&P 500 happens drops to a close right at 2018’s intraday low (2533) within the next week. I am gulping hard facing down this additional second derivative moment (between a one and two standard deviation drawdown).
Per my oversold trading strategy, I restarted a trade on SPY call options. I bought two tranches because the sell-off became so extreme. A low ball offer on fresh ProShares Ultra VIX Short-Term Futures (UVXY) put options also triggered near the close. I put that expiration date at November 9th in the hopes that at least the end of midterm elections will provide a sufficient catalyst for a volatility implosion.
CHART REVIEWS
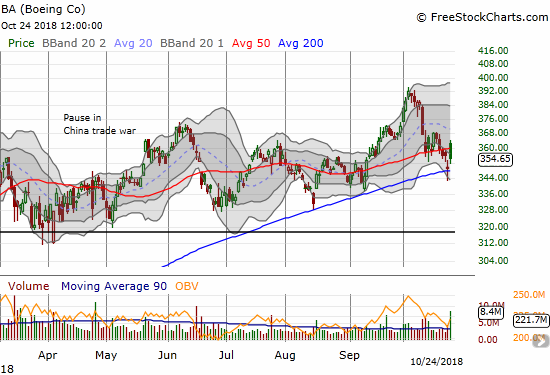
Boeing (BA)
The market celebrated BA earnings with a gap up above the 50DMA. Even with the rest of the market falling down around it, BA looked like it was strong enough to wake the market out of its funk. Instead, the market eventually took down BA. At one point, the stock almost reversed its entire post-earnings gap. The sharp rebound was also unable to resist the market’s gravity. BA ended up with a much smaller 1.3% post-earnings gain and a close under its 50DMA. The previous day’s doji now looks like a morning star at 200DMA support. My pre-earnings hedge will of course expire harmless (yes, VERY ironic on such a horrible day for the rest of the market!). Following the market’s lead, I flipped bullish on BA with a calendar call spread.
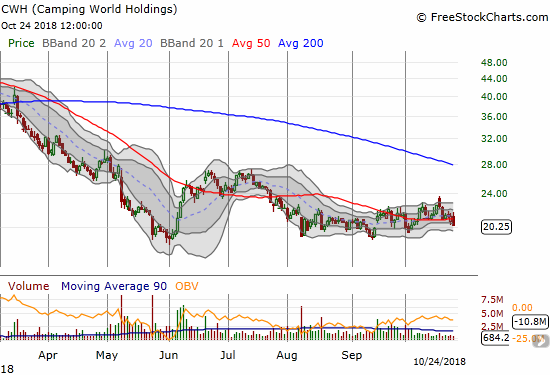
Camping World Holdings (CWH)
I periodically check in on CWH given the strong endorsement the stock and the company got from CNBC’s Jim Cramer. I was leery because all the bullish talk flew in the face of very poor technicals and a languishing sector. The stock quickly jumped 25% from there, and I essentially missed the boat. The stock eventually ground back down toward its 2018 lows and is now stuck in an extended trading range. The stock turned into another one of those cases where a CEO of a beaten down stock provides all sorts of good stories while disregarding the realities on the ground of the market (and convinces Cramer to do the same – the fundamentals sure can be seductive!). Yet, I keep watching for the next signs of life in the hopes I can catch the next pop…
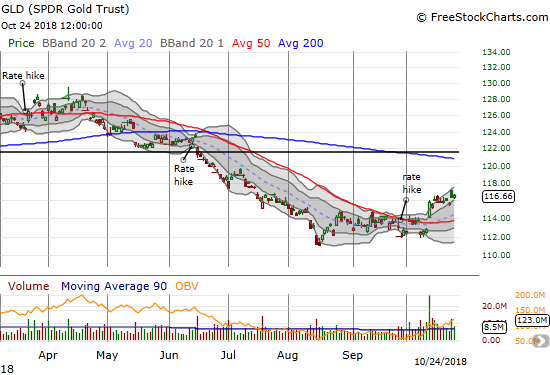
SPDR Gold Shares (GLD)
My last short-term trade on GLD was mistimed. GLD gapped up yesterday but faded as the market rallied. On a massively down day like today, I expected to see GLD soar all over again. Instead, it only gained 0.2%. While a new uptrend remains intact, I will stand down from opening a new short-term position.
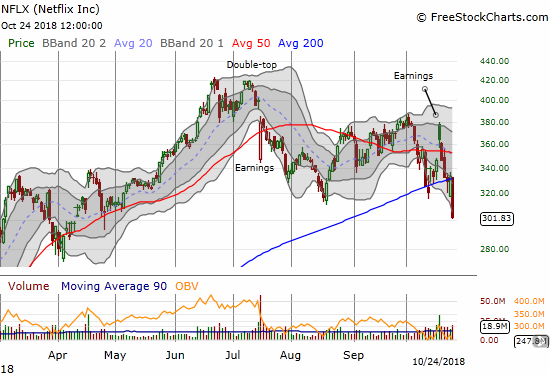
Netflix (NFLX)
I had to blink three or four times to believe the selling in NFLX. Sure I concluded NFLX topped out back in the summer, but the recent churn and support at the 200DMA dulled my senses to the earlier technical warnings. As I mentioned earlier, I was also thrown off by the initial post-earnings gap up last week. Now, NFLX is back to bearish behavior with a 9.4% drop in a move that represented a massive 200DMA breakdown. When times come to fade stocks, NFLX should be near the top of my list.
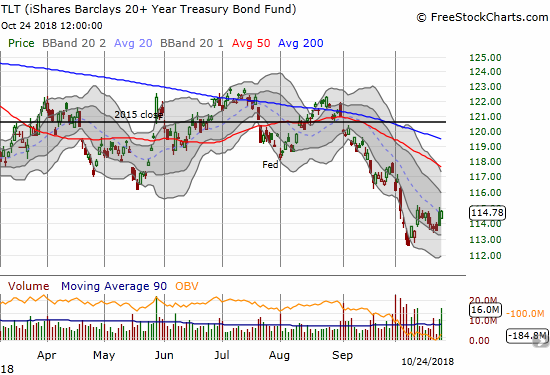
iShares 20+ Year Treasury Bond ETF (TLT)
Like GLD, I am surprised TLT is not higher as a refuge for panic and fear. I am not sure what to make of the sluggish response in bond yields. I assume the market is once again taking seriously the higher trajectory for long-term rates.
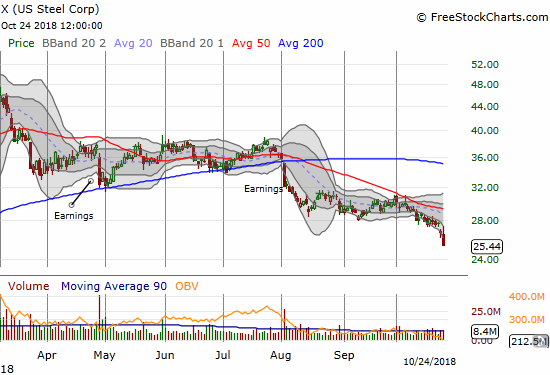
U.S. Steel (X)
U.S. Steel continues to be a chart of ironies. Steel tariffs were supposed to help the American steel industry and the stocks at least seemed to quickly forget the memo. U.S. Steel is now a whopping 44.7% down from its 2018 high. If protectionist trade policies cannot keep U.S. Steel propped up, then conditions must really be poor (or investors have the completely wrong narrative going!). U.S. Steel closed at a 52-week low and has little natural support from here to the May, 2017 low just above $19/share.
— – —
FOLLOW Dr. Duru’s commentary on financial markets via email, StockTwits, Twitter, and even Instagram!
“Above the 40” uses the percentage of stocks trading above their respective 40-day moving averages (DMAs) to assess the technical health of the stock market and to identify extremes in market sentiment that are likely to reverse. Abbreviated as AT40, Above the 40 is an alternative label for “T2108” which was created by Worden. Learn more about T2108 on my T2108 Resource Page. AT200, or T2107, measures the percentage of stocks trading above their respective 200DMAs.
Active AT40 (T2108) periods: Day #6 under 20% (oversold), Day #11 under 30%, Day #18 under 40%, Day #23 under 50%, Day #39 under 60%, Day #92 under 70%
Daily AT40 (T2108)
")
Black line: AT40 (T2108) (% measured on the right)
Red line: Overbought threshold (70%); Blue line: Oversold threshold (20%)
Weekly AT40 (T2108)

*All charts created using freestockcharts.com unless otherwise stated
The charts above are my LATEST updates independent of the date of this given AT40 post. For my latest AT40 post click here.
Related links:
The AT40 (T2108) Resource Page
You can follow real-time T2108 commentary on twitter using the #T2108 or #AT40 hashtags. T2108-related trades and other trades are occasionally posted on twitter using the #120trade hashtag.
Be careful out there!
Full disclosure: long SPY calls, long UVXY puts, long GLD shares
*Charting notes: FreeStockCharts.com stock prices are not adjusted for dividends. TradingView.com charts for currencies use Tokyo time as the start of the forex trading day. FreeStockCharts.com currency charts are based on Eastern U.S. time to define the trading day.