
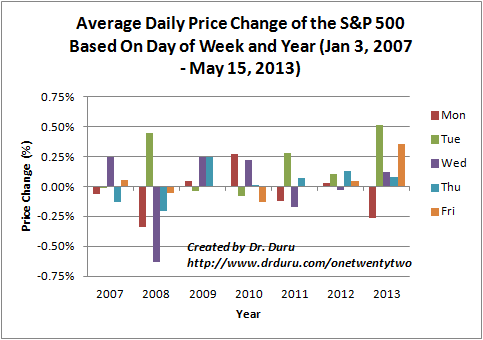
Back in 2012 and 2013, I wrote pieces describing some interesting daily trading patterns in the S&P 500 (SPY). The effects looked big enough to matter. In particular, Mondays and Tuesdays showed outsized performance differences from other days in the week. The performance divergences were very large in the first 5 months of 2013 as shown below.
Thanks to questions from a reader, I decided to update this analysis. However, this time around, I started with the statistics of difference: calculating whether observed differences are very unlikely random or chance occurrences – statistical significance. I used t-tests for paired comparisons and ANOVA (the analysis of variance) for group comparisons (single factor). All price data came from Yahoo Finance for the S&P 500. (A link to the Google sheet is available upon request).
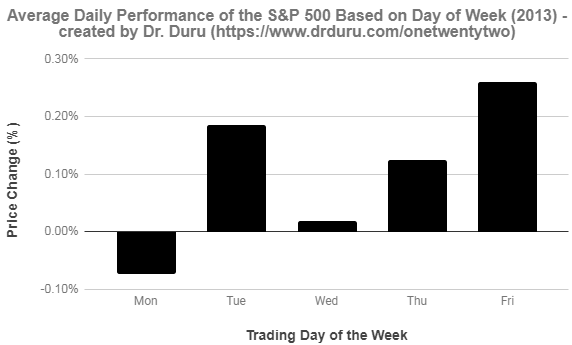
This more rigorous lens was very instructive. While the year 2013 through May 15th did indeed produce statistically significant differences in performance across the weekdays that confirmed visual inspection (ANOVA p-value of 0.02) , the year ended with a kind of reversion to the mean. By the end of 2013, there was NO statistically significant difference in performance across the weekdays (p-value of 0.12). The chart below shows how overall performance compressed. For example, Tuesday went from an average 0.50% daily performance to 0.19% and Friday became the day with the largest average daily performance.
This compression could have easily occurred from the equalizing force of smart traders and algorithms noticing the anomalous performance divergences. Whatever the reason, these dynamics highlighted a danger in acting on such patterns: the window of opportunity is short. The bigger opportunity may be in fading anomalous patterns back to more historic norms (this approach forms the basis of my strategy for trading market extremes). Of course, the parallel risk in 2013 lay in timing the end of the anomaly.
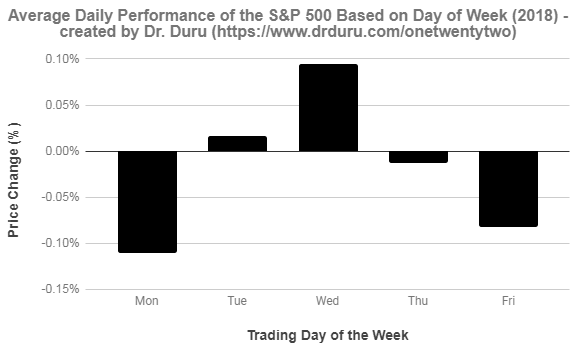
After turning the analytic gaze on to other years, I realized that the norm indeed appears to be that the average daily performance of the S&P 500 (SPY) is not statistically significant across weekdays. (Interestingly, 2013 turned out to have the lowest p-value of the years from 2010 to 2018). I used pairwise t-tests to find any differences of interest between specific weekdays. Last year, 2018, turned up nothing. Finally, in 2017, I found a statistically significant difference (p-value .03) between Thursday and Friday with average daily performances of -0.04% and 0.14%, respectively. Talk about data fishing!
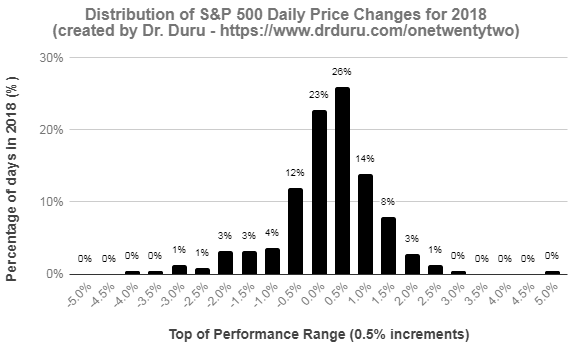
Averages say nothing about the magnitude and frequency of the kinds of prices changes. A year where half the days changed +5% and half the days changed -5% would have the same 0% average daily performance as a year where half the days changed 0.1% and half the days lost 0.1%. A distribution of daily price changes helps identify any notable contours in the performance profile.
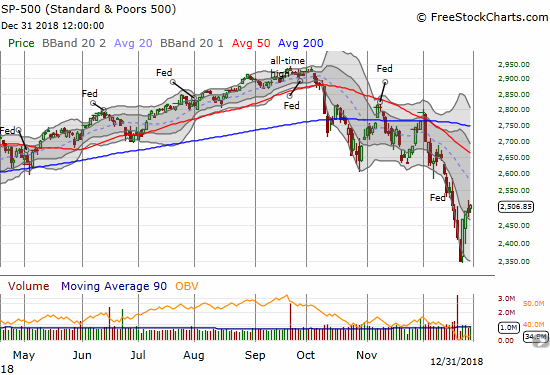
For 2018, 49% of all the daily price changes fell in the range of -0.5% to 0.5%. A negative skew occurred with a long tail to the left. However, to the right, the S&P 500 experienced a much larger share of up days from 0.5% to 1.5% versus down days from -0.5% to -1.5%. The year 2018 was indeed wild.
Be careful out there!
Full disclosure: long SSO, long SPY calls