
AT40 = 51.6% of stocks are trading above their respective 40-day moving averages (DMAs)
AT200 = 54.6% of stocks are trading above their respective 200DMAs
VIX = 12.1
Short-term Trading Call: cautiously bullish
Commentary
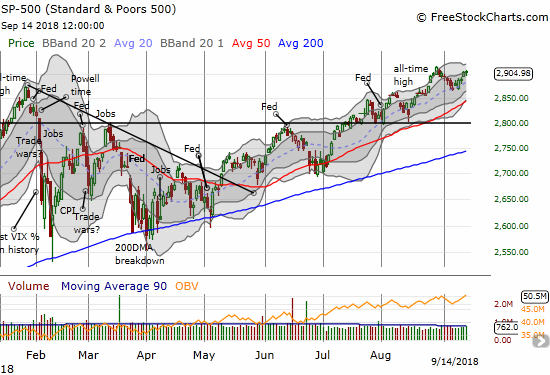
I flipped cautiously bullish last week. As I suspected, the prospects for a bounce were not as good as the previous time the stock market was similarly over-stretched. The S&P 500 (SPY) gained 1.1% in a week of choppy, sometimes slow-motion, trading action. On Monday, the index trickled higher into its short-term downtrend line. It gapped down on Tuesday only to bounce right back for a breakout. On Thursday, the index gapped up. The index stopped short of its all-time high, and I decided to take profits on my SPY call options. While the 20-day moving average (DMA) held well as support, I did not see enough strength to justify the risk of hanging around much longer (calls had an expiry this coming Friday). I will recharge the trade on the next dip to or toward the 20DMA (the dotted line in the graph).
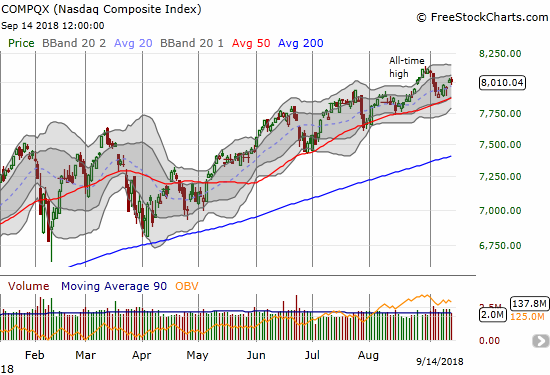
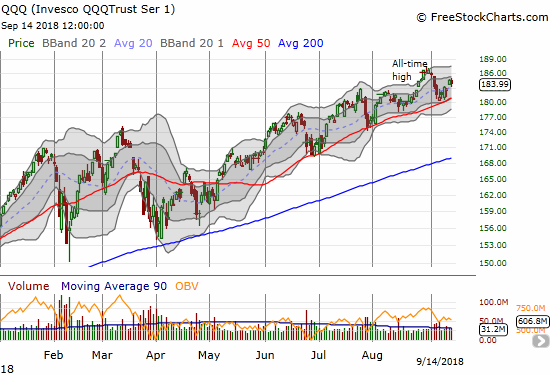
The NASDAQ and the Invesco QQQ Trust (QQQ) were a little more definitive than the S&P 500 in their bounces away from 50DMA support. The 20DMA looks ready to become support for the current upswing.
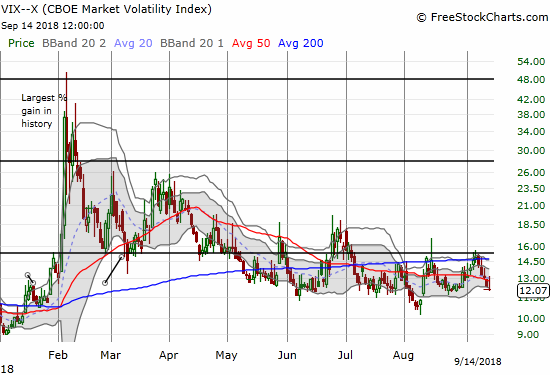
While the major indices tentatively reached higher, the volatility index, the VIX, definitively imploded all over again. The VIX fell every single day of the week. Friday’s drama beat Tuesday’s drama by swinging all the way from above Thursday’s intraday high to a close at a 3-week low. The overall swift return to complacency supports a bullish bias for the coming week even with the renewed headlines generating trade war angst.
AT40 (T2108), the percentage of stocks trading above their respective 40DMAs, sealed my impression of a tentative week. My favorite technical indicator swung around from lows to highs but barely made any progress: it closed the previous week at 48.0% and ended the week at 51.6%. AT40 did little to confirm the stock market’s bounce. The coming week could then hold good upside potential as loitering stocks get moving. The alternative scenario is a break of the 45% level that has held as support since late April. Such a move would require the kind of selling that creates oversold conditions (AT40 below 20%). Needless to say, I am still holding my trading hedges.
CHART REVIEWS
While AT40 exposed the lack of enthusiasm in the overall stock market rebound, there are of course, as always, dramatic stock moves of interest.
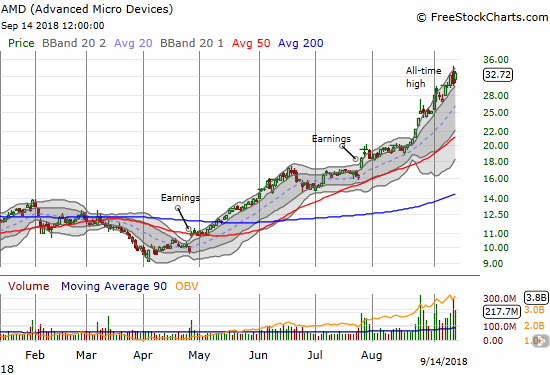
Advanced Micro Devices (AMD)
When the herd is right, it is a powerful sight. The upward surge in AMD continues apace much to my surprise. Per my trading strategy, I jumped into AMD call options once the blow-off topping action was invalidated. With analysts continuing to chase AMD with upgrades and bullish commentary, stubbornly betting with the herd has become the clear winner on AMD.
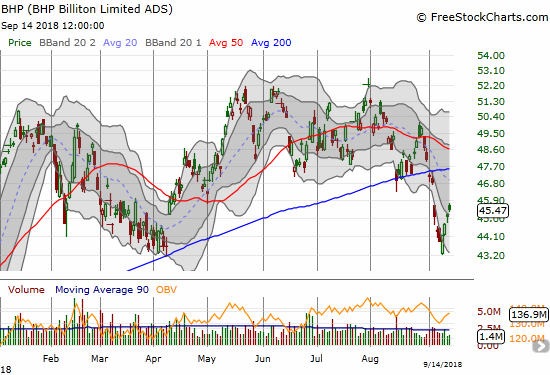
BHP Billiton (BHP)
I used the latest sell-off in commodities to finally switch around my BHP vs Rio Tinto (RIO) pairs trade. The latest wave of selling in BHP reached a crescendo after the stock gapped down well below its lower Bollinger Band (BB). Subsequent buying interest was strong enough to close BHP with a gain on the day. I bought call options near the close of that day. The stock has been off to the races ever since. Despite this show of strength off the lows, I still think of the commodity space as overall weak and suggesting that the global economy is not well.
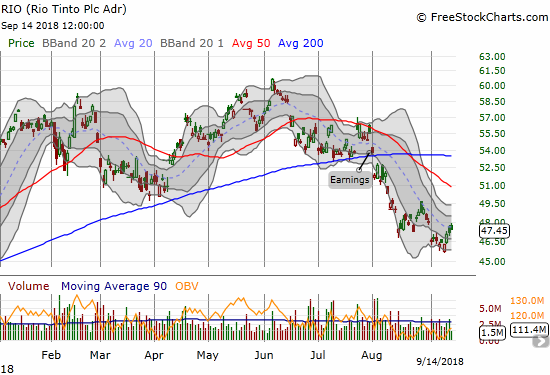
Rio Tinto (RIO)
RIO found a bottom with much less drama than BHP. I bought put options before the BHP call options. If RIO does not attract more interest soon, I anticipate new lows in due time.
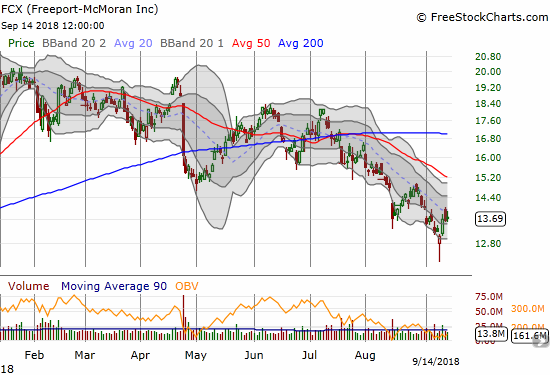
Freeport-McMoran (FCX)
Declining copper prices compounded FCX’s operational issues this year. The downtrend off January’s high accelerated off July’s temporary high. Like many commodity plays, buyers rushed into FCX at the intraday lows on Tuesday, September 11. The buying was strong enough to create a long hammer bottoming pattern. The following rebound so far has found stiff resistance at the downtrending 20DMA.
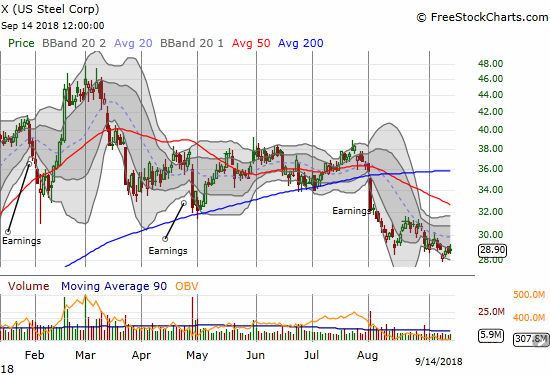
U.S. Steel (X)
U.S. Steel is still not benefiting from the tariffs on steel (or perhaps it would have performed even worse than it is?). Last week, X gapped down to a new 10-month low.
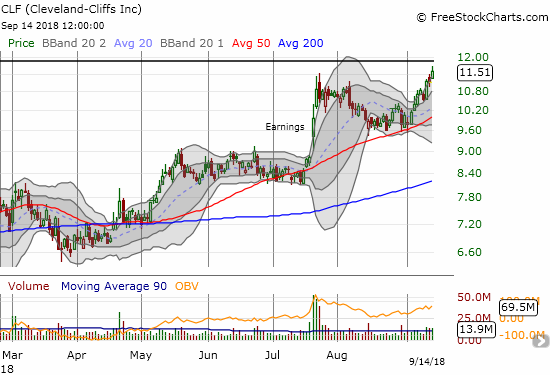
Cleveland-Cliffs (CLF)
While tariffs are not helping the stocks of steel producers like U.S. Steel, makers of the iron ore used by domestic steel producers seem to be grabbing the lions share of the benefit. I missed out on CLF’s great bounce off 50DMA support. I did not want to buy CLF without first reviewing the last earnings report. I simply never got around to doing that review.
Cleveland-Cliffs supports the steel tariffs through efforts like Keep America Steel Strong.
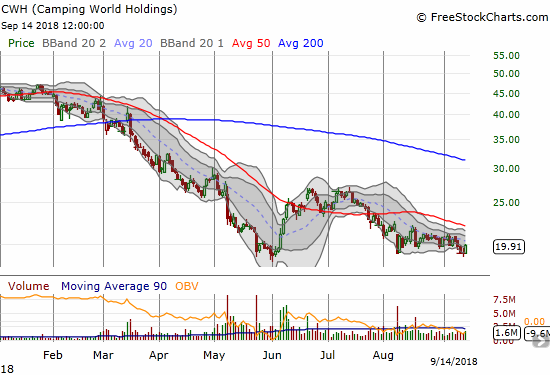
Camping World Holdings (CWH)
I first covered CWH back in June. I did not buy because the stock gained 25% in just three days and stopped cold at 50DMA resistance. I decided not to buy the 50DMA breakout or even the subsequent test of the 50DMA as support: persistent weakness in sector-mates Winnebago Industries (WGO) and Thor Industries (THO) made me wary and stayed my hand. Sure enough, the excitement over CWH faded away as a second test of 50DMA support gave way to a breakdown. CWH reported earnings on August 7th and the market responded by retesting the May and all-time low. While buyers almost closed the gap down in the next 6 trading days, the stock faded all over again for another test of the all-time lows. So despite the great things CWH’s CEO had to say in June, I consider this stock and story broken all over again.
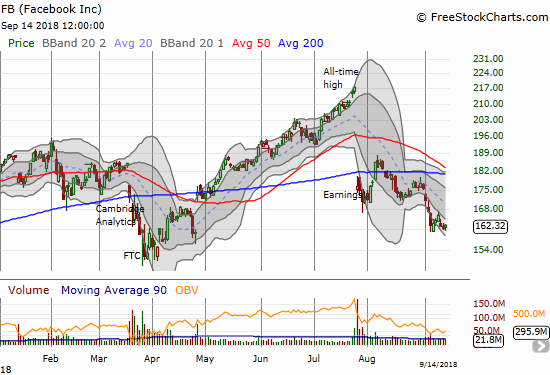
Facebook (FB)
Facebook bumped against stiff resistance at its downtrending 20DMA and dropped nearly straight down. Now the stock’s lower-BB is guiding the stock downward. I turned the crank on another short position this week. I have not been bearish enough on FB’s chart. A test of the March and 2018 low is in play.
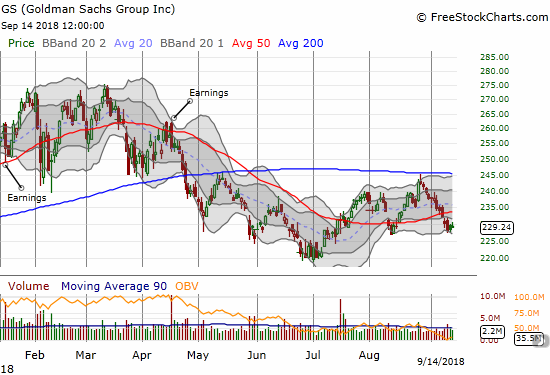
Goldman Sachs (GS)
GS is weak again and below its 50DMA. Last month, the 200DMA provided picture-perfect resistance. I failed to catch that trade. I am now watching to see whether GS can hold support from August’s 50DMA breakdown and low. If not, I will try a fresh short (put options). I am as yet undecided on whether I would go long on a new 50DMA breakout. Regardless, weakness in GS is just one more source of sector weakness that keeps me wary and cautious about the health of the stock market.
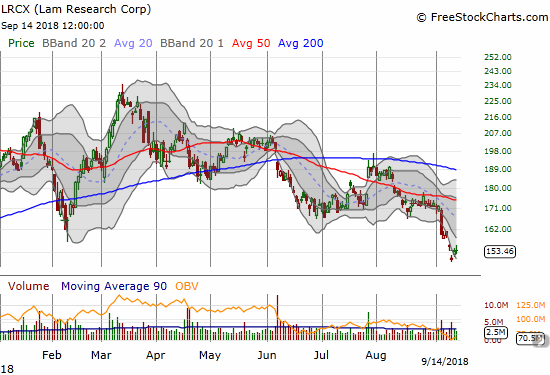
Lam Research (LRCX)
Speaking of sector weakness, semiconductors were smacked down again last week – outside of the fortunate few like AMD and Nvidia (NVDA). A selling crescendo occurred on Wednesday, a day after a similar rush for commodity plays. LRCX has suffered much of 2018 since hitting an all-time high in March that now looks like the third peak of a major topping pattern.
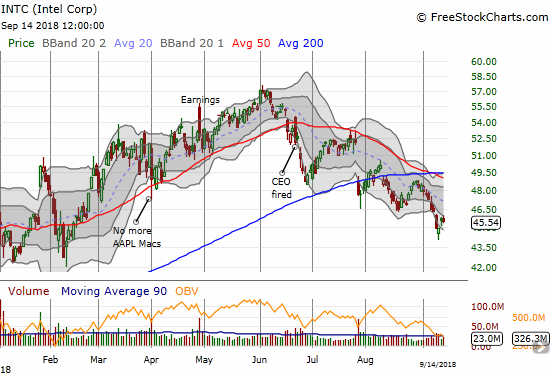
Intel (INTC)
INTC has of course suffered company-specific issues. The on-going sell-off in the semiconductor sector has piled onto INTC’s problems. After the stock printed a hammer and 7-month low, I decided to add to my existing INTC calls as a low-priced, pre-earnings speculation. I expect overhead resistance to hold on the extension of any short-term relief rally.
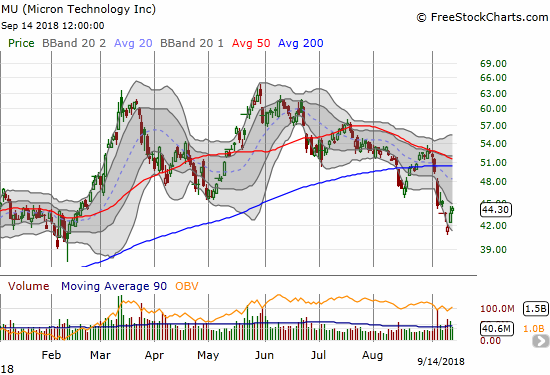
Micron (MU)
Even MU has succumbed to semi weakness. Despite a steady stream of strong results and a large share buyback, MU has broken down like much of the rest of the sector. August’s sharp relief rally met stiff resistance at a downtrending 50DMA. This month, MU sliced right through 200DMA support and signaled major weakness. Last week, after MU opened higher the day after the big selling crescendo, I bought call options for a swing trade under the assumption the stock was launching a new relief rally. I am hoping the stock continues to rally into earnings on September 20th. I plan to sell my calls ahead of earnings as I am already in accumulation mode on shares.
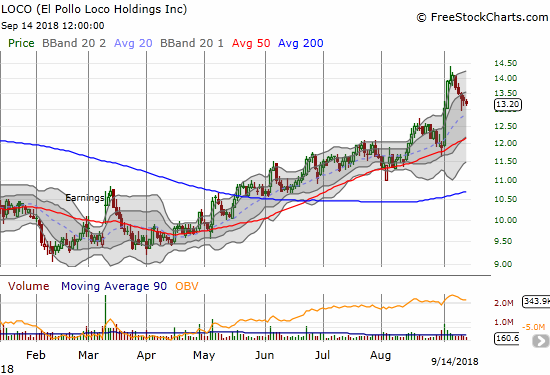
El Pollo Loco (LOCO)
The chicken trade continues to deliver. I started re-accumulating shares in LOCO in March and got a boost from a Jim Cramer recommendation in June. The really big boost came at the beginning of this month. I took profits as LOCO tested the June, 2017 high. Given the current uptrend, I like returning to the play on a 50DMA retest.
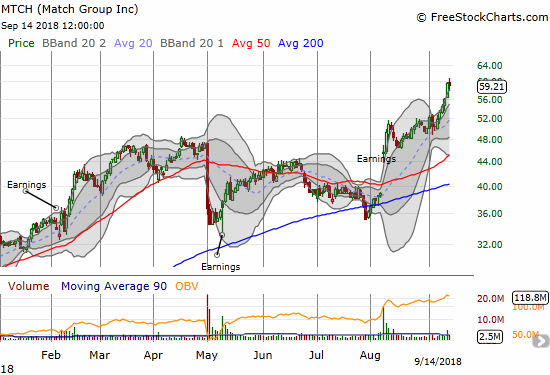
Match Group (MTCH)
Last month I pointed out that MTCH was strong enough for a buy on a breakout. The breakout happened, but I missed the opportunity. The stock is up about 13% since it broke out to a new all-time high on September 4th. MTCH is now running near parabolic.
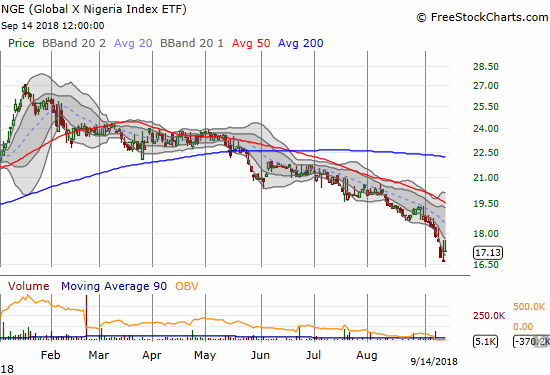
Global X MSCI Nigeria ETF (NGE)
Higher oil prices have not helped Nigerian stocks. With a wobbling economy and Presidential elections coming in early 2019, investors are in flee mode for NGE. After making a profitable trade on NGE off 2017 lows, I am eyeing NGE once again. I am definitely a buyer on a retest of that low. In the meantime, I am looking for ANY sign of life from the buyers.
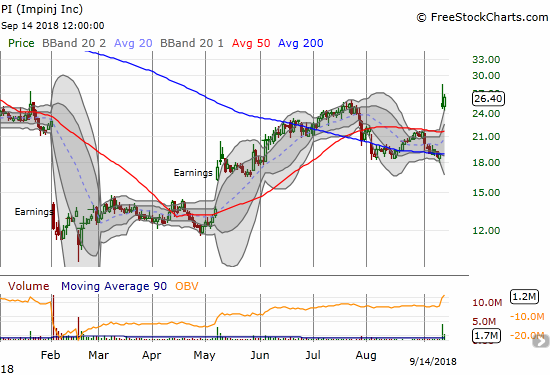
Impinj (PI)
In my previous Above the 40 post, I expressed my hesitations on going long PI again. I have frequently seen issues with 10Q filings taking weeks and months. In this case, PI took 4 weeks to fix the issue, and I now find it ironic I mulled over the risk/reward just ahead of the fix. PI soared at one point for a 51.7% intraday gain, but settled back to close in-line with the July high. Buyers returned the next day for a 5.6% gain.
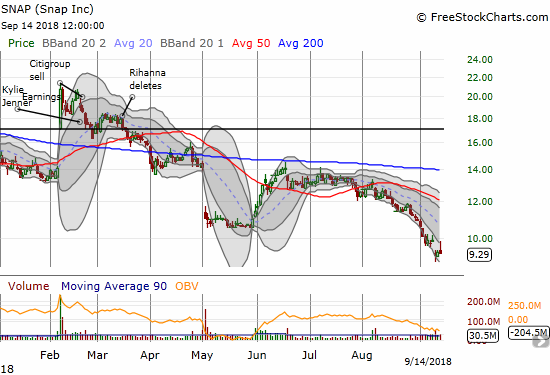
Snap (SNAP)
My bad on SNAP. It is that simple. I made a play for SNAP on what I thought was a bottoming process; the bottom has now fallen out. Even selling calls against the position could not compensate for the current collapse. With SNAP in single digits, the stock enters the danger zone of pressure. I still think SNAP will eventually figure out how to effectively monetize its audience, but there could also be a race against time with social media under increasing scrutiny. Indeed, some pairs trades in this sector make sense. (I am really feeling the irony now of starting out as a strong bear on SNAP!)
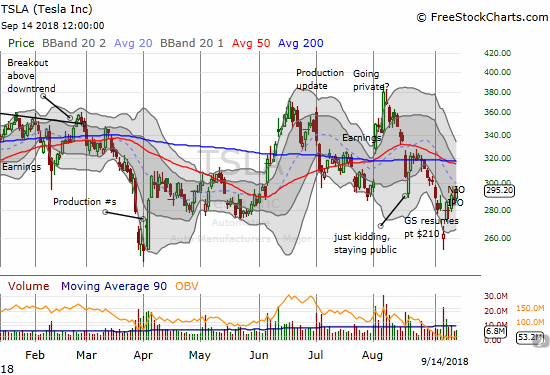
Tesla (TSLA)
I am glad I decided not to dump my shares into the panic. I sold into the bounce the next day around $280. I am impressed the stock was able to keep pushing higher even with the IPO of Chinese electric car maker Nio Limited (NIO). Still, my interest in the bullish case for TSLA is over for now; any trades going forward will be strictly short-term. Another test of 50/200 DMA resistance is in play.
— – —
FOLLOW Dr. Duru’s commentary on financial markets via email, StockTwits, Twitter, and even Instagram!
“Above the 40” uses the percentage of stocks trading above their respective 40-day moving averages (DMAs) to assess the technical health of the stock market and to identify extremes in market sentiment that are likely to reverse. Abbreviated as AT40, Above the 40 is an alternative label for “T2108” which was created by Worden. Learn more about T2108 on my T2108 Resource Page. AT200, or T2107, measures the percentage of stocks trading above their respective 200DMAs.
Active AT40 (T2108) periods: Day #144 over 20%, Day #113 over 30%, Day #108 over 40%, Day #5 over 50% (overperiod), Day #11 under 60%, Day #64 under 70%
Daily AT40 (T2108)
")
Black line: AT40 (T2108) (% measured on the right)
Red line: Overbought threshold (70%); Blue line: Oversold threshold (20%)
Weekly AT40 (T2108)

*All charts created using freestockcharts.com unless otherwise stated
The charts above are my LATEST updates independent of the date of this given AT40 post. For my latest AT40 post click here.
Related links:
The AT40 (T2108) Resource Page
You can follow real-time T2108 commentary on twitter using the #T2108 or #AT40 hashtags. T2108-related trades and other trades are occasionally posted on twitter using the #120trade hashtag.
Be careful out there!
Full disclosure: long BHP calls, long RIO puts, long UVXY calls, short FB, long INTC calls, long MU shares and calls, long SNAP
*Charting notes: FreeStockCharts.com stock prices are not adjusted for dividends. TradingView.com charts for currencies use Tokyo time as the start of the forex trading day. FreeStockCharts.com currency charts are based on Eastern U.S. time to define the trading day.
Do you think this is a CWH reversal or much of the same? Thanks for your feedback.
Sure looks like it could be a successful test of the lows. But I wouldn’t chase the move and instead wait for at least one more day of buying to confirm renewed interest.
Still waiting I guess. not sure. Any thoughts?
I am definitely still waiting. Stock perfectly fell back from resistance at its 50DMA.
Yeah I saw that. I think there is downturn coming in the market from what I can tell. I loved your DE trade. Unfortunately I sold in 120s after buying in 80s
Speaking of DE, it is breaking out above its 200DMA along with other strong industrial movers!