
AT40 = 48.0% of stocks are trading above their respective 40-day moving averages (DMAs)
AT200 = 54.7% of stocks are trading above their respective 200DMAs
VIX = 11.8
Short-term Trading Call: neutral (downgrade from cautiously bullish)
Commentary
I am not even going to try to explain why emerging markets and trade-sensitive stocks started this week so well in the wake of the double whammy of increased tariffs between U.S. and Chinese trade and a surge in U.S. long-term bond yields. Explanations might require trite and worn hindsights like “the market has already priced in the bad news” or “the bad news is not as bad as the market feared.”
Jack Ma’s decision to not create jobs in US shows China has leverage in trade war, Bessemer CIO says from CNBC.
Instead, I am watching closely the emergence of another bearish divergence.
The S&P 500 (SPY) made a marginal gain to close just under its all-time high. The previous day, the index bounced neatly off uptrending 20DMA support. Yet, AT40 (T2108), the percentage of stocks trading above their respective 40-day moving averages (DMAs), failed to follow. AT40 even sank on Wednesday to close at 48.0%, right back to its recent lows.
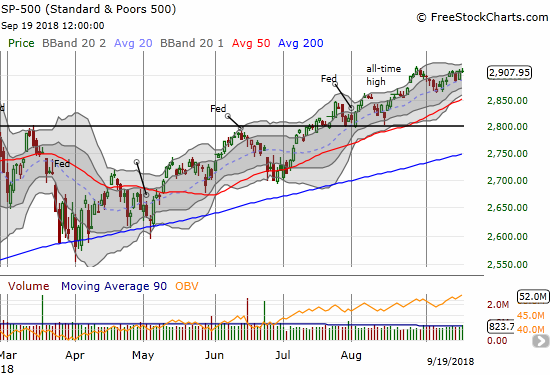
In recent posts, I have described the market as “stretched” when AT40 traded at these levels. Both times I traded SPY call options profitably. THIS time, I am watching warily as the divergent paths of AT40 and the S&P 500, small as they are, created a bearish divergence. With the volatility index, the VIX, breaking hard below 12 again, I am expecting a downside resolution to the bearish divergence: complacency is getting back to an extreme and the VIX has not recently spent much time at these low levels. I will be looking to reload on call options on ProShares Ultra VIX Short-Term Futures (UVXY). If I am wrong, then the VIX will likely sink further into extremely low volatility (ELV) territory (below 11). Such a move would force me to evaluate whether to make some new long plays. In the meantime, I downgraded my short-term trading call back to neutral in deference to the increased downside risk for the stock market.
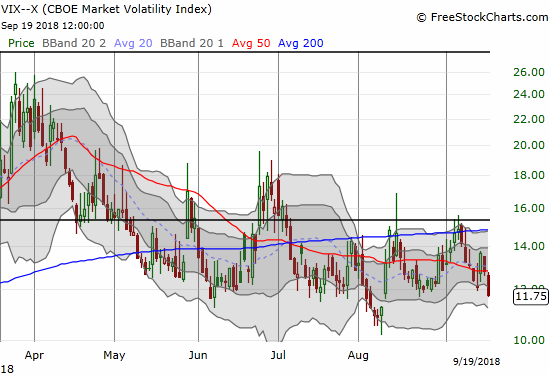
CHART REVIEWS
Tilray (TLRY)
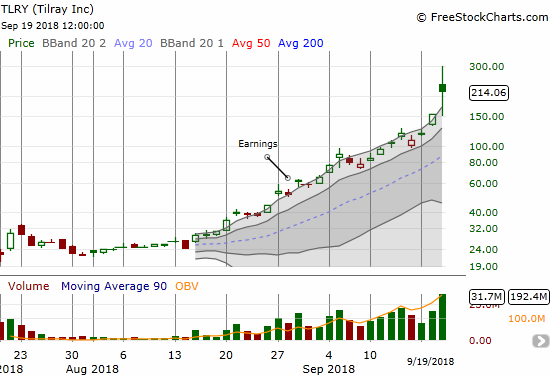
Almost 4 weeks ago I wrote about TLRY as a timely example of parabolic moves under the umbrella of FOMO – the fear of missing out. At the time, TLRY closed at $53.44 just ahead of reporting earnings. How quaint those times seem now.
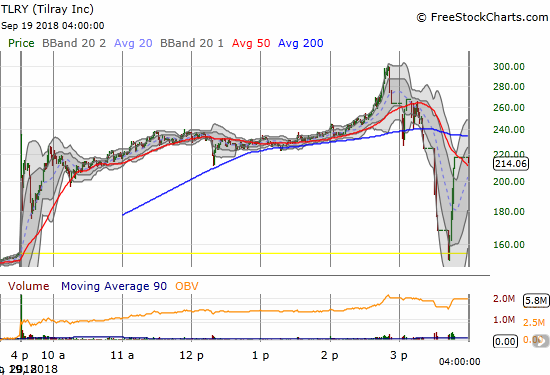
TLRY went truly parabolic on Wednesday. The stock gapped up 50.7%, took a dive, shot back up, meandered into an eventual climactic move soaring to $300 and a 93.6% gain! From there, the stock quickly collapsed 50% before bouncing sharply into the close for a net 38.1% gain on record trading volume. This trading action was about as extreme as it gets. The stock looks like it TRULY printed a blow-off top, but, as usual, the pattern requires confirmation: TLRY will need to close below the day’s intraday low…which conveniently is right around the previous day’s close. I am not even bothering to correlate these moves with news on the day. These kinds of moves happen when neither price nor valuation nor news really matters. Reportedly, TLRY is now worth more than half the stocks in the S&P 500 with about $28M in sales.
BHP Billiton (BHP)
Commodity plays are still on fire. BHP gained another 2.4% on the day and closed just below 200DMA resistance. I am very glad I reversed the direction on my BHP vs Rio Tinto (RIO) pairs trade. I took profits on my BHP call options well ahead of “schedule.”
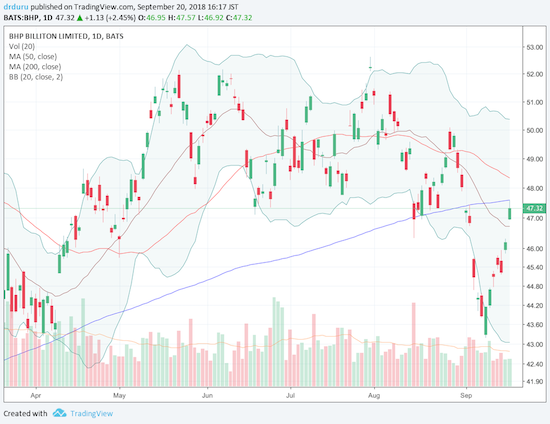
Source: Trading View
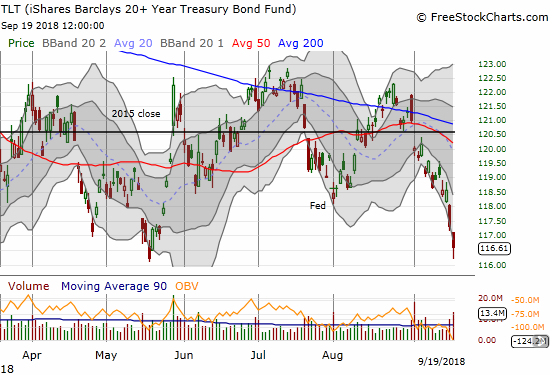
iShares 20+ Year Treasury Bond ETF (TLT)
TLT dropped 0.6% to close right at its low of the year. I sold my put options the previous day. I would have held longer if the puts did not expire this Friday. I am experiencing cognitive dissonance watching both commodities and interest rates surge this week. The combination suggests an expectation for a sudden flare-up of inflation and/or industrial/economic strength.
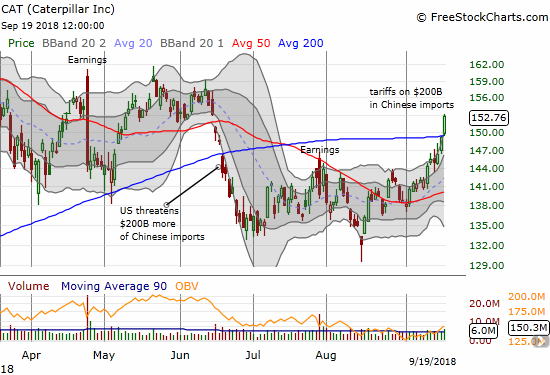
Caterpillar (CAT)
CAT stood to lose big with a fresh escalation of the trade war between the U.S. and China. Instead, CAT found new life. The stock gained 2.5% in a clean break above 200DMA resistance. While CAT faces plenty of overhead resistance from the previous consolidation period, this breakout is still bullish. I do not see a reason to refresh put options here as a hedge against bullishness. I will wait for CAT to get to higher prices or to break down again below its 200DMA.
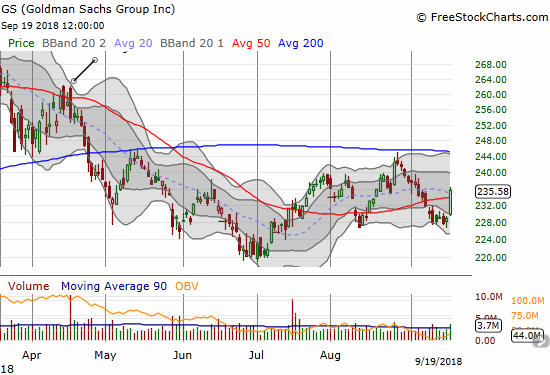
Goldman Sachs (GS)
Goldman Sachs reawakened…again. With the pick up in trading volume, I am assuming GS printed a successful test of support at its August low. A successful test also means GS confirmed a higher low and the beginning of what could be a long overdue sustained recovery.
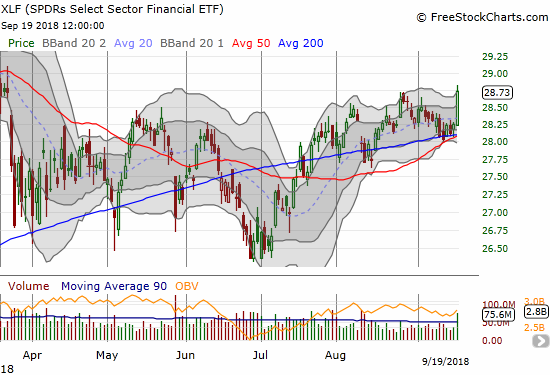
Financial Select Sector SPDR ETF (XLF)
Financials in general did well on the day. Presumably the big jump in interest rates rekindled interest in financials. I was not prepared to trade this move, but I am primed to buy the next dip.
— – —
FOLLOW Dr. Duru’s commentary on financial markets via email, StockTwits, Twitter, and even Instagram!
“Above the 40” uses the percentage of stocks trading above their respective 40-day moving averages (DMAs) to assess the technical health of the stock market and to identify extremes in market sentiment that are likely to reverse. Abbreviated as AT40, Above the 40 is an alternative label for “T2108” which was created by Worden. Learn more about T2108 on my T2108 Resource Page. AT200, or T2107, measures the percentage of stocks trading above their respective 200DMAs.
Active AT40 (T2108) periods: Day #147 over 20%, Day #116 over 30%, Day #111 over 40% (overperiod), Day #1 under 50% (underperiod ending 7 days above 50%), Day #14 under 60%, Day #67 under 70%
Daily AT40 (T2108)
")
Black line: AT40 (T2108) (% measured on the right)
Red line: Overbought threshold (70%); Blue line: Oversold threshold (20%)
Weekly AT40 (T2108)

*All charts created using freestockcharts.com unless otherwise stated
The charts above are my LATEST updates independent of the date of this given AT40 post. For my latest AT40 post click here.
Related links:
The AT40 (T2108) Resource Page
You can follow real-time T2108 commentary on twitter using the #T2108 or #AT40 hashtags. T2108-related trades and other trades are occasionally posted on twitter using the #120trade hashtag.
Be careful out there!
Full disclosure: long RIO puts, long TLRY put spread, long BABA call spread
*Charting notes: FreeStockCharts.com stock prices are not adjusted for dividends. TradingView.com charts for currencies use Tokyo time as the start of the forex trading day. FreeStockCharts.com currency charts are based on Eastern U.S. time to define the trading day.
What do you think about TAP trading pattern
What do you think of Tap and cwh?
CWH finally made the hurdle! I will have it on my buy list next week, but IF I buy it will be on a tight stop. Thor Industries had a terrible earnings report. I am frankly surprised that CWH did not sell off in sympathy. WGO didn’t budge either.
TAP looks like it is consolidating. Like CWH, I wouldn’t touch it from a technical perspective until it could trade above its 20/50 DMAs. However, it has had three false breakouts during the consolidation. So expectations need to be low here until a true breakout above the 200DMA.
Great and thanks!