
AT40 = 48.0% of stocks are trading above their respective 40-day moving averages (DMAs)
AT200 = 53.1% of stocks are trading above their respective 200DMAs
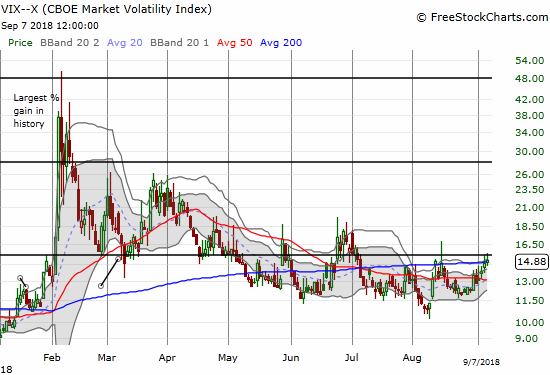
VIX = 14.9
Short-term Trading Call: cautiously bullish
Commentary
Almost a month ago, the stock market was in a similar technical position to the one it is in now.
At the time, I talked about a shaky market that had become over-stretched to the downside. AT40 (T2108), the percentage of stocks trading above their respective 40-day moving averages (DMAs), closed at 47.0%, its lowest close since early May. At the end of last week, AT40 closed at 48.0%. This time, AT40 has declined 5 out of the last 6 days. AT200 (T2107), the percentage of stocks trading above their respective 200DMAs, closed the week at 53.1% almost exactly the same as its 53.0% close on August 15th. At these levels, my favorite technical indicators are over-extended to the downside relative to behavior since May.
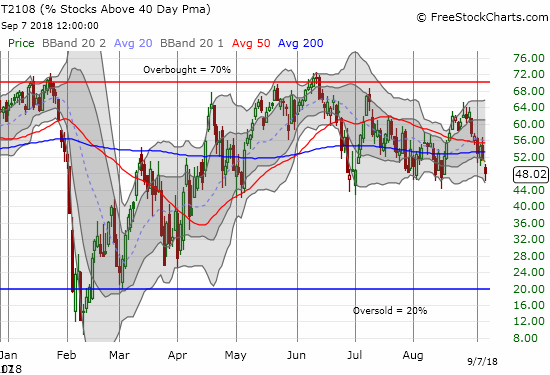
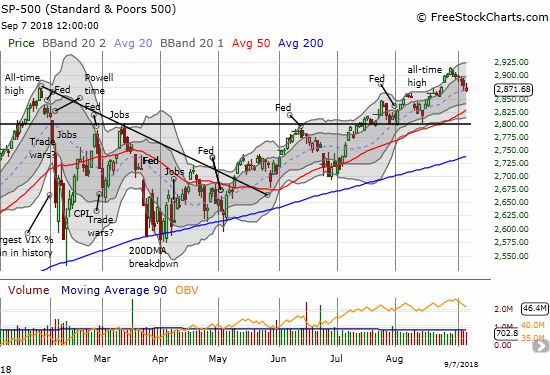
Whether the major indices are ready to bounce as a result of AT40 and AT200 hitting important support levels is up for interpretation. Last month, my call for a rebound was made easy by the S&P 500 (SPY) bouncing neatly off the 2800 support level. On Thursday, the S&P 500 bounced neatly off its uptrending 20DMA, but proceeded to FADE back to its 20DMA support on Friday. The index is thus locked in a neat and tidy mini-downtrend from its all-time high. I see no natural point of bounceback from Friday’s close.
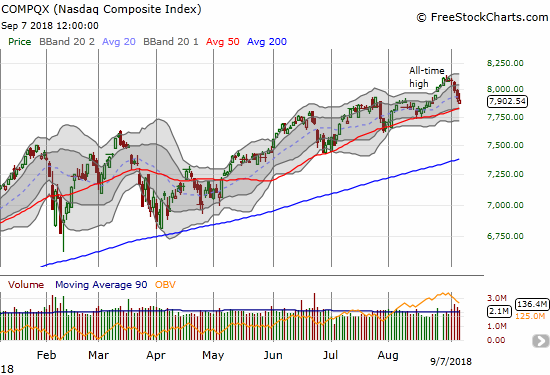
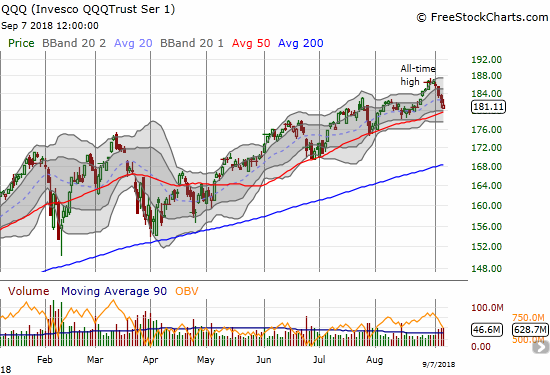
The NASDAQ and the Invesco QQQ Trust (QQQ) are already below their respective 20DMAs and are approaching 50DMA support – bad signs for the prospects of the S&P 500 holding its 20DMA support line.
The volatility index, the VIX, has an upward bias again. However, the inability to press through the 15.35 pivot for two days straight makes the VIX look a little less ominous.
The Australian dollar (FXA) was a big disappointment last week. I was fortunate to close out my long AUD/JPY at a small profit on the last part of its bounce. I soon decided to get right back into the fray with the bullish monetary policy announcement from the Reserve Bank of Australia (RBA) still weighing favorably on my mind.
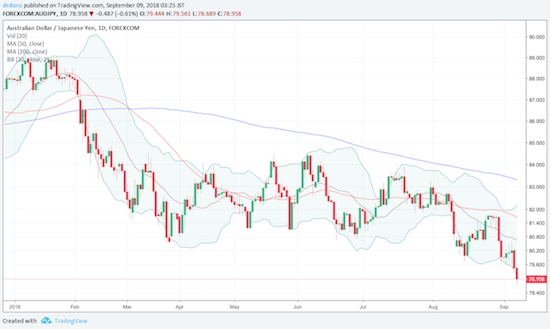
Source: Trading View
Taking all these signals together I switched the short-term trading call from neutral to cautiously bullish. I will be quite surprised if Friday turns out to be the bottom of a short-term dip, but I also did not want to wait until Monday to make a bullish play. I accumulated two tranches of SPY call options on Friday. I will spend the coming weak buying weakness more and more aggressively. In the background, I have a renewed hedge in call options on ProShares Ultra VIX Short-Term Futures (UVXY), my on-going put options in Caterpillar, and I added put options on Boeing (BA) and Whirlpool (WHR).
CHART REVIEWS
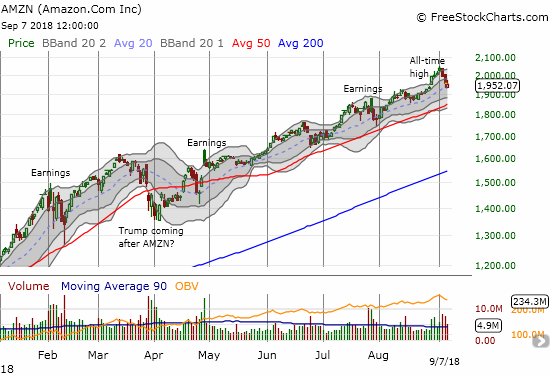
Amazon.com (AMZN)
AMZN’s trip to the $1 trillion club was quite brief: the call for a pullback was even more timely than I expected. The stock fell all the way back to $952B of market cap at Friday’s close. I made a play for a bounce with a one week calendar spread with the short side expiring last Friday. On further weakness, I will likely cap the play by selling an out-of-the-money call option (thus leaving the door open for a strong close of the week).
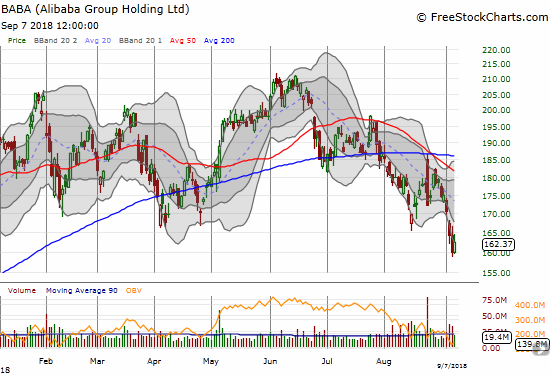
Alibaba Group Holding Limited (BABA)
China-related stocks have mightily struggled since a June swoon. BABA fell from an all-time high that looked like a breakout from an extended trading range. So, BABA looked like a giant amid weakness. Last week, BABA finally broke through the lower bound of its trading range. I am not sure how the news of Chairman Jack Ma’s retirement will impact the stock, but the timing seems unfortunate from a technical perspective. I was itching to buy BABA ahead of November’s “Single’s Day” in China. Now I will wait for BABA either to get over-extended to the downside and/or recover its previous support level.
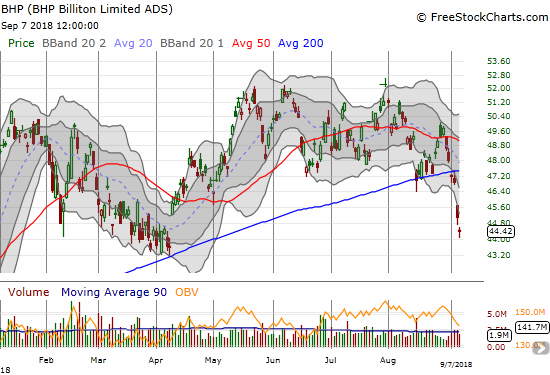
BHP Billiton Limited (BHP)
BHP fell almost 10% last week. I sold my put options at least two days too early!
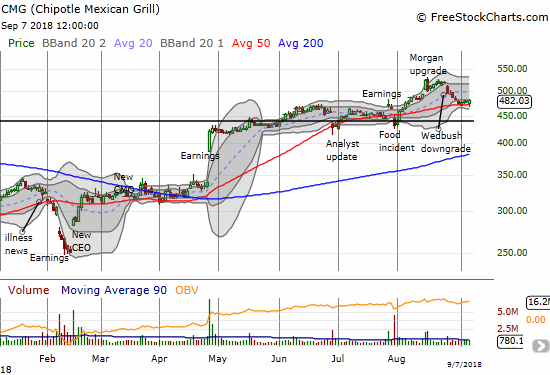
Chipotle Mexican Grill (CMG)
CMG is making a convincing bid to hold support at its 50DMA. I bought a call option on an intraday dip on Friday. I decided to take profits into the close despite my new bullishness on the market. I will be looking for the next entry point.
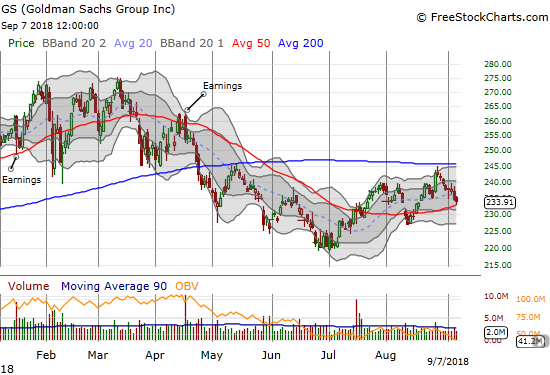
Goldman Sachs (GS)
Last month’s 50DMA breakdown looked like a resumption of weakness for GS. Instead, the stock quickly bounced back. After a convincing rejection from 200DMA resistance, GS is right back at its 50DMA support. If GS bounces from here, I will assume the stock is finally bottoming with higher lows and higher highs.
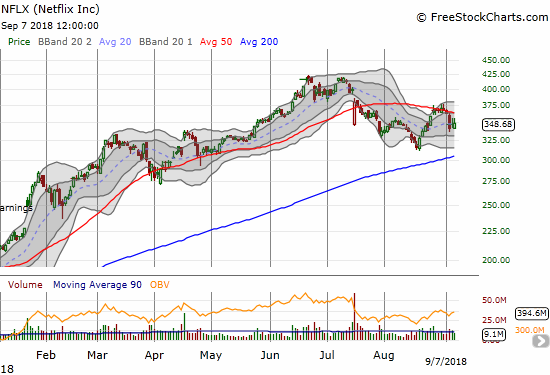
Netflix (NFLX)
I may have been premature in thinking NFLX printed a bottom with its late August sprint higher. I bought a calendar call spread with the stock trying to break free of 50DMA resistance. NFLX instead decided to plunge off its 50DMA in a move that makes this moving average look like convincing resistance.
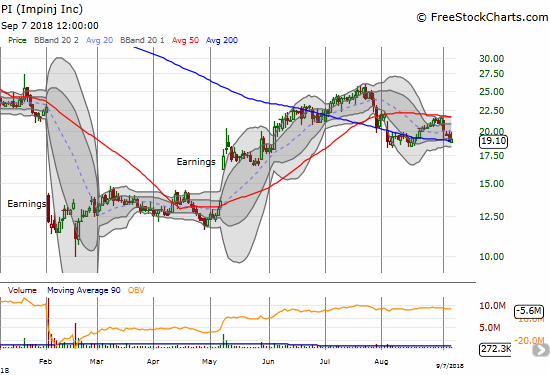
Impinj (PI)
I kept watching PI for a new entry point, but the search is on hold now. The stock is stuck in “no-man’s land” with the pending resolution of financial compliance issues.
The stock is trying to hold 200DMA support soon after a convincing rejection at 50DMA resistance. The stock gapped down below its 200DMA on August 3rd after issuing upside earnings guidance. The stock soon bounced despite PI announcing a delay in filing its required 10Q. I will now stay on the sidelines until at least the time PI gets back into compliance.
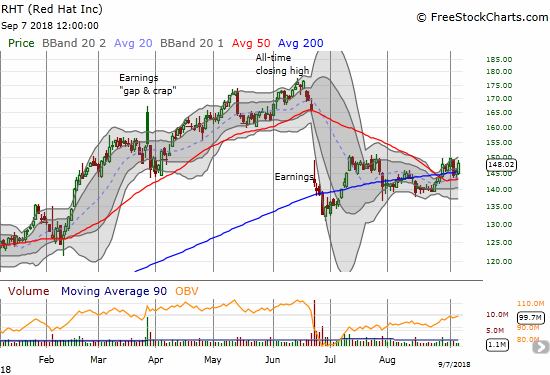
Red Hat (RHT)
I keep checking on RHT from the “corner of my eye.” RHT’s implosion in June looked like it could signal the end of the impressive upward momentum in so many software stocks. That topping impact was short-lived, and RHT itself bottomed in another week. Now the stock looks like it is conveniently consolidating right as its 50 and 200DMAs converge in a support formation. I am a buyer on a new post-earnings high.
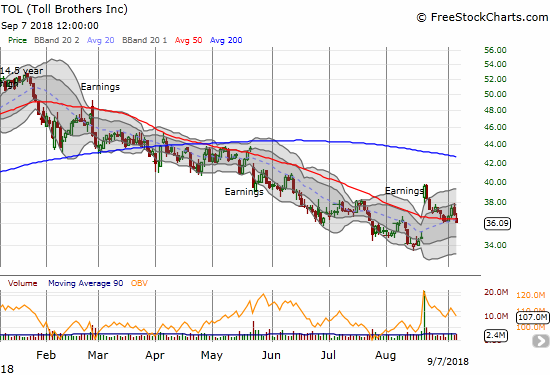
Toll Brothers (TOL)
TOL is still the latest poster child of investor skepticism on home builders. The stock closed Friday at a new post-earnings low and looks ready to finish reversing its surprising post-earnings gap up last month.
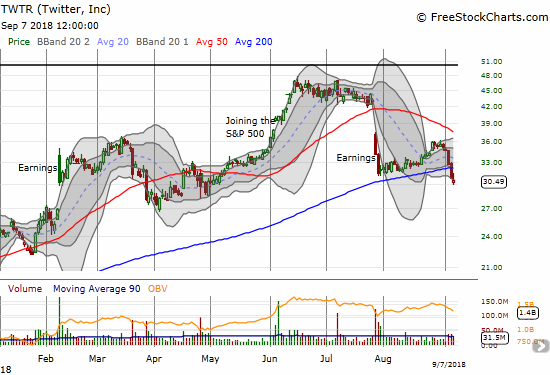
Twitter (TWTR)
While CEO Jack Dorsey stood up well to the pressure of Congressional testimony, his stock did not. TWTR closed the week with a bearish 200DMA breakdown. I have already decided to stick by TWTR, but I am in no rush to accumulate a larger position under these circumstances. I am fine waiting for a bigger discount from the market…assuming one is coming.
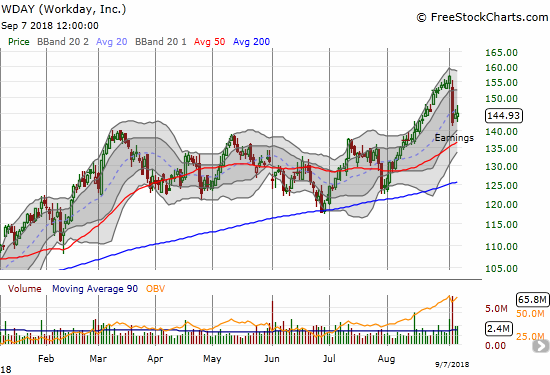
Workday (WDAY)
WDAY suffered a big post-earnings disappointment. Like RHT before it, the loss looks like a momentum-stopper for the sector right now. Indeed, many SaaS (Software As A Service) stocks sold off in WDAY’s wake. I am keeping a closer eye on WDAY for further clues on market sentiment.
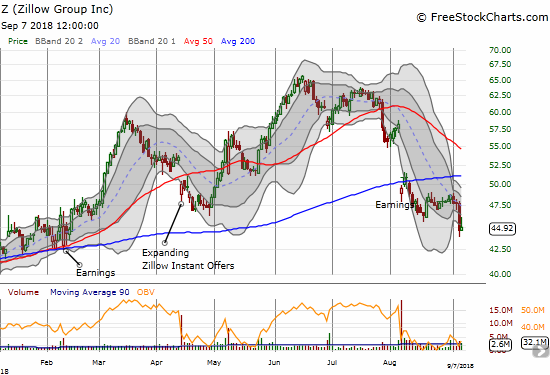
Zillow Group (Z)
Z suddenly dropped to a 7-month low last week. With no apparent news to explain the renewed weakness, I decided to hold onto my puts (which are left over from my RDFN long vs short Zillow trade) for a little while longer in case this sudden renewal of weakness is indicative of more to come.
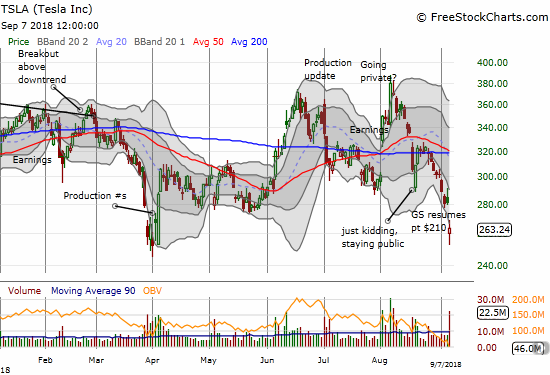
Tesla (TSLA)
The “$420 or bust” trade in TSLA looks like it is heading toward bust.
First there is the now well-known and infamous stunt of CEO Elon Musk smoking weed (and drinking alcohol) on a comedian’s podcast.
On Friday, TSLA lost 6.3% in the wake of the resignation of Chief Accounting Officer Dave Morton after just a month on the job. Tesla’s 2025 bonds also dropped to an all-time low (a 15% discount). The slide in the bonds is more troubling than the stock since TSLA will inevitably need to raise more funds to stay operational.
All this churn and circus-like behavior made Musk’s Friday appeal to employees to remain calm ring hollow:
“We are about to have the most amazing quarter in our history, building and delivering more than twice as many cars as we did last quarter. For a while, there will be a lot of fuss and noise in the media. Just ignore them. Results are what matter and we are creating the most mind-blowing growth in the history of the automotive industry.”
The “fuss and noise” in the media would easily go away if Musk himself stopped putting himself in the wrong spotlights.
I drew a line in the sand at $280 support. I did not sell my shares on Friday because I hate selling into a panic. I took profits on my 290/280 put spread expiring September 21st and quickly established a calendar put spread at the $245 strike. Needless to say, I am quite ready to dump my shares into the next rally. I simply do not want to hang around to see how this stock behaves when TSLA reaches into the till for more money. I think the market’s grace for this situation could be running thin.
— – —
FOLLOW Dr. Duru’s commentary on financial markets via email, StockTwits, Twitter, and even Instagram!
“Above the 40” uses the percentage of stocks trading above their respective 40-day moving averages (DMAs) to assess the technical health of the stock market and to identify extremes in market sentiment that are likely to reverse. Abbreviated as AT40, Above the 40 is an alternative label for “T2108” which was created by Worden. Learn more about T2108 on my T2108 Resource Page. AT200, or T2107, measures the percentage of stocks trading above their respective 200DMAs.
Active AT40 (T2108) periods: Day #139 over 20%, Day #108 over 30%, Day #103 over 40% (overperiod), Day #1 under 50% (underperiod ending 15 days above 50%), Day #6 under 60%, Day #59 under 70%
Daily AT40 (T2108)
")
Black line: AT40 (T2108) (% measured on the right)
Red line: Overbought threshold (70%); Blue line: Oversold threshold (20%)
Weekly AT40 (T2108)

*All charts created using freestockcharts.com unless otherwise stated
The charts above are my LATEST updates independent of the date of this given AT40 post. For my latest AT40 post click here.
Related links:
The AT40 (T2108) Resource Page
You can follow real-time T2108 commentary on twitter using the #T2108 or #AT40 hashtags. T2108-related trades and other trades are occasionally posted on twitter using the #120trade hashtag.
Be careful out there!
Full disclosure: long SPY puts, long AUD/JPY, long FB puts, long TSLA shares, call spread, and calendar put spread; long NFLX calls, long TWTR shares and calls, long AMZN call, long Z puts, long SPY calls, long UVXY calls
*Charting notes: FreeStockCharts.com stock prices are not adjusted for dividends. TradingView.com charts for currencies use Tokyo time as the start of the forex trading day. FreeStockCharts.com currency charts are based on Eastern U.S. time to define the trading day.