
AT40 = 48.6% of stocks are trading above their respective 40-day moving averages (DMAs)
AT200 = 50.7% of stocks are trading above their respective 200DMAs
VIX = 16.1
Short-term Trading Call: bearish
Commentary
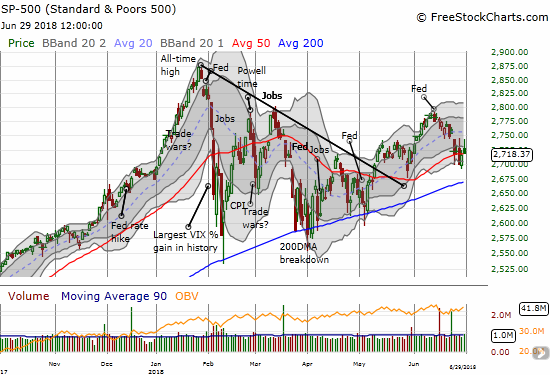
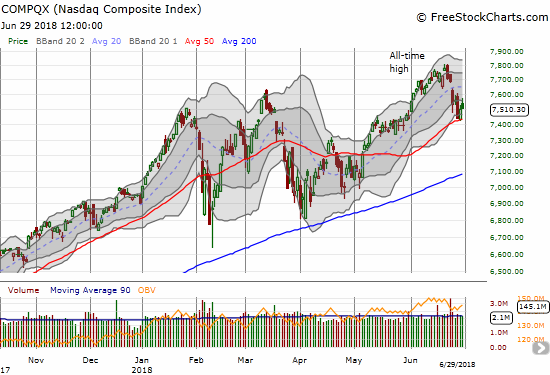
The market’s gains the last two days validated my expectation for a relief bounce. I used this bounce to make more bearish adjustments to my positioning: unloading some longs and reloading on some bearish trades. My positioning included covering my latest short on iPath S&P 500 VIX ST Futures ETN (VXX) and buying back into ProShares Ultra VIX Short-Term Futures (UVXY) call options. For the first time since the February swoon, the major indices ended a week decidedly down. The new superstar iShares Russell 2000 ETF (IWM) ended a 4-week winning streak. I did not find any reason to expect a major bounce ahead. Indeed, I remain firmly (short-term) bearish even though both the S&P 500 (SPY) and the NASDAQ tested support at their respective 50-day moving averages (DMAs) as I had anticipated when first going bearish.
AT40 (T2108), the percentage of stocks trading above their respective 40DMAs, is the most telling. While major indices were making spirited bounces from support on Thursday, my favorite technical indicator did all it could just to minimize a loss on the day. It created a bearish divergence. On Friday, AT40 was up with the market and traded as high as 53.4% before closing at 48.6%, its low of the day. The fade looked ominous and reinforced the bearish trading action going into the close across the stock market.
The volatility index, the VIX, started the week gapping up into and then past the 15.35 pivot. The fear gauge spent the rest of the week bouncing away from this pivot. While I guessed correctly that the market could not sustain Monday’s large percentage gain, the VIX now looks poised to make another run higher. If the VIX does make another sprint, I will stick to my current strategy of taking profits quickly on volatility-related positions (in this case selling my latest tranche of UVXY call options).
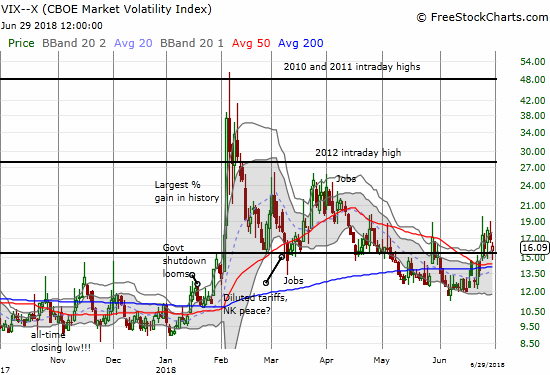
CHART REVIEWS
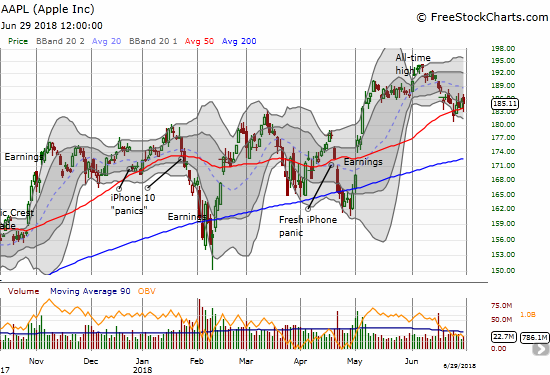
Apple (AAPL)
Despite my bearishness, I am sticking to the AAPL weekly call buying strategy; I consistently find it best not to overthink this strategy. The last three weeks have been busts although last week I managed to close out my position at even after doubling down on Monday’s gap down. AAPL managed to close the week above its lower-BB channel, so the stock maintains a flicker of hope for more upward momentum before gravity takes over again. In fact, any ability of AAPL to move higher from here could provide an early signal that my bearish thesis for the overall market is coming to an end.
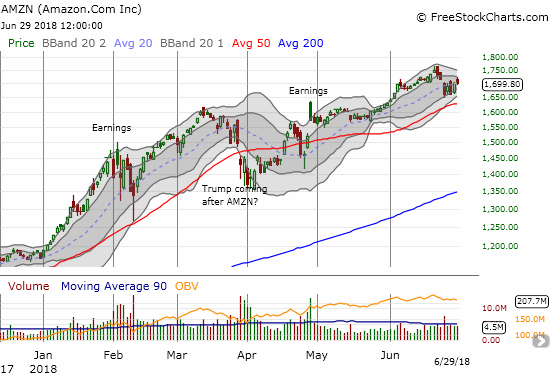
Amazon.com (AMZN)
I am watching AMZN for a potential Bollinger Band (BB) squeeze. AMZN showed off all week by trading well above 50DMA support.
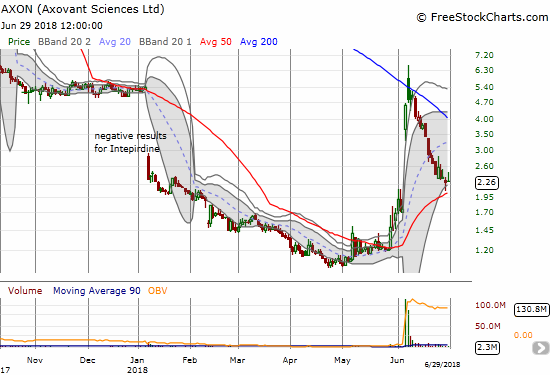
Axovant Sciences (AXON)
Buyers finally showed up this week in AXON. I decided to restart a position into Friday’s intraday fade. Thursday looked like a successful test of 50DMA support, but Friday’s fade wiped away confirmation of the bottom. I am committed to buying up two more tranches if weakness continues from here.
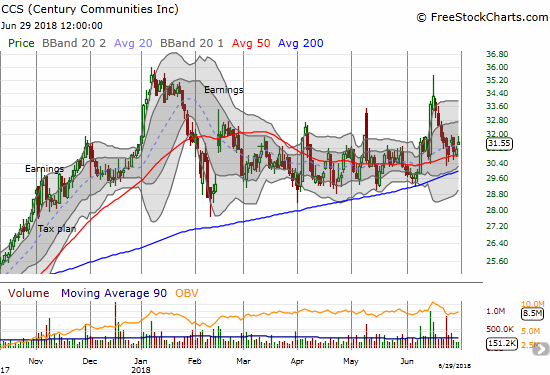
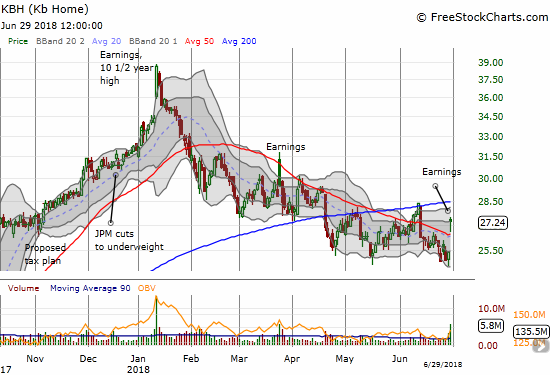
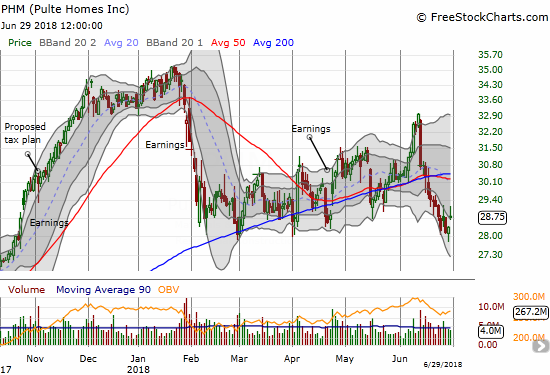
Home builders: Century Communities (CCS), KB Home (KBH), Pulte Home (PHM), and Toll Brothers (TOL)
Whether I am short-term bearish or bullish, I maintain a soft spot for home builders. This week’s excuse for home builders came in the forms of CCS holding 50DMA support, a successful pre-earnings trade on Lennar (LEN), and KB Home (KBH) actually holding onto its post-earnings gain and closing near its intraday high. Earlier in the week I bought shares of CCS. On Friday, I doubled down on PHM call options. I am pretty sure I am done with home builder trades until the seasonally strong period starts again in November…unless some very special setup appears for a short-term flip. My trades here definitely fly in the face of my short-term bearish trading call, but I am making case-by-case exceptions.
CNBC’s Fast Money hmoved on from promoting a trade on LEN (three times and counting!) to an “it can’t get any worse than this” trade on hapless Toll Brothers (TOL)…
Carter Worth says the chart of $TOL is so bad, it's actually good. That's got @Michael_Khouw betting on a big comeback for the homebuilder. pic.twitter.com/Rf5ppTEN9T
— Options Action (@OptionsAction) June 29, 2018
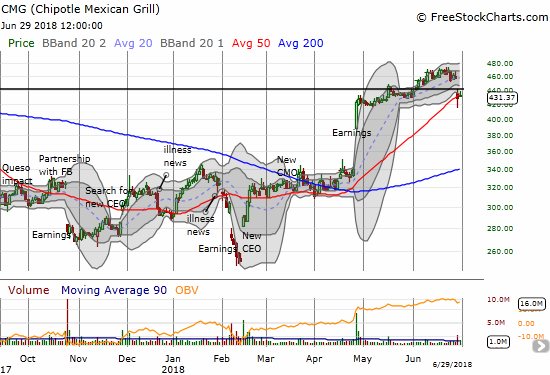
Chipotle Mexican Grill (CMG)
CMG provided investors with a company update, and investors did not like what they heard. The subsequent gap down to 50DMA support ended what was a steady, albeit grinding, climb higher from the April post-earnings rocketship and brought to an end the original bullish trading case. I took a flyer ahead of this event on a calendar call spread. The short side of course expired worthless. The long side is likely doomed to do no better.
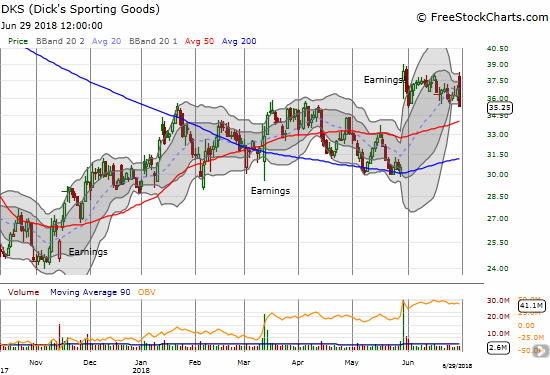
Dick’s Sporting Goods (DKS)
DKS is struggling to gain fresh post-earnings momentum. The chop is surprisingly wide. I am still interested in buying a test of 50 and/or 200DMA support, but I would be wary of an upside breakout.
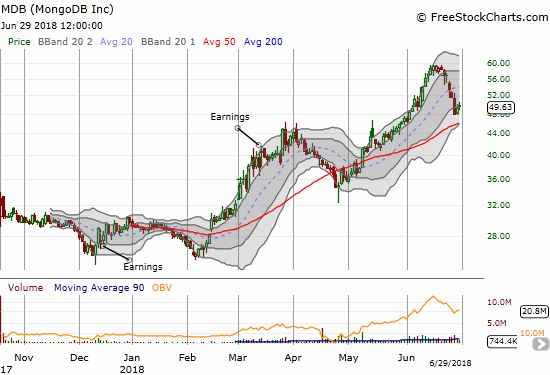
MongoDB (MDB)
June saw a number of recent IPOs, mostly tech and often cloud-based, go near parabolic. In many cases the momentum carried over from May. MDB is one recent IPO that I am eyeing as it finally started pulling back again. The recent drop is steep enough to suggest a test of 50DMA support is coming sooner than later.
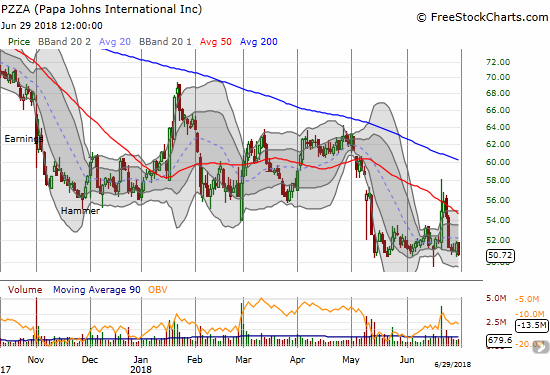
Papa Johns International (PZZA)
Who knew pizza was such a volatile business? (Trick question – it’s not). PZZA has been on a wild ride since hitting its last all-time high in late 2016. I thought the stock finally bottomed after a hammer-like pattern on June 11th that was quickly confirmed with follow-up buying. On June 20th the stock surged as much as 11.9% on rumors of going private (per briefing.com). The rush to buy must have exhausted all remaining buyers because in just one more week the stock closed just above its 2 1/2 year low. These kinds of situations pique my interest: the rapid buying and selling suggest to me that even bigger moves are on their way. I am looking to put in a hedged play of calls and puts or long shares and puts. I do not want to short the stock because its float is already 25.9% sold short.
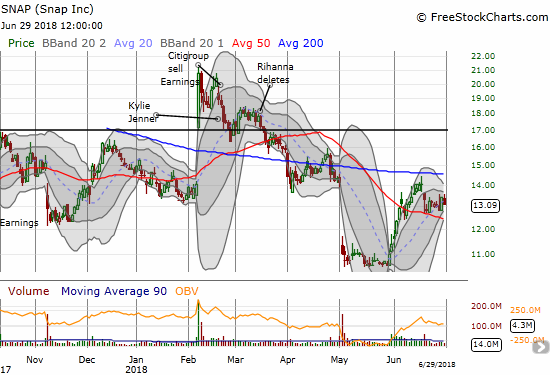
Snap (SNAP)
I have not posted on SNAP in a while. I was VERY wrong back in February and March to scoff at the potential of lasting impact on the shares or the company from the bashing delivered by celebrities like Rihanna and Kylie Jenner. The bad news got worse after SNAP gapped down hard to a new all-time low in May. Yet, at those levels I found the stock too low to resist; I ramped up my shares. After June’s rally closed the gap, I decided not to sell and instead sell calls. These calls are relatively cheap, so I do not expect the stock to get far for a while; I am content to just sit here and sell calls as many times as the market will allow. I expect the latest bottom of $10.50 to hold barring some incrementally awful news about the company. This ride from major bear to opportunistic buyer has been quite a wild one!
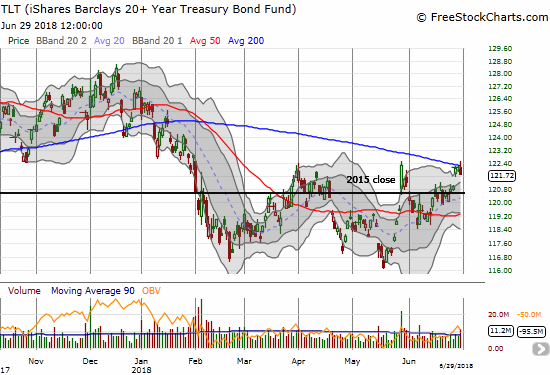
iShares 20+ Year Treasury Bond ETF (TLT)
The higher U.S. yields story faded hard in June as the market got increasingly worried about the impact of global trade tensions between the U.S. and everyone else. TLT is back to the high from May. Still, the 200DMA held as stiff resistance. While I did not add to my fistful of TLT puts, I think this is a perfect place to buy a fresh batch as a “hedge” on a return of market economic optimism. I will make the trade if TLT follows through to the downside this week.
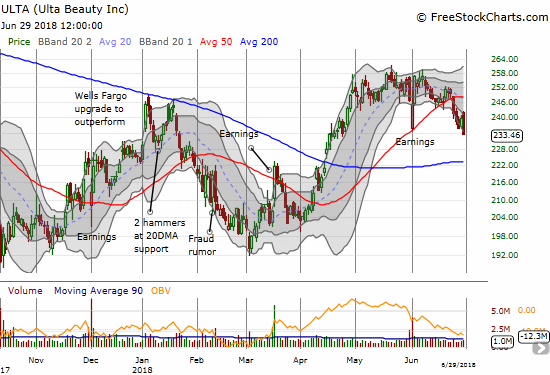
Ulta Beauty (ULTA)
My renewed optimism on ULTA quickly faded in June, and now I am outright bearish again. I closed out a position of puts on Friday, and I will be looking to fade strength. The stock made a new post-earnings closing low and looks set to eventually test 200DMA support.
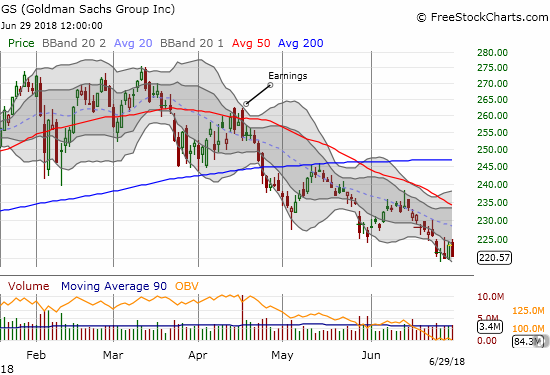
Goldman Sachs (GS)
The financials continue to look “suspicious” and GS leads the way among American financials. The stock faded hard on Friday a 1.3% loss. As soon as I noticed the turn-around I jumped on a fresh set of put options. The Federal Reserve’s release of results from the Comprehensive Capital Analysis and Review (CCAR) had the potential to deliver some much needed headline tailwinds to the financials. The fade tells me financials like GS are going even lower from here sooner than later.
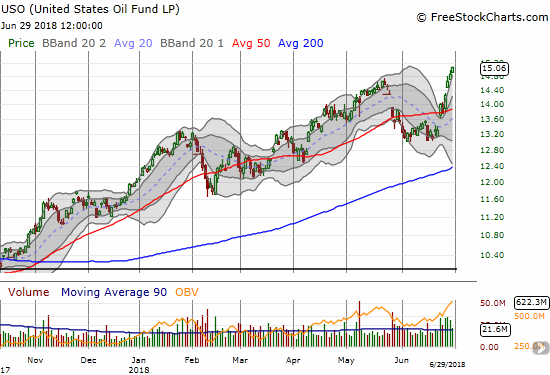
United States Oil (USO)
I will say it again: rising oil prices at this juncture are NOT market or economy positive. Oil prices raced higher all week and left the stock market behind. USO gained 7.4% for the week and logged a near 3-year high. If you hear a pundit suggest that rising prices are still signaling a strong economy ahead, turn them off immediately. Over the weekend, President Trump reached out to Saudi Arabia to pump out more oil for a reason. You gotta love the constant manipulation of this market.
— – —
FOLLOW Dr. Duru’s commentary on financial markets via email, StockTwits, Twitter, and even Instagram!
“Above the 40” uses the percentage of stocks trading above their respective 40-day moving averages (DMAs) to assess the technical health of the stock market and to identify extremes in market sentiment that are likely to reverse. Abbreviated as AT40, Above the 40 is an alternative label for “T2108” which was created by Worden. Learn more about T2108 on my T2108 Resource Page. AT200, or T2107, measures the percentage of stocks trading above their respective 200DMAs.
Active AT40 (T2108) periods: Day #93 over 20%, Day #62 over 30%, Day #57 over 40% (overperiod), Day #3 under 50% (underperiod), Day #5 under 60%, Day #13 under 70%
Daily AT40 (T2108)
")
Black line: AT40 (T2108) (% measured on the right)
Red line: Overbought threshold (70%); Blue line: Oversold threshold (20%)
Weekly AT40 (T2108)

*All charts created using freestockcharts.com unless otherwise stated
The charts above are my LATEST updates independent of the date of this given AT40 post. For my latest AT40 post click here.
Related links:
The AT40 (T2108) Resource Page
You can follow real-time T2108 commentary on twitter using the #T2108 or #AT40 hashtags. T2108-related trades and other trades are occasionally posted on twitter using the #120trade hashtag.
Be careful out there!
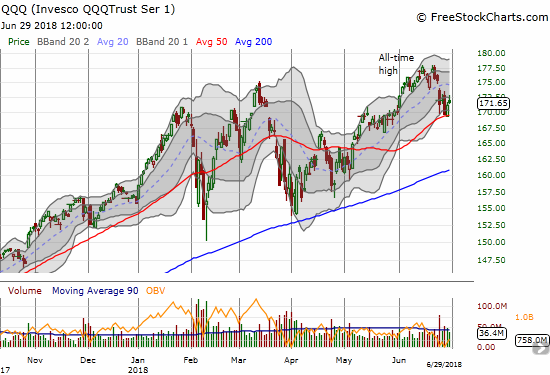
Full disclosure: long AAPL calls, long AXON, long CCS, long CMG call, long SNAP shares and short calls, long TLT calls, long UVXY calls, long GS calendar put spread, long QQQ puts, long SPY puts
*Charting notes: FreeStockCharts.com stock prices are not adjusted for dividends. TradingView.com charts for currencies use Tokyo time as the start of the forex trading day. FreeStockCharts.com currency charts are based on Eastern U.S. time to define the trading day.