
AT40 = 64.0% of stocks are trading above their respective 40-day moving averages (DMAs)
AT200 = 52.5% of stocks are trading above their respective 200DMAs
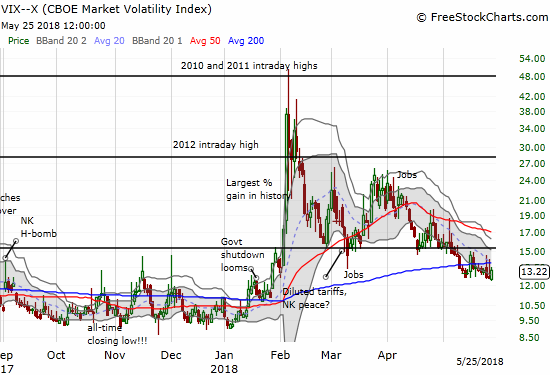
VIX = 13.2
Short-term Trading Call: neutral
Commentary
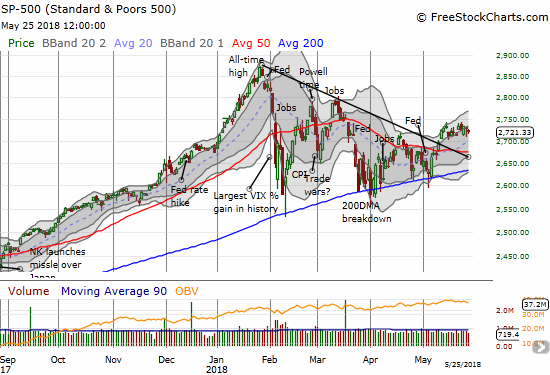
The churn continues on the S&P 500 (SPY) while AT40 (T2108) loiters around just under its overbought threshold of 70%. The lethargic trading action is still keeping me from flipping the short-term trading call to bearish as I normally would do when AT40 gets rejected from the overbought threshold. I am content to wait things out. If/when AT40 breaks the last low at 59.7%, I will flip bearish. My favorite technical indicator closed the week at 64.0%.
The volatility index, the VIX, was itself volatile for the week. The jitters up and down gave me the opportunity to trade profitably in and out of ProShares Ultra VIX Short-Term Futures (UVXY) call options twice. I loaded up for a third time ahead of Thursday’s close. The jig may be coming to an end though as on Friday the VIX gained 5.5% and UVXY only gained 1.9%. I held the calls because the expiration for this round is two Fridays out.
The amount of time AT40 (T2108) has spent udner the overbought threshold is starting to get long in the tooth. At 78 days below 70%, the chart below shows that the performance of the S&P 500 by the time it gets into overbought territory starts declining. The S&P 500 is currently down 4.1% since AT40 dropped out of overbought conditions on January 24, 2018. This performance is well below the projection of S&P 500 performance for an underperiod that ends at 78 days. In other words, IF the S&P 500 can muster enough strength to drive into overbought territory, the accompanying rally would likely be broadbased and very strong. That if is very strong given the market’s current performance, but it is one more reason to avoid flipping my short-term trading to bearish.
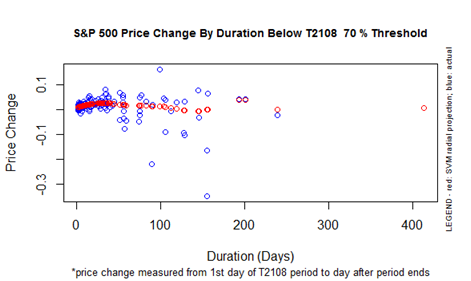
CHART REVIEWS
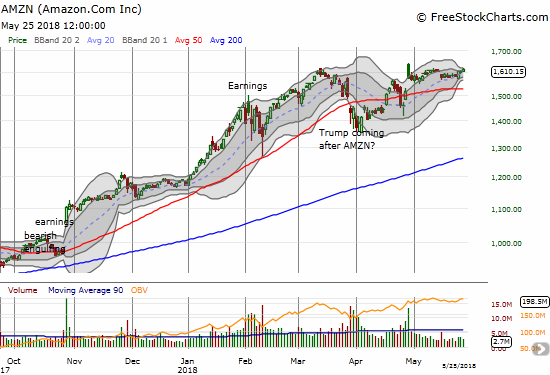
Amazon.com (AMZN)
My last trade on AMZN was a bust. With the stock looking poised for an upside resolution to a Bollinger Band (BB) squeeze, I dipped my toe in again. I dove in with another calendar call spread with expirations on June 8th and 15th.
Best Buy (BBY)
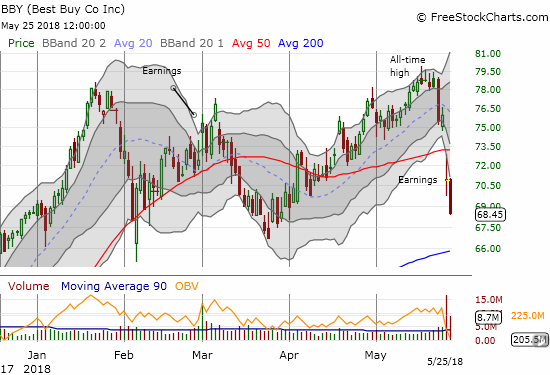
Earlier in the week I noted the increasing trading volume on down days for BBY. The selling culminated with a big dip two days ahead of earnings. This episode turned out to be one of those times where the trading action going into earnings telegraphed exactly what was coming. BBY has likely topped out for now and looks headed for an important test of support at its uptrending 200DMA.
United States Oil (USO)
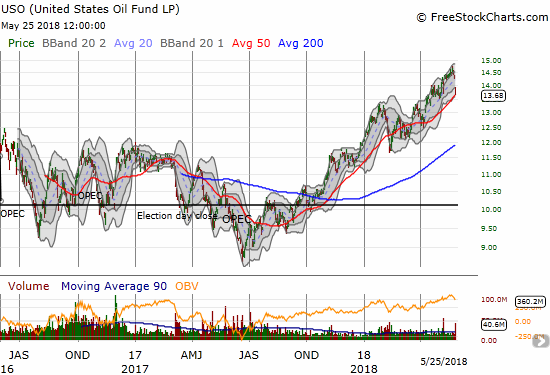
Oil prices finally took a plunge. On Friday, rumors rattled markets that the Saudis and Russians would finally relieve some of their production cuts in response to production issues in Venezuela and the likely drop in oil from Iran. To me, this is yet one more episode that demonstrates how the oil market is fraught with manipulation. At the time of writing, it is still not clear whether Saudi Arabia and Russia will actually increase production. Regardless, oil prices as represented by USO remain in a strong uptrend from the 2017 lows.
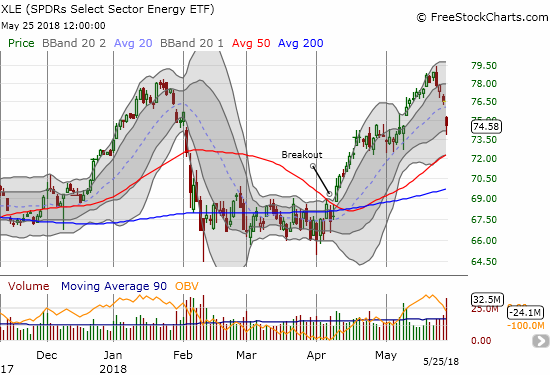
Energy Select Sector SPDR ETF (XLE)
XLE weakened ahead of the plunge in oil prices. The top came in the form of a bearish engulfing pattern on Tuesday. If I had been paying attention, I would have loaded up on puts after seeing that. At one point on Friday, XLE traded exactly where it stood at the end of April.
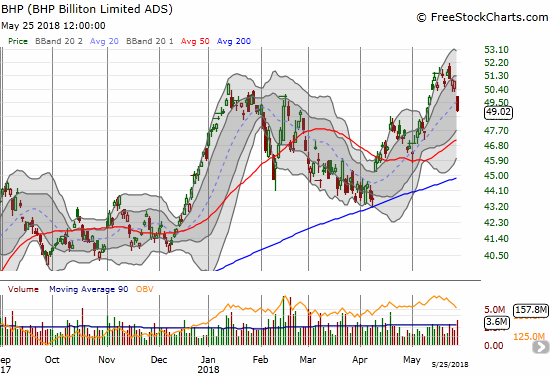
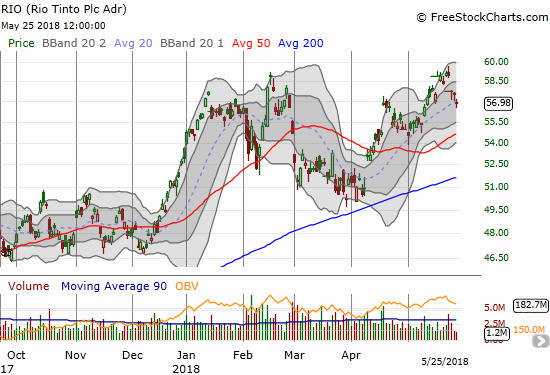
BHP Billiton (BHP) and Rio Tinto (RIO)
The drop in oil had a direct impact on BHP. Ironically, the catalyst I was looking for my latest iron ore pairs trade featuring BHP puts and Rio Tinto (RIO) longs was a potential catch-up in the price of iron ore. Iron ore is still fumbling along, so this time around my profits on BHP puts were exactly offset with losses on RIO calls. I find it ironic that my first time matching BHP puts with RIO calls resulted in the same kind of pullback that generated profits two out of three times. I decided to add to the now very cheap RIO calls instead of closing out the trade at even. If oil quickly rebounds, I will immediately lock in whatever profits remain on my BHP puts and look for the next entry.
Chipotle Mexican Grill (CMG)
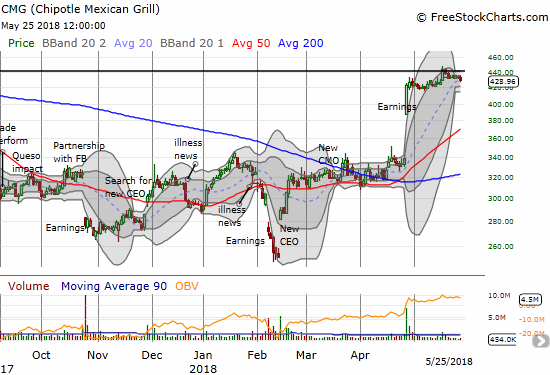
I was hoping that a drop in oil prices would provide a fresh catalyst to stocks like CMG which should benefit from a decline in gas prices. Instead, CMG dropped 1.0% on the day. The stock was essentially flat as a pancake for the week and delivered another loss on my attempt to anticipate an upside resolution to the current BB squeeze. I must be a glutton for punishment as I reloaded yet again.
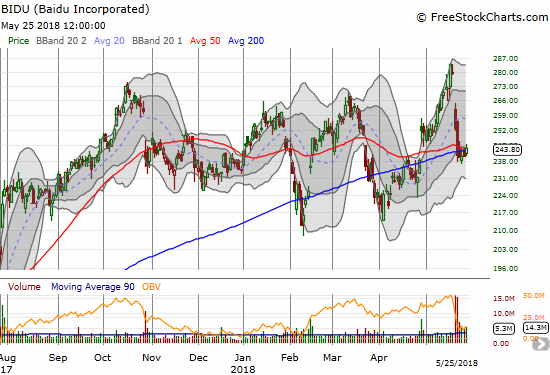
Baidu (BIDU)
I often watch BIDU but almost never trade it. The drama over the departure of the company’s COO finally pushed me to pull the trigger. I was far too early in buying call options last Friday. Over the weekend traders and investors decided they had not sold enough and on Monday BIDU plunged again. The stock has started to stabilize right at its converged 50 and 200DMAs, so I pulled the trigger one more time. This time I bought a small amount of shares alongside a call option. I plan to hold these shares in anticipation of, at minimum, a return to the top of the current widening trading range. I will add to the shares if BIDU drops all the way back to the bottom of its trading range.
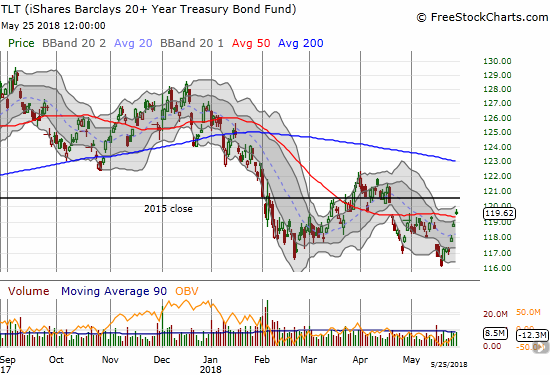
iShares 20+ Year Treasury Bond ETF (TLT)
What a difference 10 days make. On May 15th, a return to 3%+ on the 10-year U.S. Treasury caused a flurry of negative trading activity. Now interest rates are in sharp retreat with Friday’s action pushing TLT above its 50DMA. TLT gained 2.1% for the week and notched a 1 month high. I find it instructive that the S&P 500 barely benefited from this sharp decline in rates. As planned, I took this opportunity to reload on TLT puts.
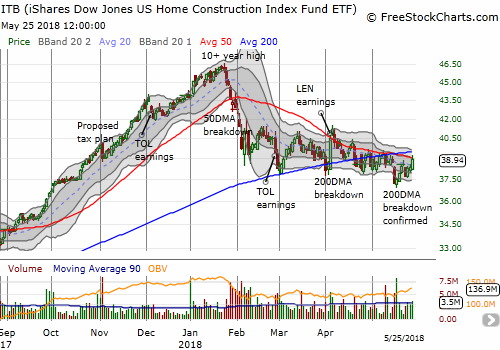
iShares US Home Construction ETF (ITB)
While the S&P 500 barely benefited from the back-up in rates, home builders lapped it up. ITB gained a nice 1.5% and even challenged its 50DMA resistance. Since I think rates will eventually continue higher, I am unmoved by the price action. I will continue to wait for the catalysts I discussed earlier.
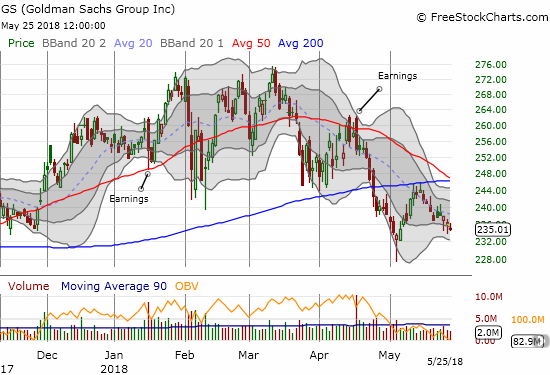
Goldman Sachs (GS)
Financials pulled back on the drop in interest rates. Yet the persistent weakness in GS continues to mystify me. GS is now barely off its low for the year which was set earlier this month. Something looks broken here. I am warily keeping an eye on these developments.
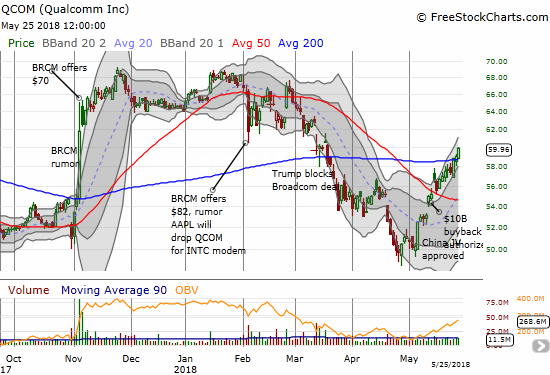
Qualcomm (QCOM)
QCOM is in recovery mode. This past week, the stock broke out above its 200DMA and is back where it traded when President Trump’s administration blocked Broadcom’s attempt to buy the company. I consider this move to be a very bullish confirmation of the positive implications of the extra $10B QCOM might spend buying its stock back from the public.
Other trades: Autozone (AZO) already broke through my first upside target of 50DMA resistance. I decided to hold onto the call spread for now and try to wait out more buying follow through.
— – —
FOLLOW Dr. Duru’s commentary on financial markets via email, StockTwits, Twitter, and even Instagram!
“Above the 40” uses the percentage of stocks trading above their respective 40-day moving averages (DMAs) to assess the technical health of the stock market and to identify extremes in market sentiment that are likely to reverse. Abbreviated as AT40, Above the 40 is an alternative label for “T2108” which was created by Worden. Learn more about T2108 on my T2108 Resource Page. AT200, or T2107, measures the percentage of stocks trading above their respective 200DMAs.
Active AT40 (T2108) periods: Day #69 over 20%, Day #38 over 30%, Day #33 over 40%, Day #15 over 50%, Day #7 over 60% (overperiod), Day #83 under 70%
Daily AT40 (T2108)
")
Black line: AT40 (T2108) (% measured on the right)
Red line: Overbought threshold (70%); Blue line: Oversold threshold (20%)
Weekly AT40 (T2108)

*All charts created using freestockcharts.com unless otherwise stated
The charts above are my LATEST updates independent of the date of this given AT40 post. For my latest AT40 post click here.
Related links:
The AT40 (T2108) Resource Page
You can follow real-time T2108 commentary on twitter using the #T2108 or #AT40 hashtags. T2108-related trades and other trades are occasionally posted on twitter using the #120trade hashtag.
Be careful out there!
Full disclosure: long AZO call spread, long QCOM calls and shares, long BHP puts, long RIO calls, long CMG call, long BIDU shares and call, long TLT puts
*Charting notes: FreeStockCharts.com stock prices are not adjusted for dividends. TradingView.com charts for currencies use Tokyo time as the start of the forex trading day. FreeStockCharts.com currency charts are based on Eastern U.S. time to define the trading day.