
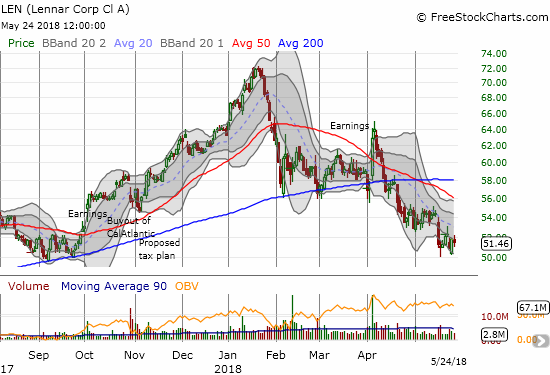
When Lennar (LEN) reported earnings on April 4th the market’s reaction looked just like the refresher the market needed to get housing stocks going again. LEN soared 10.0% on the day. The deal looked sealed when LEN appeared to confirm the surge with another up day. LEN has suffered severe selling pressure ever since.
Source: FreeStockCharts.com
Sellers took over with a vengeance and LEN has never been the same. Last year’s big breakout is completely gone. Down days have generated higher volume than up days. Selling days have delivered greater magnitudes than buying days. It took 6 days to reverse the post-earnings rally and break 200DMA support. After another 5 trading days, LEN confirmed its 200DMA as resistance. LEN is now DOWN 9.7% post-earnings and down 18.6% year-to-date.
Given LEN’s strong earnings results and near rock-bottom valuation – 13.8 trailing P/E, 7.7 forward P/E, 1.3 price/sales, and 1.3 price/book – it is clear investors and traders are firmly locked back into a fear that the housing market will collapse at any moment. I think this fear is way overblown, yet, as I have stated before, I am forced to respect the poor technicals. I have shed all but one of my homebuilders.
With this ugly backdrop, I took some interest in Steve Grasso’s bullish case for Lennar on CNBC’s Fast Money (May 24, 2018). The case focused on four bullish points that I wanted to believe, but each one has caveats Grasso failed to cover in the short time he had to make the case.
Point 1: Interest rates are stabilizing – this assumes that the recent pullback in rates has carved out a top. There is no reason to believe that yet. Indeed, I am looking to reload on put options on iShares 20+ Year Treasury Bond ETF (TLT).
Point 2: Investors were “too long” LEN when the company merged with CalAtlantic. Their subsequent selling of the stock has removed a major overhang on LEN and the home builder ETFs. I honestly only understand part of the argument. My mild skepticism comes from seeing how LEN dipped a bit at first on the buyout and then soared as a part of its breakout.
Point 3: Lumber prices have topped out – this assumes the recent 10% pullback is permanent instead of a natural cooling period in a secular bullish trend. Strangely, Grasso concluded his argument by claiming the stock declined throughout the drop in lumber prices.
Point 4: LEN has successfully tested a key support level (see the chart above) – this claim is premature given a confirmation of the test requires buyers to prove their strength. For example, a close over a key hurdle might confirm the bottom: $54 which is above the last big down day or $56 which is above the declining 50-day moving average (DMA). Given Grasso’s upside target is around $60, I understand the eagerness to get in here. Presumably he will lower his risk by placing a tight stop below the recent low.
.@grassosteve is looking to hit another home run with a Fast Pitch on $LEN pic.twitter.com/1kqPYL7bsk
— CNBC's Fast Money (@CNBCFastMoney) May 24, 2018
I REALLY want to latch on to Grasso’s bullish thesis, but I see too many untested pivots that even together are not strong enough to overcome all the other reasons I decided to respect the poor technicals in the sector.
I voted no along with 75% of the respondents at the time of writing…
Are you buying @grassosteve's Fast Pitch for $LEN?
— CNBC's Fast Money (@CNBCFastMoney) May 24, 2018
I took some notes from the Seeking Alpha transcript of the earnings conference call. I found a lot to like and little to concern me. My positive interpretation of the results contributed to my reluctance to give up the home builder trader for this cycle.
Market conditions are as strong as ever
- The housing market has been strong and it is continuing to strengthen.
- The combination of short supply and strong demand means that “it will still take some years to get the equilibrium.”
- Entry level demand is very strong (robust): “We have our strongest absorptions there and we are able to increase prices there.”
Margin Results and Guidance
- Operating margins gained 70 basis points year-over-year and exceeded previous guidance.
- Full year gross margins between 21.5% and 22%.
- Full year operating margins between 12.5% and 13.25%.
The Lennar Cash Machine
For the rest of 2018, LEN will generate about $2-$2.5B in cash from operations “…before ancillary businesses, CalAtlantic related costs and debt paydowns.”
Tax reform is a “net positive”
The stimulative effect of tax reform is good for the economy and by extension housing as well. The doubling of the standard deduction helps renters to build the savings needed for a down payment.
Multi-family Mammoth
- “As of February 28, we had a geographically diversified pipeline of 82 communities totaling almost 26,000 apartment homes with a total development cost of just over $9 billion.”
- Assets consist of 29 merchant build communities (over 9000 apartment homes), first multifamily venture of just under 12,000 apartment homes, and a second multifamily venture of about 5000 apartment homes.
The biggest drawback of LEN is its complexity. LEN has a lot of different components. In the latest quarter, LEN released FIVE supplemental schedules on top of the press release to help analysts understand all the moving pieces. So while LEN is a strong builder and very attractively priced, there are several other attractive builders that are simpler to understand and thus easier investments.
Be careful out there!
Full disclosure: no positions