
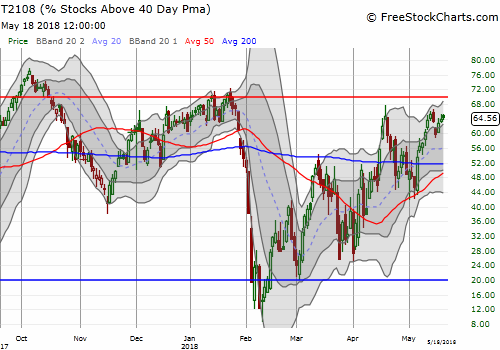
AT40 = 64.6% of stocks are trading above their respective 40-day moving averages (DMAs)
AT200 = 51.5% of stocks are trading above their respective 200DMAs
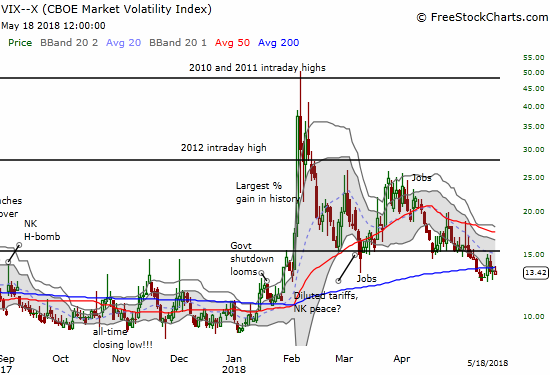
VIX = 13.4
Short-term Trading Call: neutral
Commentary
Looks like there was a good reason to wait on flipping my short-term trading call back to (cautiously) bearish. After pointing out that AT40 (T2108), the percentage of stocks trading above their respective 40-day moving averages (DMAs), completed an ominous fade from the overbought threshold at 70%, my favorite indicator proceeded to drift higher to close the week just under last Friday’s close.
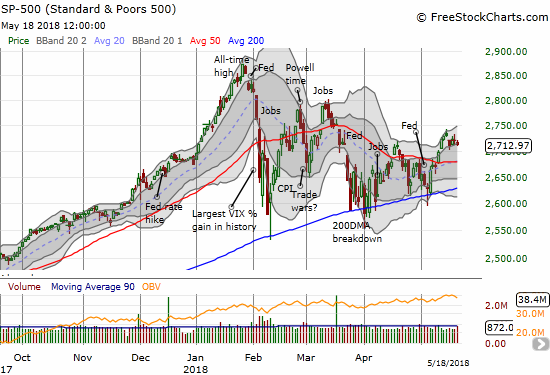
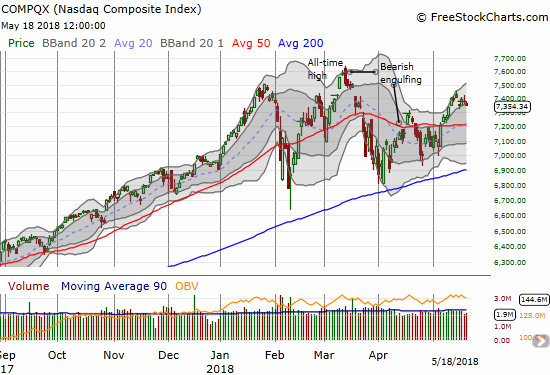
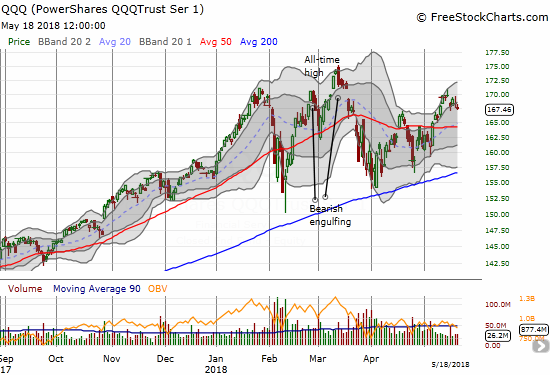
While stocks in aggregate were able to drift higher, the move failed to help the S&P 500 (SPY). The index closed the week barely a point higher than Tuesday’s close. The lackluster trade action makes me think that the notion of an exhausted and reluctant market is a good one. The NASDAQ and the PowerShares QQQ ETF (QQQ) also closed the week flat with Tuesday’s low.
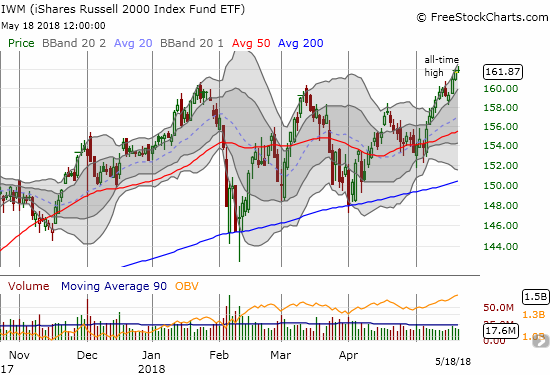
Financials were a clear loser on the week. The Financial Select Sector SPDR ETF (XLF) lost 0.8% and closed just above its 50DMA. So what helped AT40 drift higher for the rest of the week? Mainly small caps and industrials. The iShares Russell 2000 ETF (IWM) sprinted higher from Tuesday’s close and ended the week at a new all-time high.
The volatility index, the VIX, pulled back sharply from Tuesday’s mini-spike higher. It did not close at a low for the week but the move still supports the bulls and the buyers.
So between the boring big stocks and the fleet footed small caps sits my neutral short-term trading call. This is every bit a market still looking for a definitive catalyst. This condition is not aligned with the definitive rallies in the U.S. dollar index, oil prices, and interest rates. Any one of these moves could and should be delivering catalysts but instead it seems they are counterbalancing each other. The charts that make up today’s chart reviews are a small sample of the counterbalancing action that make up the overall market’s drift to nowhere.
CHART REVIEWS
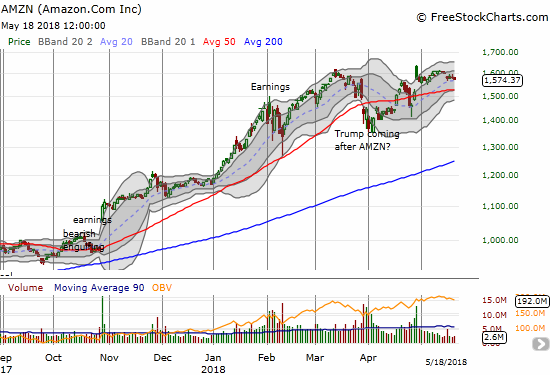
Amazon.com (AMZN)
AMZN was my biggest disappointment for the week. I started the week expecting momentum to return. Instead, even mighty AMZN succumbed to Tuesday’s selling and never recovered. I will wait to take another position: perhaps at a test of 50DMA support or upon filling last week’s gap down.
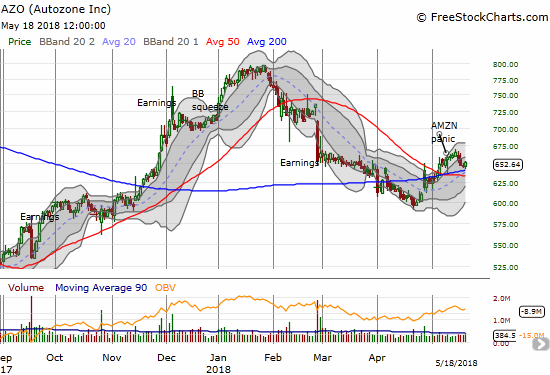
Autozone (AZO)
AZO pulled back perfectly into a fresh entry position. However, options prices are running extremely high with earnings coming up before market on May 22nd. As of Friday’s close the market is pricing in a +/-6% post-earnings move by Friday’s expiration. I am expecting a strong move to the upside, so I am considering a call spread. At a cost of around $2.50 the 680/690 call spread is looking particularly attractive (a +6% move takes AZO to $690).
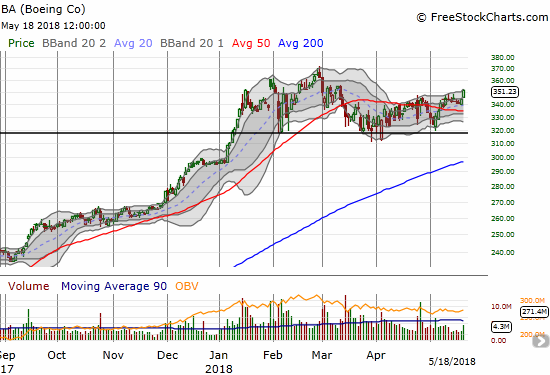
Boeing (BA)
BA is no longer a rangebound whipping stock. Volume picked up a bit as BA broke out to a new 2-month high. The stock looks pretty clear to challenge its all-time high from February. Last week’s busted puts will likely be my last on BA until it shows weakness again. My focus for hedges against bullishness go back to Caterpillar (CAT).
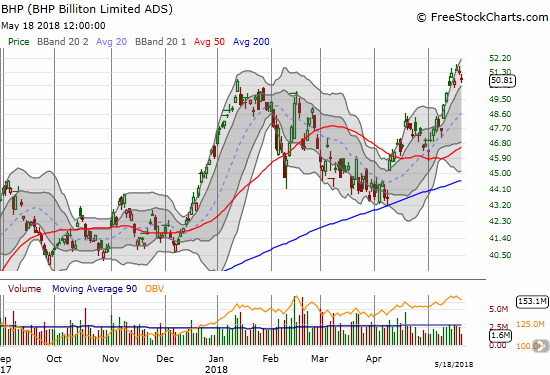
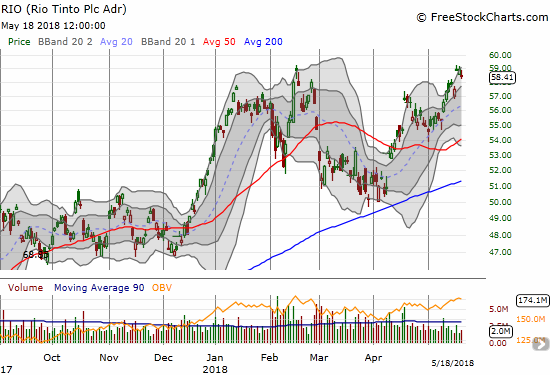
BHP Billiton (BHP) and Rio Tinto (RIO)
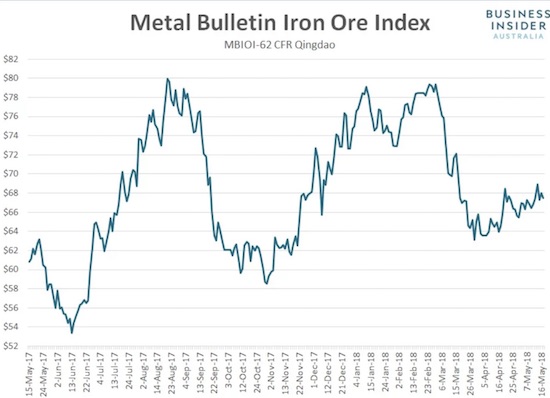
My iron ore pairs trade is back on. BHP pulled back from a 3-year high, so I bought put options. RIO matched its 2018 high. While I wanted to wait until it closed above that high, I figured this point was close enough to trigger buys on call options. Commodities across the board are soaring as inflation pressures continue to build in the global economy. Interestingly, iron ore is nowhere near its 2018 highs. Prices are even barely off the lows of the year. So if iron ore decides to play catch-up, I expect this pairs trade to profit to the upside and not the downside this time.
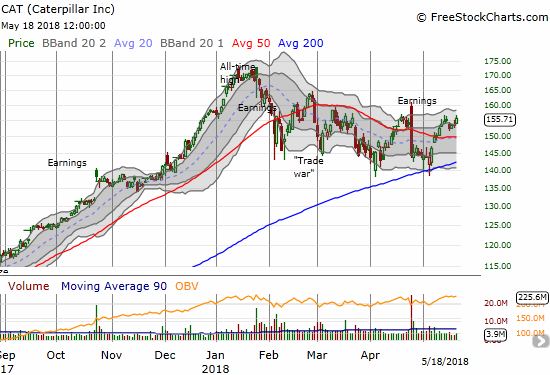
Caterpillar (CAT)
Like Boeing, CAT looks like another industrial stock that is turning the corner. CAT gained 1.3% on Friday in a show of relative strength. With a net positive post-earnings gain, investors have all but forgotten about CAT’s comments about margins hitting a peak for the year. Needless to say my last tranche of CAT puts expired worthless.
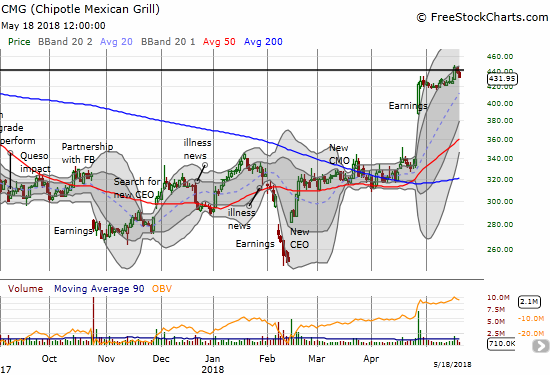
Chipotle Mexican Grill (CMG)
The fresh breakout in CMG I was looking for finally happened this week. While I was ready for it, my execution on the trade was sub-par. On Monday and Tuesday, CMG sprinted from the open only to pull back off its high for the day. After watching my position go from a decent profit and into the red for two straight days, I got trigger happy when CMG once again sprinted from the open on Wednesday. I took my profits and was dismayed to watch CMG continue racing higher. I was fortunate enough to get a new position when CMG pulled back from its high before continuing higher. Thinking the odds favored a gap up or at least another sprint higher on Thursday, I sat on my sizeable profit with only a small hedge by selling a far out-of-the-money call option. Thursday’s pullback was mild enough to encourage me to wait one more day for a resumption of the upward momentum. Friday failed to deliver.
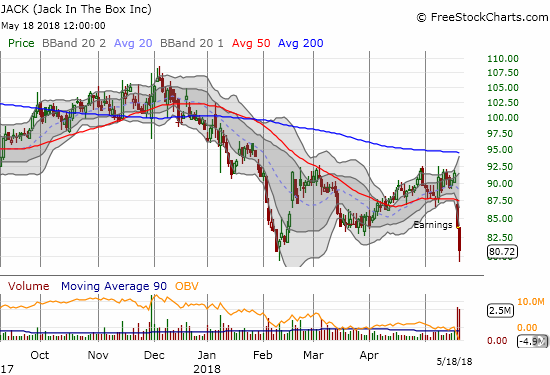
With my focus on the CMG position, I failed to note a disastrous earnings report from Jack In the Box (JACK) which may have helped pressure CMG lower. JACK dropped 8.3% on Thursday and fell another 3.7% on Friday. I heard pundits point to higher food commodity costs to help explain the investor displeasure with JACK; this pressure in turn reflected badly on the dining sector. Yet, it seems to me JACK experienced an improved inflation situation. From the Seeking Alpha transcript (emphasis mine):
“In Q1, you remember we had inflation of over 5%, it was 3.6% this quarter. So the inflation in the back half of the year will be lower than it was in Q1 and Q2, and I think like most companies one of the biggest inflationary items has been potatoes for the entire year and that continues for most of our competitors as well as our self.”
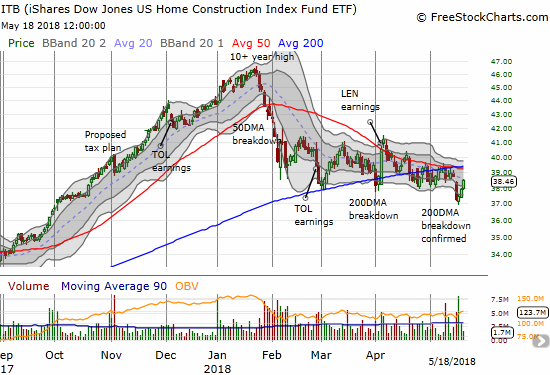
iShares US Home Construction ETF (ITB)
Home builders keep pushing me to the edge of throwing up my hands only to turn right around and demonstrate a glimmer of remaining promise. Tuesday’s pullback took ITB and many home builders into bearish territory. Interest rates soared, and ITB lost a whopping 3.8% to a 7-month low. I was prepared to sell on one more lower close. Instead, buyers rushed right back in. While this move looks promising, I prefer to take the opportunity to sell my remaining positions at lower losses. I will trigger fresh buys using the rules I discussed in my last post on home builders.
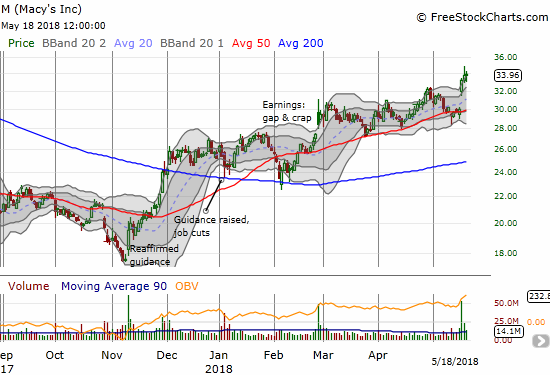
Macy’s (M)
Macy’s was one of my last positions from my now defunct call for a 2018 rally year for retail stocks. I felt partially vindicated to watch my call option soar again after Macy’s jumped 10% after earnings. I held onto the position one more day and locked in profits with the stock stretching well above its upper-Bollinger Band (BB). On a trend-following basis, M is still a buy on the dips especially back to 50DMA support.
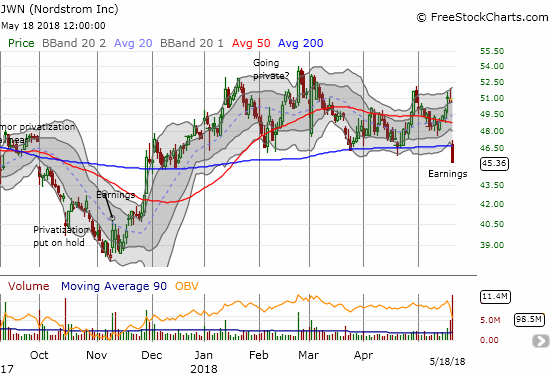
Nordstrom (JWN)
With Macy’s breaking out, expectations were likely riding high on JWN. Unfortunately, the company failed to deliver. If not for the 200DMA breakdown, I would look to buy the dip in anticipation of the stock eventually returning to levels that marked previous discussions of going private. I will trigger in the low 40s or a close above the 200DMA – whichever comes first.
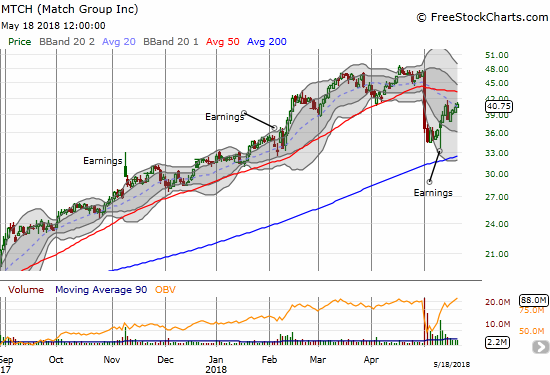
Match (MTCH)
This trade worked out extremely well and was by far the best of the week. I turned out to be correct to bias my hedged position heavily to the long side. My fist full of call options scored a near triple with my put options only taking out about 15% of my profit.
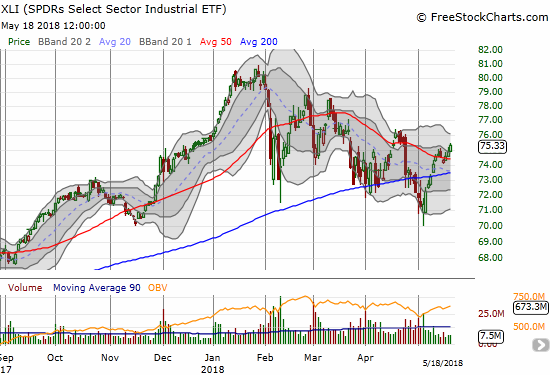
Industrial Select Sector SPDR ETF (XLI)
I was ready to declare weakness in the industrial stocks a confirmation of a bearish bias in the stock market. This past week, XLI showed new resilience by holding onto its 50DMA breakout. With the likes of BA (8.25% of XLI) and CAT (3.9% of XLI) showing a change in investor sentiment, industrials may yet help push the stock market back into a bullish bias. XLI next needs to firmly close above the April high to end the bearish pattern of lower highs and lower lows.
— – —
FOLLOW Dr. Duru’s commentary on financial markets via email, StockTwits, Twitter, and even Instagram!
“Above the 40” uses the percentage of stocks trading above their respective 40-day moving averages (DMAs) to assess the technical health of the stock market and to identify extremes in market sentiment that are likely to reverse. Abbreviated as AT40, Above the 40 is an alternative label for “T2108” which was created by Worden. Learn more about T2108 on my T2108 Resource Page. AT200, or T2107, measures the percentage of stocks trading above their respective 200DMAs.
Active AT40 (T2108) periods: Day #65 over 20%, Day #34 over 30%, Day #29 over 40%, Day #11 over 50%, Day #3 over 60% (overperiod), Day #79 under 70%
Daily AT40 (T2108)
")
Black line: AT40 (T2108) (% measured on the right)
Red line: Overbought threshold (70%); Blue line: Oversold threshold (20%)
Weekly AT40 (T2108)

*All charts created using freestockcharts.com unless otherwise stated
The charts above are my LATEST updates independent of the date of this given AT40 post. For my latest AT40 post click here.
Related links:
The AT40 (T2108) Resource Page
You can follow real-time T2108 commentary on twitter using the #T2108 or #AT40 hashtags. T2108-related trades and other trades are occasionally posted on twitter using the #120trade hashtag.
Be careful out there!
Additional disclosure: long BHP puts, long RIO calls
*Charting notes: FreeStockCharts.com stock prices are not adjusted for dividends. TradingView.com charts for currencies use Tokyo time as the start of the forex trading day. FreeStockCharts.com currency charts are based on Eastern U.S. time to define the trading day.