
AT40 = 59.7% of stocks are trading above their respective 40-day moving averages (DMAs)
AT200 = 49.1% of stocks are trading above their respective 200DMAs
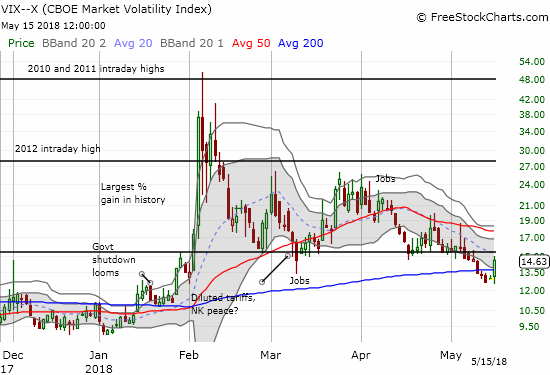
VIX = 14.6
Short-term Trading Call: neutral
Commentary
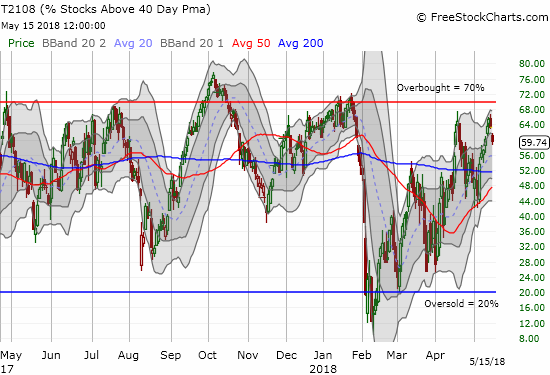
Here we are again…again. In the last Above the 40 I observed “the stock market looks like it is breaking free, but there are major caveats which keep me wary and sitting on a neutral short-term trading call.” One of the major caveats reared its ugly head: AT40 (T2108), the percentage of stocks trading above their respective 40DMAs, confirmed resistance at the 70% overbought threshold. The failure started Monday and Tuesday confirmed the failure with a sharp drop back to 59.7%. T2107, the percentage of stocks trading above their respective 200DMAs, also dropped below 50% again.
Unless the market makes another 180 degree turn, this inability to break through the 70% overbought threshold exposes the reluctance of buyers. This exhaustion gives an opening to sellers as the move going into this moment rode on a wake of low volume. The S&P 500 (SPY), the NASDAQ, and PowerShares QQQ ETF (QQQ) all gapped down on the day losing 0.7%, 0.8%, and 1.1% respectively. Each index closed at the bottom of upper-Bollinger Band (BB) channels. This pullback puts the 50DMAs right back into play for a test of support.
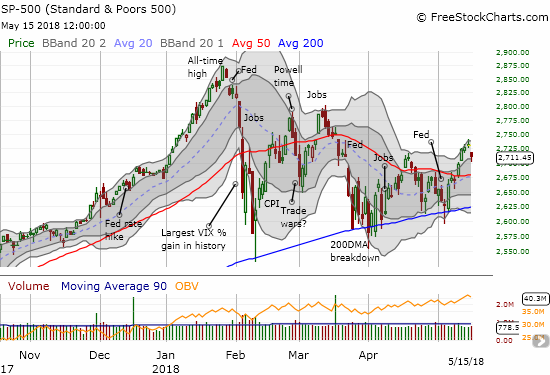

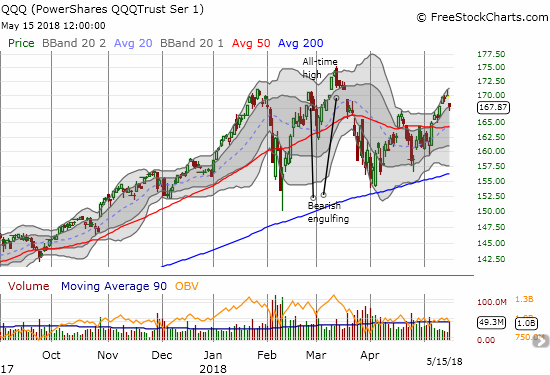
The GOOD news in each chart is the pattern of higher lows and higher highs as a part of the bounce from the March and April lows. Still, if the previous patterns persist, the S&P 500 is not only in for a test of 50DMA support but also in for yet another test of 200DMA support.
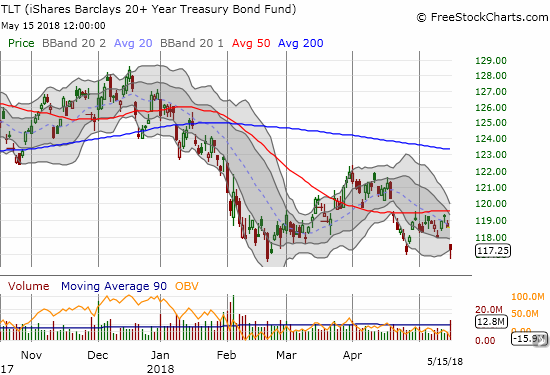
The presumed driver of the selling was a surge in the rate of the 10-year Treasury bond to 3.07%. The move took the iShares 20+ Year Treasury Bond ETF (TLT) down to its recent lows.
The volatility index, the VIX, responded by waking up for the first time in 3 weeks. The VIX gained 13.2% and stopped just short of the 15.35 pivot before fading a bit.
When the market was last in this position I was quick to change the short-term trading call to cautiously bearish. That call was good for about 2 weeks. This time around, I am reluctant to churn the trading call yet again especially with the potential for rates to pull back slightly. I am keeping the short-term trading call at neutral while granting that the odds are in favor of the sellers here. On the buying side, it makes sense to wait for the S&P 500 to test support (yet again) or to get bullish if the S&P 500 can turn around and erase the recent loss.
— – —
FOLLOW Dr. Duru’s commentary on financial markets via email, StockTwits, Twitter, and even Instagram!
“Above the 40” uses the percentage of stocks trading above their respective 40-day moving averages (DMAs) to assess the technical health of the stock market and to identify extremes in market sentiment that are likely to reverse. Abbreviated as AT40, Above the 40 is an alternative label for “T2108” which was created by Worden. Learn more about T2108 on my T2108 Resource Page. AT200, or T2107, measures the percentage of stocks trading above their respective 200DMAs.
Active AT40 (T2108) periods: Day #62 over 20%, Day #31 over 30%, Day #26 over 40%, Day #8 over 50%, Day #1 under 60% (underperiod ending 4 days over 60%), Day #76 under 70%
Daily AT40 (T2108)
")
Black line: AT40 (T2108) (% measured on the right)
Red line: Overbought threshold (70%); Blue line: Oversold threshold (20%)
Weekly AT40 (T2108)

*All charts created using freestockcharts.com unless otherwise stated
The charts above are my LATEST updates independent of the date of this given AT40 post. For my latest AT40 post click here.
Related links:
The AT40 (T2108) Resource Page
You can follow real-time T2108 commentary on twitter using the #T2108 or #AT40 hashtags. T2108-related trades and other trades are occasionally posted on twitter using the #120trade hashtag.
Be careful out there!
Additional disclosure: none
*Charting notes: FreeStockCharts.com stock prices are not adjusted for dividends. TradingView.com charts for currencies use Tokyo time as the start of the forex trading day. FreeStockCharts.com currency charts are based on Eastern U.S. time to define the trading day.