

The Market Breadth Summary
- Market leadership continued to broaden as capital moved through sectors in a soccer-like pass, rotate, advance pattern.
- The S&P 500 tested major resistance while the NASDAQ remained stuck at a short-term downtrend.
- Improving market breadth supported a cautiously bullish short-term outlook despite weakening AI and particularly semiconductor momentum.
- Financials, consumer-facing stocks, and selected software names strengthened advanced out of the latest rotation.
The Stock Market Summary
Just like many of you, I have been glued to the World Cup drama. I have been rooting for the United States and several other countries, and it got me thinking about how much the stock market resembles a soccer match: pass, rotate, advance.
The current stock market has a soccer-like rhythm. The pass: capital keeps moving, and buyers keep stepping into dips. The rotation: leadership keeps changing. One sector makes a strong run while another sector takes a rest or hangs back. The advance: one group breaks out and gives the indices their next push.
This year has delivered two periods of negative market breadth. At the same time the indices have powered on, first thanks to the aggressiveness of the AI trade and now thanks to lagging sectors playing some catch-up. Last week, financials became the latest sector to advance as a rotation into financials helped to power market breadth higher. After providing the structure and tempo for the advance, industrials and AI infrastructure have passed the ball along. Semiconductors previously accelerated the attack but finally appear exhausted and ready for a long overdue and extended rest. Mega-cap growth stocks have rotated among themselves, but fewer names are still strong enough to support the attack. After protecting possession, consumer-facing stocks have stepped into the advance thanks in part to a steady decline in oil prices.
Software is trying to rejoin the advance as rotation moves capital away from a crowded field of AI-related trades. As AI-related plays have stalled and rolled over, software has organized a counter-attack. Although the sector suffered a major setback during June, it now appears to be catching its breath and rejoining the advance. One major software player has failed to benefit and is instead getting weighed down by the AI repositioning. (See below).
At the same time, semiconductors and many related stocks are beginning to look tired. This fatigue appears as capital leaving one overcrowded area of the field and searching for space to create scoring opportunities.
Meanwhile, market breadth continues to confirm a broadening bullish story. Breadth has already broken through the defense of a two-month downtrend, and more importantly, it is continuing to advance.
Pass. Rotate. Advance.
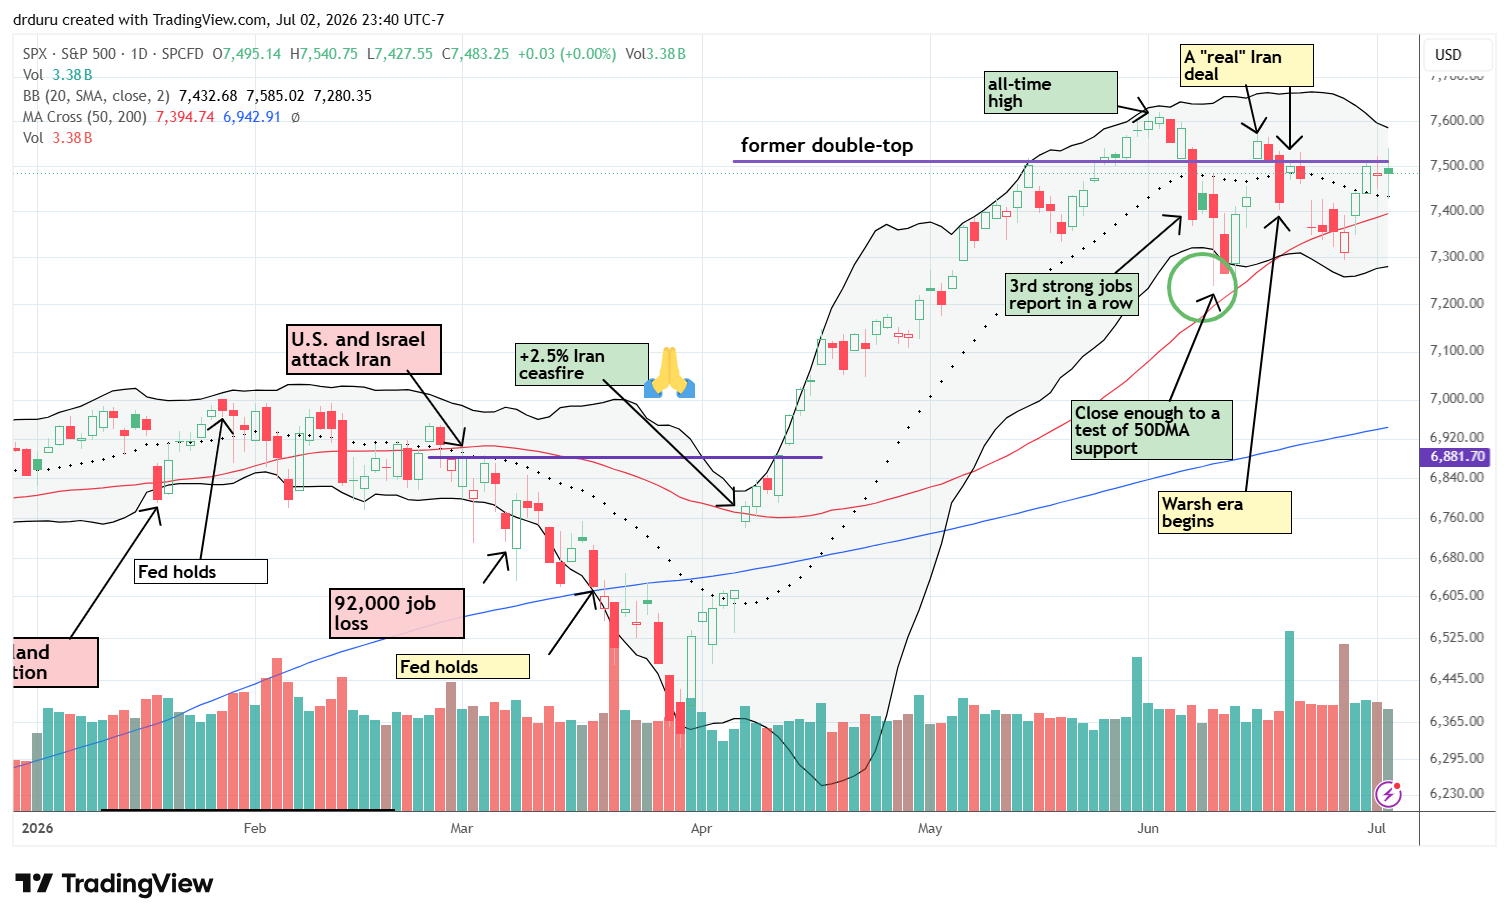
S&P 500 (SPY)
The S&P 500 (SPY) started the week with a breakout above its 50-day moving average (DMA) (the red line), and, as I planned in case of such a milestone, I flipped my short-term trading call to bullish (more below). However, the index stopped cold at a wall of resistance from the former double-top (purple line below). This 7,500 wall of defense is my current focus. Given the potential for an ongoing pivot, I see this flat wall dominating the technical picture over the downtrend formed by lower highs (not drawn). A successful breakout at 7,554, above the prior peak, would confirm that bullish momentum is continuing to move the market toward another sustained advance.
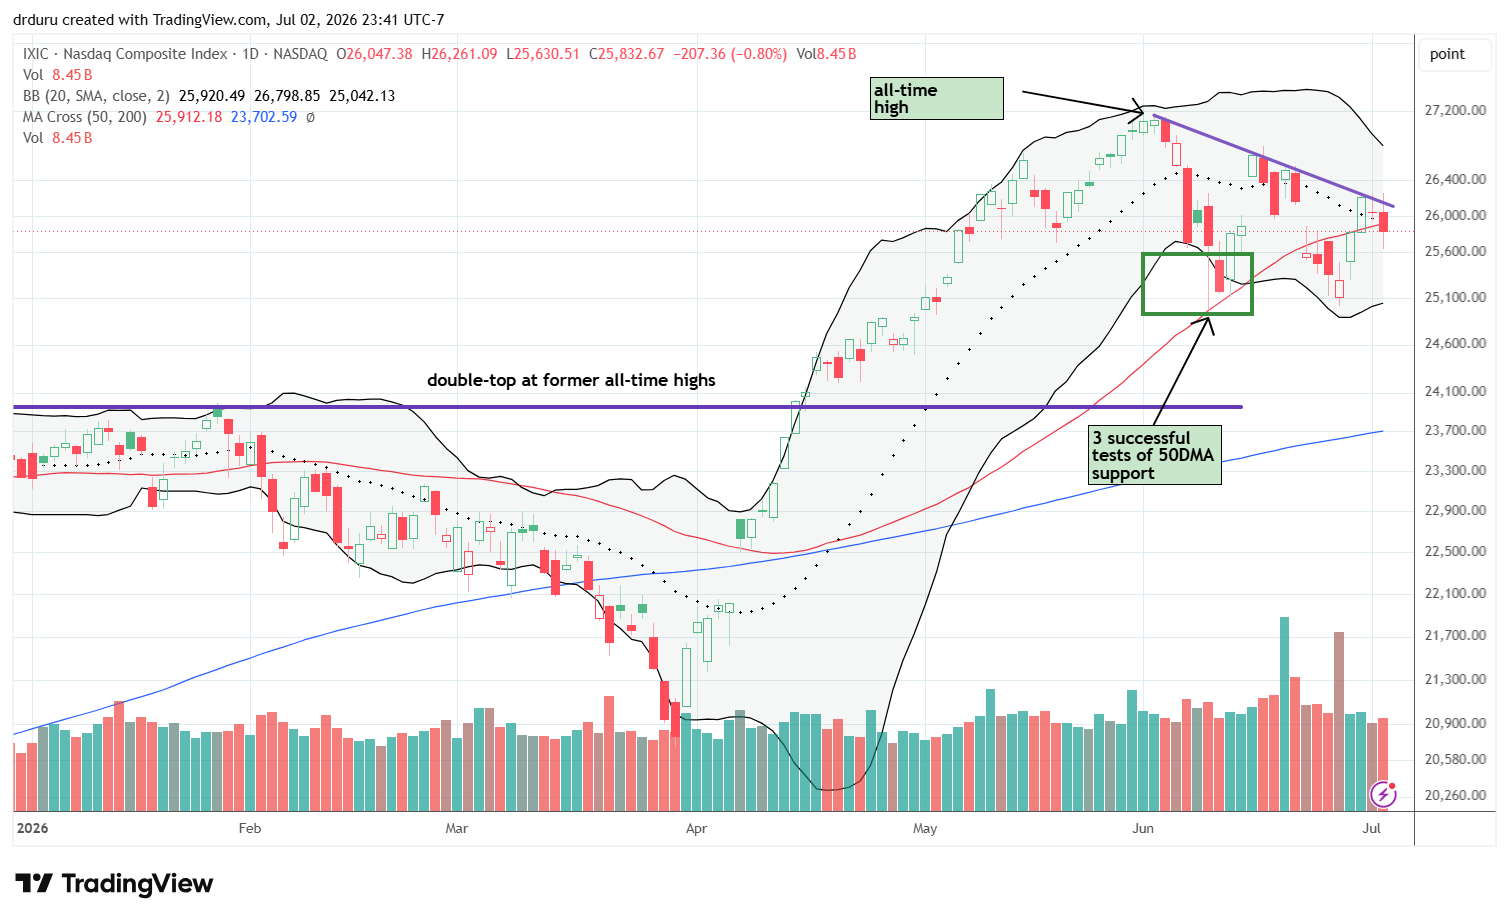
NASDAQ (COMPQ)
The NASDAQ has been even more indecisive with the ball than the S&P 500. The tech-laden index faded three straight days from tough defense at the downtrend wall, but it also held 50DMA support. In the previous test of the defense, the NASDAQ faded 5 straight trading days. This convergence on the wall is even more critical with the downtrending 20DMA (dashed line) right in the middle of the technical setup.
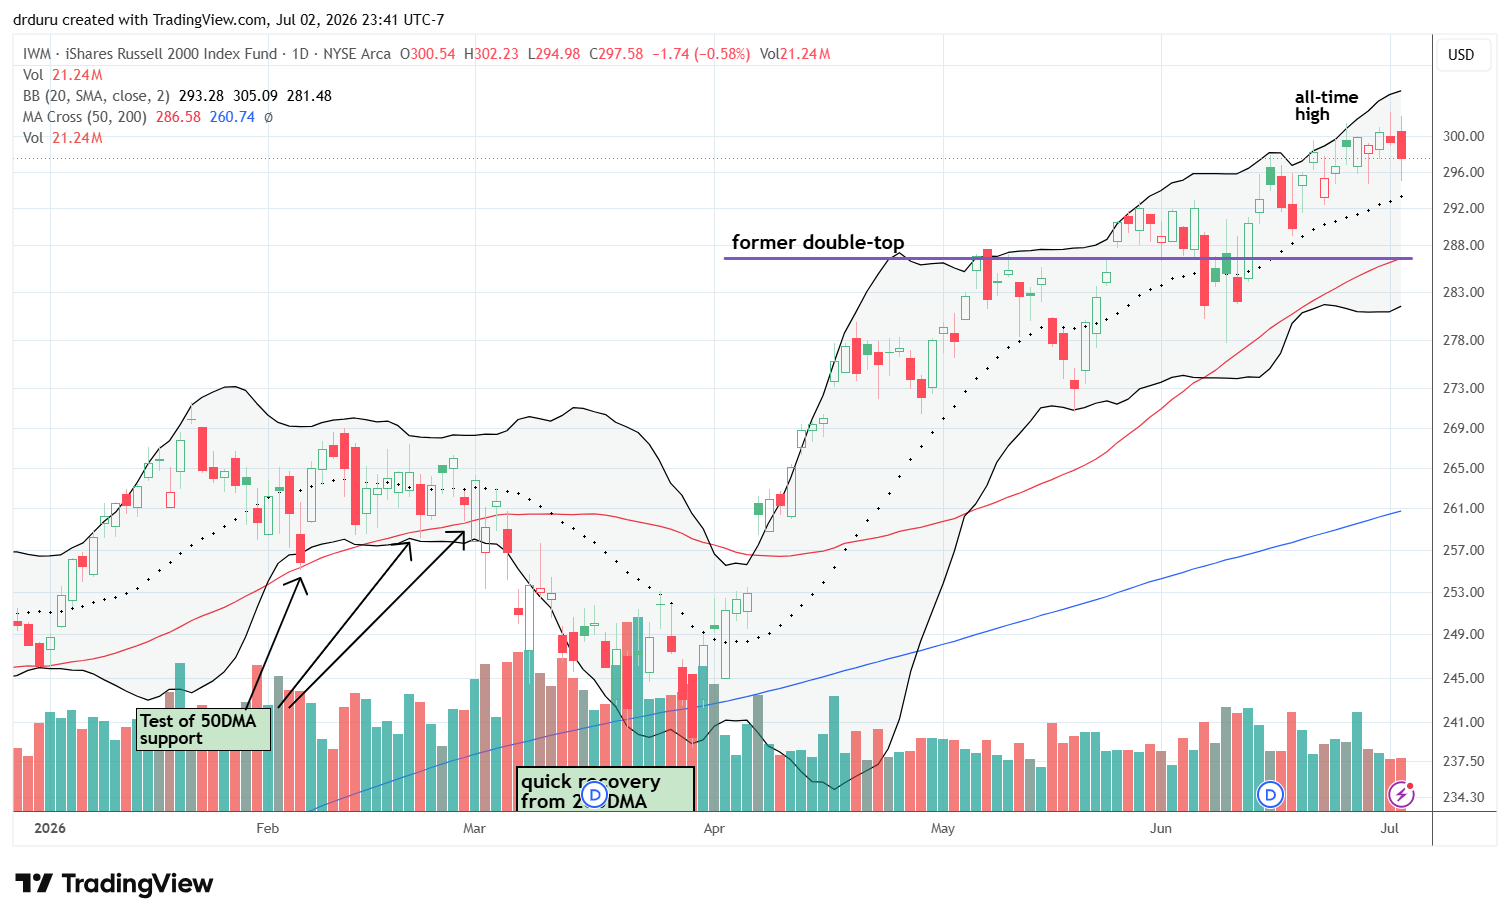
iShares Russell 2000 ETF (IWM)
The iShares Russell 2000 ETF (IWM) is pressing the defense by hanging right around the all-time high. IWM remains comfortably above both its 20DMA and its previous breakout above its former double-top. As those support levels remain intact, small caps continue contributing to the advance of market breadth.
The Short-Term Trading Call With Pass, Rotate, Advance
- AT50 (MMFI) = 59.4% of stocks are trading above their respective 50-day moving averages
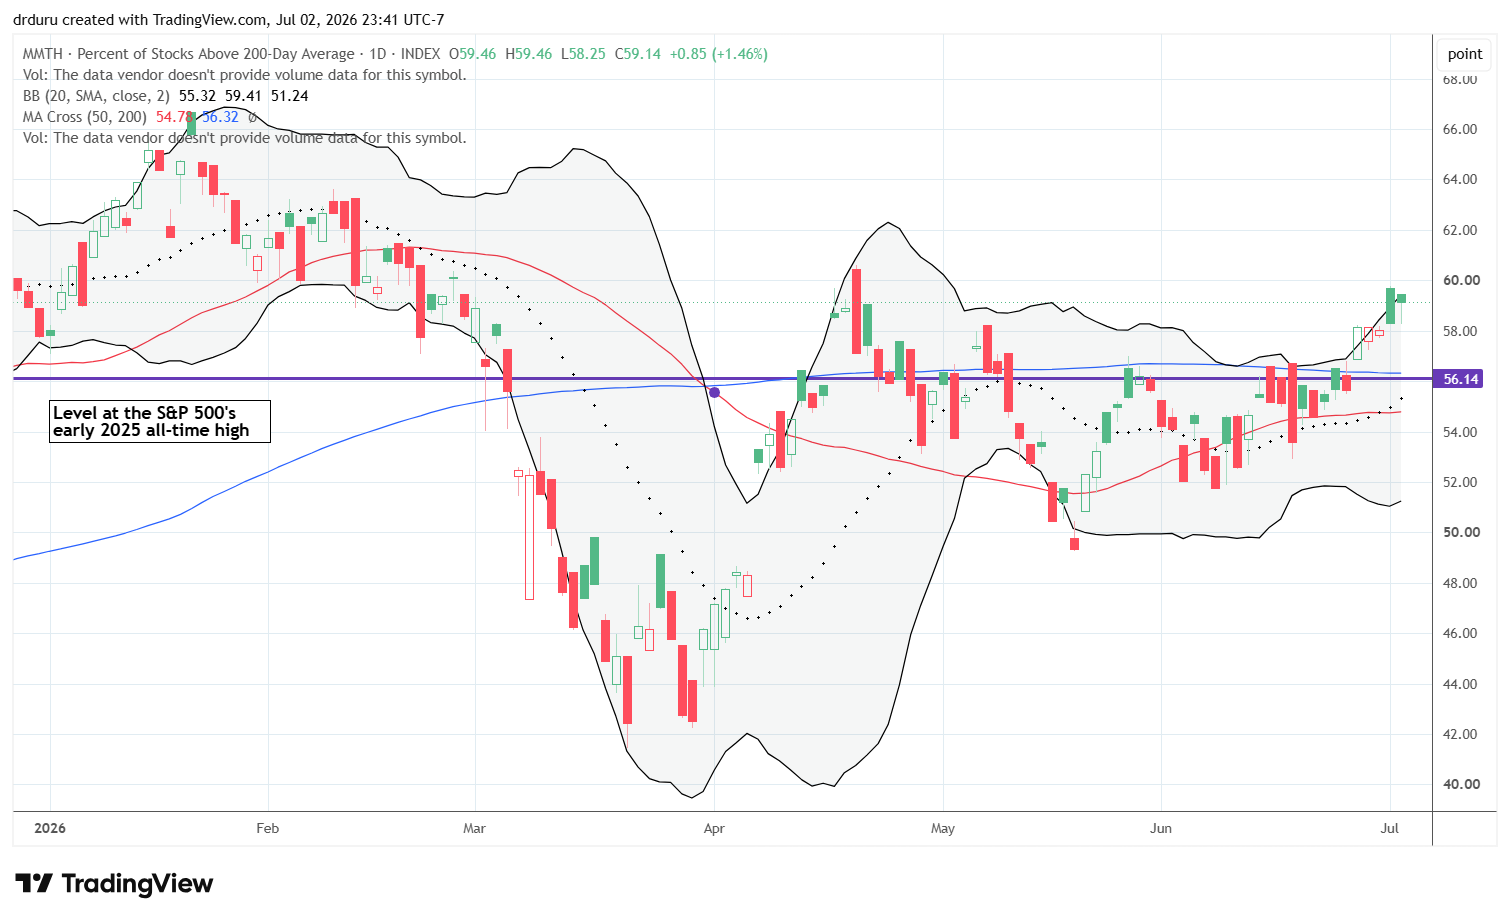
- AT200 (MMTH) = 59.1% of stocks are trading above their respective 200-day moving averages
- Short-term Trading Call: cautiously bullish
AT50 (MMFI), the percentage of stocks trading above their respective 50DMAs, closed the week at 59.4%. Market breadth remains bullish after breaking through the defense of a downtrend. This advance combined with the 50DMA breakout pushed me to flip my short-term trading call from neutral to cautiously bullish. The solid line of support near 50% successfully held possession and eventually passed the ball forward.
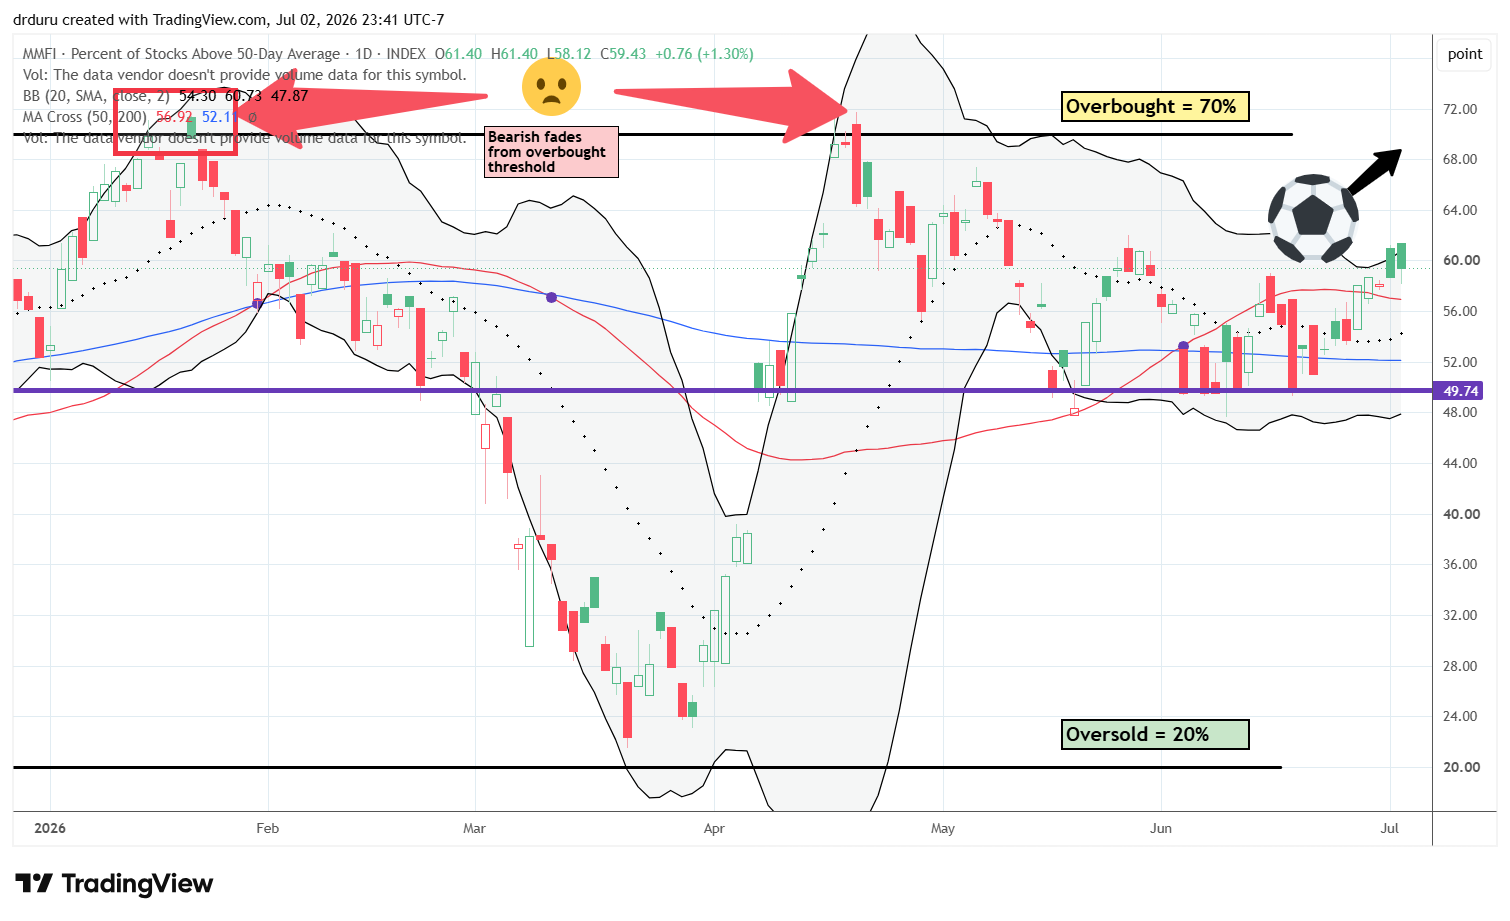
AT200, the percentage of stocks trading above their respective 200DMAs, closed the week at 59.1%. Long-term participation in the market’s advance remains in breakout mode and continues confirming a bullish market backdrop. The combination of improving short-term and long-term breadth supports a narrative of a bullish rotation.
In case you missed it…
Last week I took a brief step back and looked at the quarterly developments in the stock market. That survey of the full field offered a useful reminder of the stock market’s persistent bullish bias over time.
The Equities
State Street Financial Select Sector SPDR ETF (XLF)
Description: The State Street Financial Select Sector SPDR Fund is an exchange-traded fund that tracks large U.S. financial companies.
Technical status: The State Street Financial Select Sector SPDR ETF (XLF) moved away from its 20DMA, breaking out above its upper Bollinger Band and reaching levels last seen at the start of the year.
Trade commentary: XLF jumped into the advance in the last two days of the week. For the first time since the beginning of the year, the ETF is advancing down the field with momentum. A sustained rally in financials will help firm up market breadth.
")
Visa (V)
Description: Visa Inc. operates a global digital payments network that facilitates electronic payments between consumers, merchants, financial institutions, businesses, and governments.
Technical status: Visa Inc (V) broke out above its 200DMA, rapidly rising alongside its upper Bollinger Band and reaching a new high for the year.
Trade commentary: Not long ago, the narrative in financials was that stablecoins threatened to steal transactions from incumbent firms. Firms like Visa are not standing still. The credit card company launched its own stablecoin solution and in late April Visa added 5 stablecoin blockchains to its platform. Thus, while last week’s surge looks over-extended above the upper Bollinger Band (BB), V looks well positioned for the short- and long-term…after it works through a near inevitable pullback after the near parabolic end to last week’s trading.
")
Circle Internet Group, Inc (CRCL)
Description: Circle Internet Group, Inc. is a financial technology company focused on stablecoin infrastructure and digital payment systems.
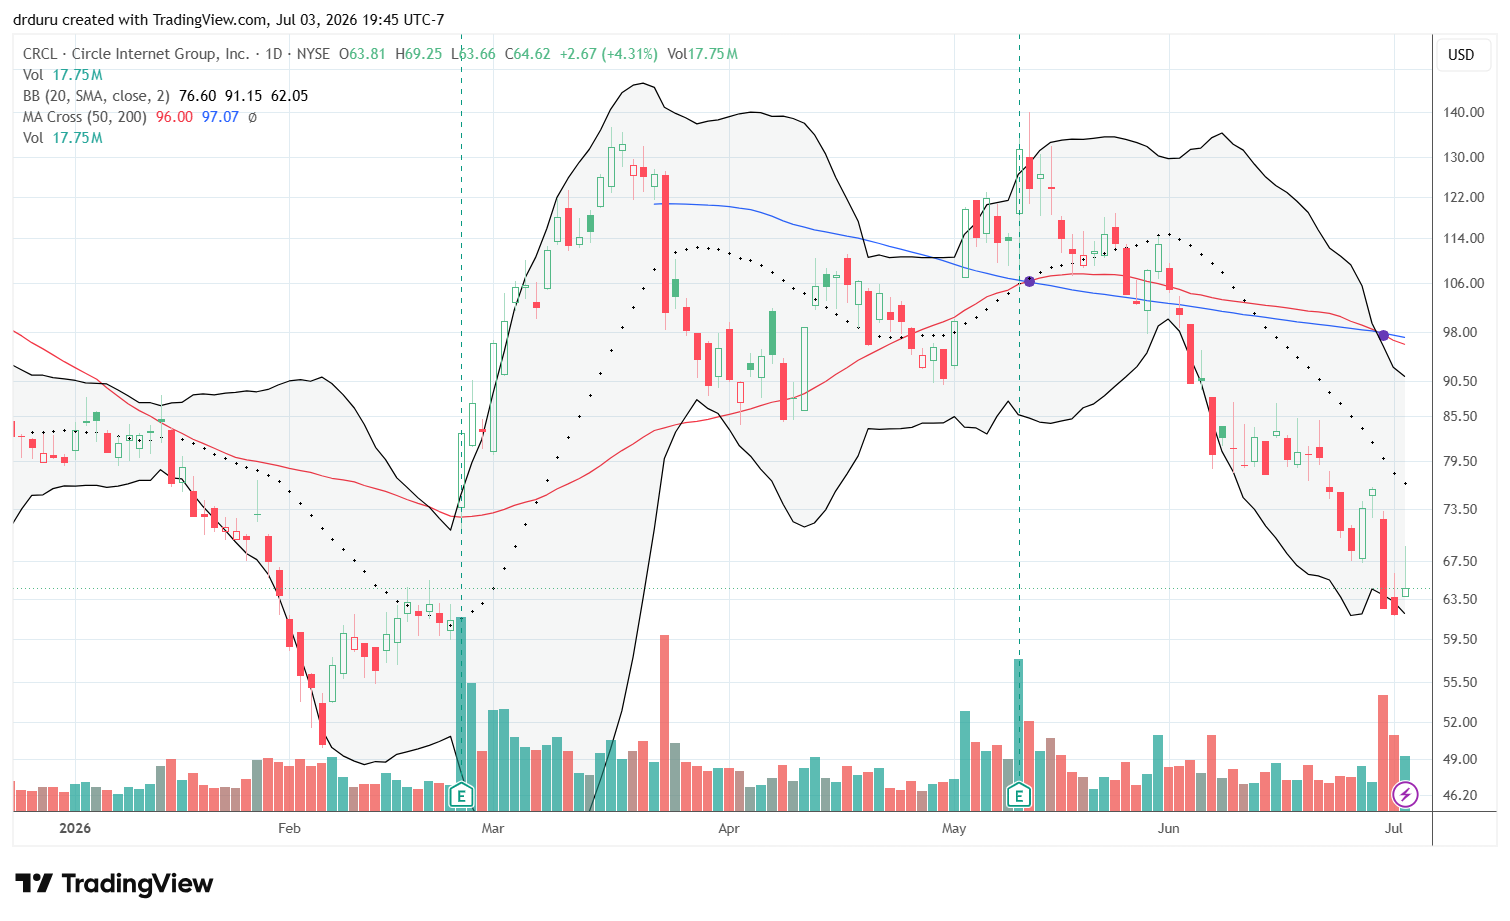
Technical status: Circle Internet Group, Inc. (CRCL) roundtripped its earnings gains from February and looks positioned to test its all-time low around $50.
Trade commentary: With incumbent financial firms already moving into stablecoins, CRCL looks relatively unattractive beyond a trade. The stock hit the market with a double from its $31 IPO price and skyrocketed to $300 in less than 3 weeks. I should not need to tell you what happened from there. The stock quickly fell 35% and has not been the same since. The stock hit an all-time low in February at $50.23 and looks set to retest that level.
United States Oil Fund (USO)
Description: United States Oil Fund is an exchange-traded fund designed to track the daily price movements of West Texas Intermediate crude oil.
Technical status: The United States Oil Fund (USO) broke down below its 50DMA and declined throughout June as hostilities in Iran cooled off.
Trade commentary: USO peaked with a double-top in April and May and has not been the same since. I tried multiple fades of USO since March with put calendar spreads. Only my last position worked. I never decided to get back to betting against USO. Now, USO looks poised to test 200DMA support. In March I described how rising oil prices loomed over everything. Now, oil is fueling a rotation into formerly exhausted consumer-facing stocks as lower oil prices provide some relief to consumers.
")
Caterpillar (CAT)
Description: Caterpillar Inc. manufactures construction and mining equipment, diesel and natural gas engines, industrial turbines, and locomotives.
Technical status: Caterpillar Inc (CAT) made new all-time highs before dipping sharply in response to a Michael Burry short.
Trade commentary: CAT fell 6.9% on Wednesday after news that Michael Burry disclosed a short position. Sellers continued to press against CAT’s advance with a 2.8% loss on Thursday. CAT is now clinging to 20DMA support but has momentum for testing 50DMA support. The stock has enjoyed a steady uptrend since the April, 2025 14+ month low.
")
BorgWarner (BWA)
Description: BorgWarner Inc. supplies propulsion systems and components for combustion, hybrid, and electric vehicles.
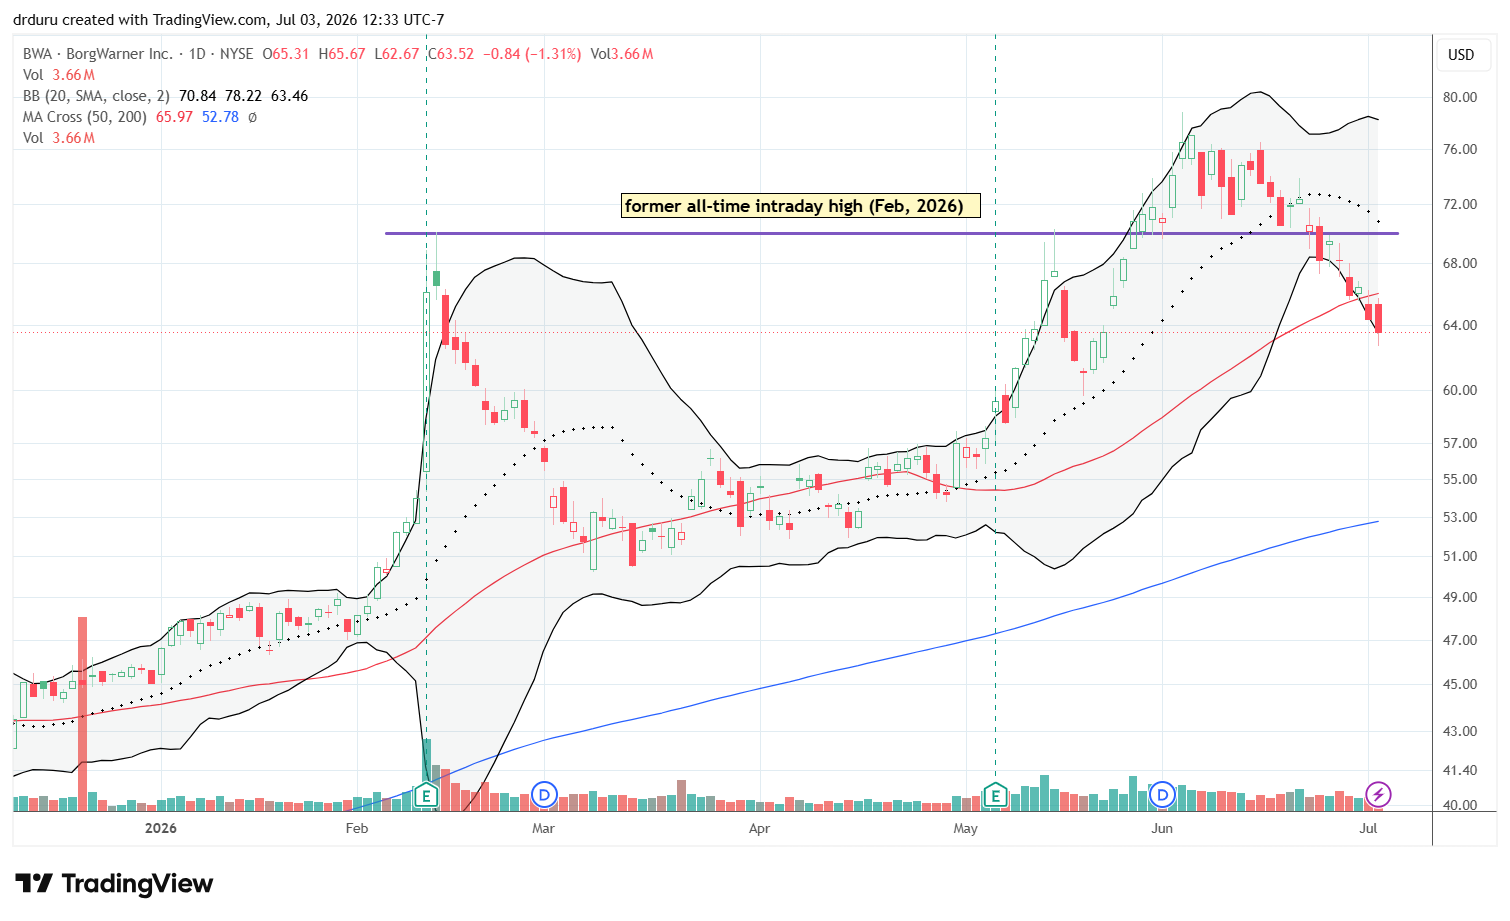
Technical status: BorgWarner (BWA) broke below its 50DMA and weakened its intermediate-term trend.
Trade commentary: In late May, I watched BWA as it prepared to invalidate a double-top that motivated me to take profits. The breakout lasted into early June and came to an end in late June. Last week’s confirmed 50DMA breakdown suggests the stock has topped out for the time being. BWA is on the losing end of the current rotation.
First Solar (FSLR)
Description: First Solar, Inc. manufactures thin-film photovoltaic solar modules and utility-scale solar energy systems.
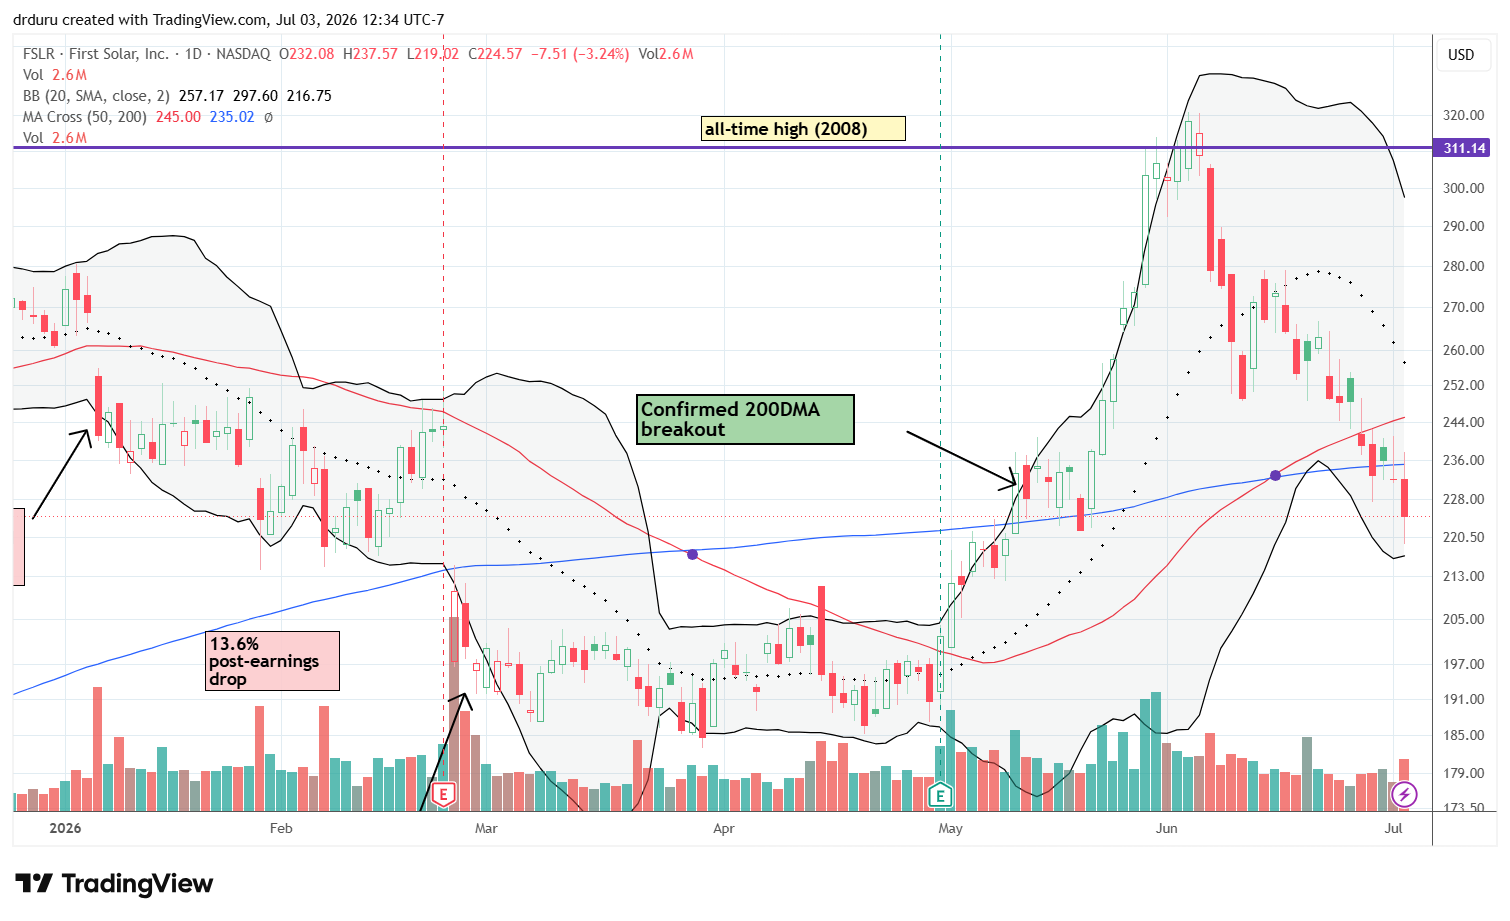
Technical status: First Solar (FSLR) broke below both its 50DMA and 200DMA, confirming a bearish technical breakdown.
Trade commentary: I was fooled by FSLR’s breakout to an all-time high in May. At the time the stock looked set for a continuation rally. Instead, the move motivated intense profit-taking starting with an 11.4% plunge. A month later FSLR is right back to the level where it broke out above its 200DMA in early May. Although FSLR is now in full retreat from the defense with 50DMA and 200DMA breakdowns, I am holding in anticipation of an eventual rotation back into solar names. A lot of these large swings are coming without substantive news, so I see FSLR as swinging on trader sentiment, which is, of course, fickle.
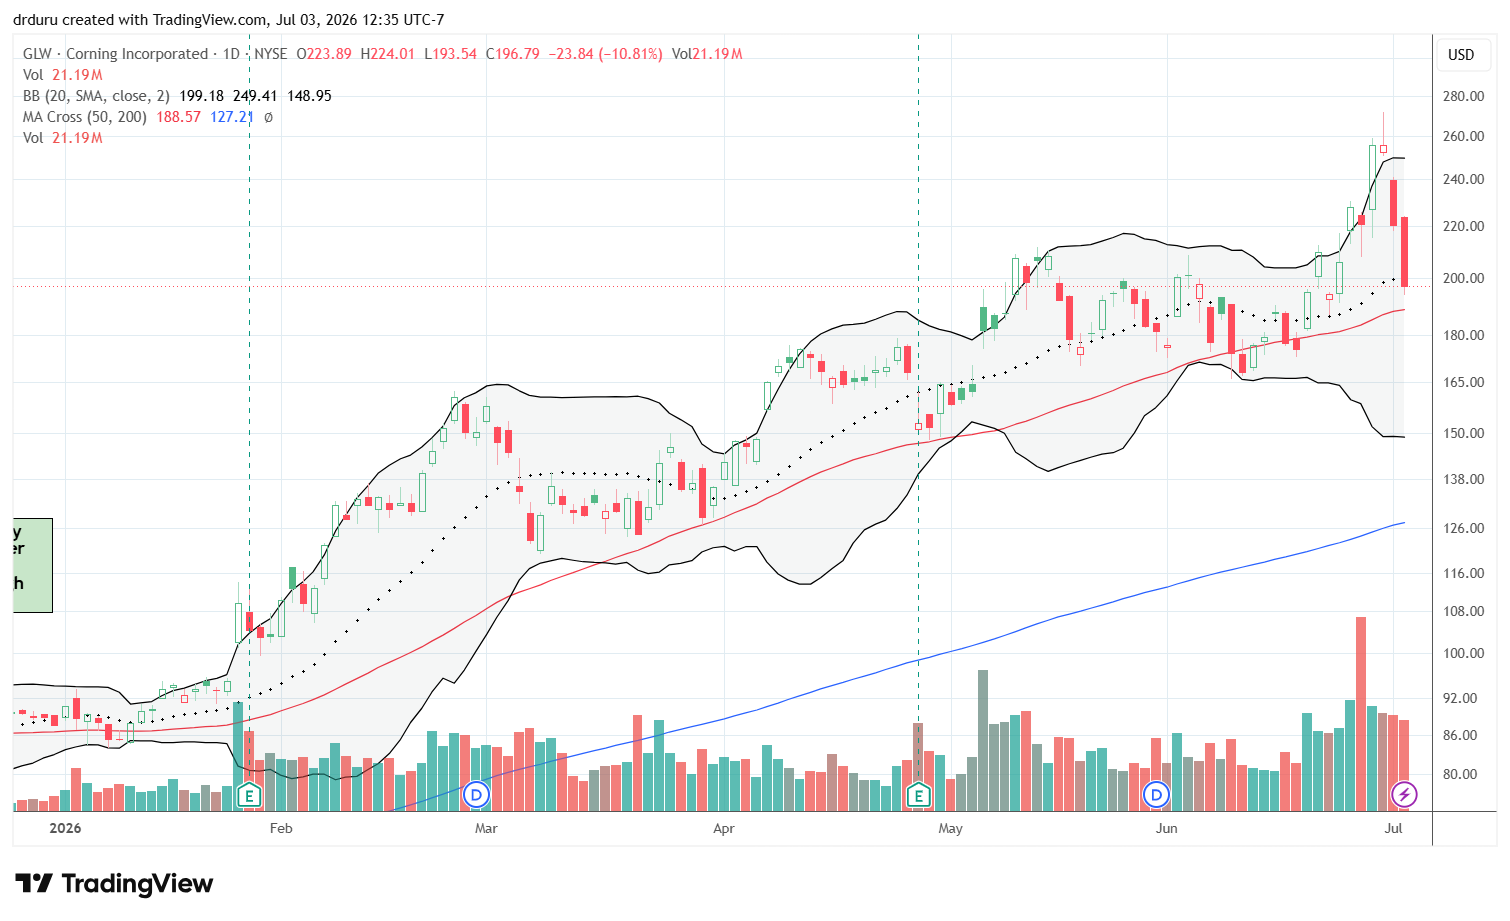
Corning (GLW)
Description: Corning Incorporated manufactures specialty glass, ceramics, optical communications products, and advanced materials.
Technical status: Corning (GLW) remained above its 50DMA despite cooling sharply after a parabolic advance.
Trade commentary: GLW started the week with a 15.7% surge to an all-time high. The move was part of a coordinated advance across AI-related stocks that looked momentum related. The over-extended stock quickly succumbed to profit-takers as the stock lost 12.6% and 10.8% on the final two days of the week. I am watching closely to see whether the defense holds the line at the 50DMA uptrend. While I do not expect support to hold this time, I am willing to chase a bounce from support.
Applied Optoelectronics (AAOI)
Description: Applied Optoelectronics, Inc. designs and manufactures fiber-optic networking products used in data centers, telecommunications, and cable broadband networks.
Technical status: Applied Optoelectronics Inc (AAOI) broke down below its 50DMA and sold off to a 3-month low.
Trade commentary: AAOI landed on my radar in March. A test of 50DMA support did not come until higher prices in May. That trade worked, but it was short-lived. Now, AAOI has clearly rolled over from a technical perspective with a 50DMA breakdown following almost 2 months of churn. I assume AAOI is getting hit as part of a slow rotation away from AI-related trades. I am now watching for a possible test of the 200DMA near previous support.
")
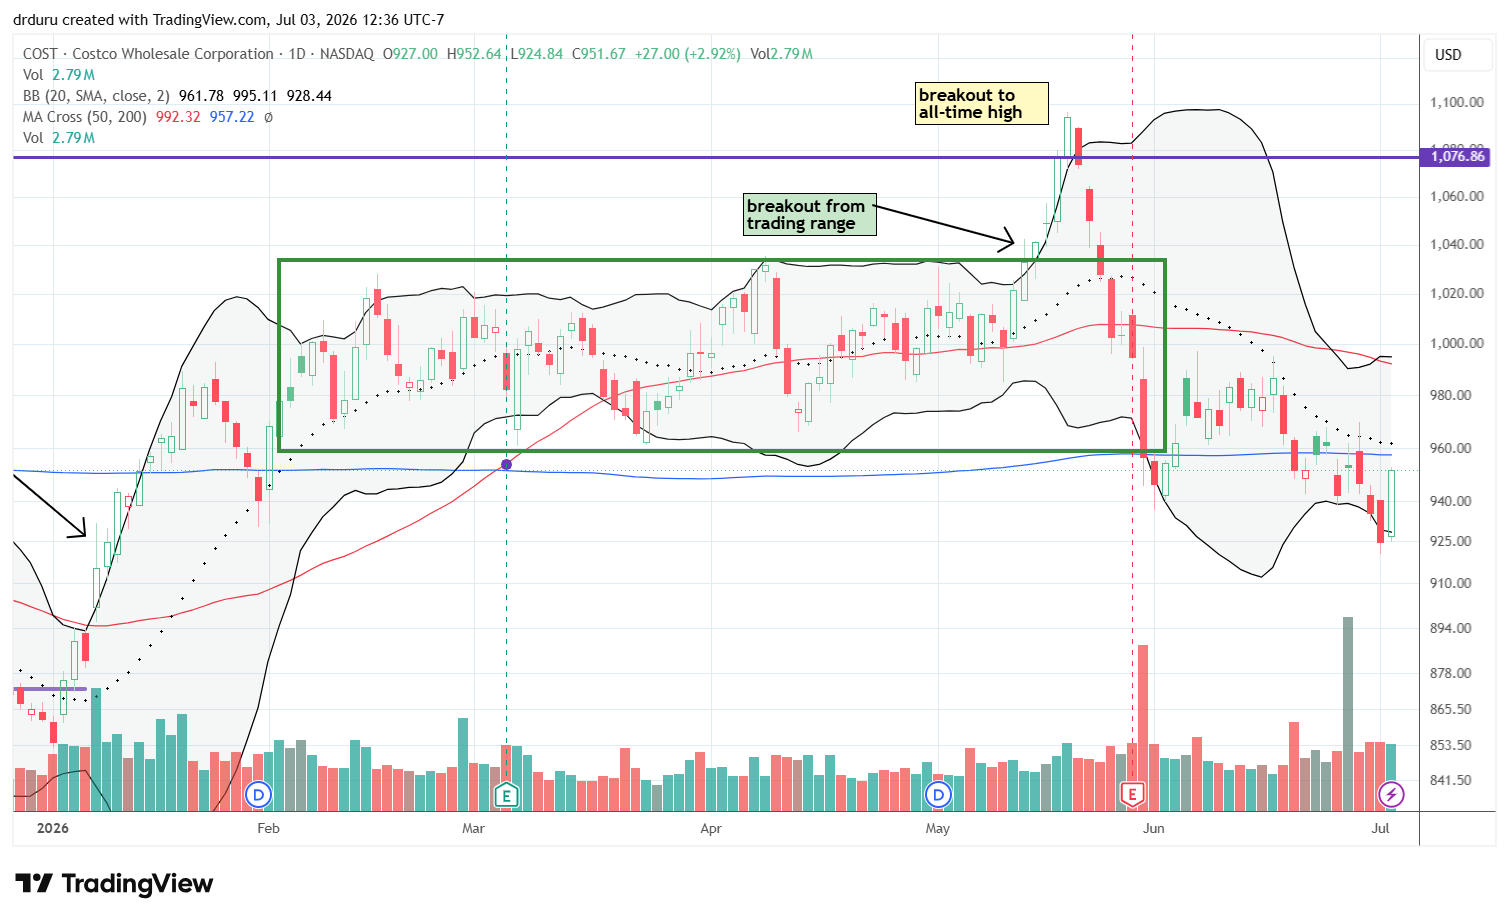
Costco Wholesale (COST)
Description: Costco Wholesale Corporation operates membership warehouse clubs that sell groceries, household goods, electronics, and other merchandise.
Technical status: Costco (COST) attempted to recover into its previous trading range but remained technically bearish.
Trade commentary: COST is another example of a stock where a major breakout to an all-time high turned into a major disappointment. The reversal in sentiment in May was sharp. The accompanying selling paused after a 200DMA breakdown to start the month of June. COST entered July with a fresh 200DMA breakdown. Despite the bearish positioning, I am positioning for an eventual resumption of upward momentum in another year or two.
Walmart (WMT)
Description: Walmart Inc. operates retail stores, warehouse clubs, and e-commerce platforms worldwide.
Technical status: Walmart Inc (WMT) broke down below its 200DMA and finished erasing its gains for the year.
Trade commentary: WMT is faring worse than COST from a technical standpoint. Like COST, WMT suffered a brief 200DMA breakdown at the beginning of June. The relief was also brief and WMT entered July facing accelerated selling into a new 200DMA breakdown. Also like COST, I am building a long-term position that started with June’s test of 200DMA support. I suspect WMT may churn for quite some time given its high valuation.
")
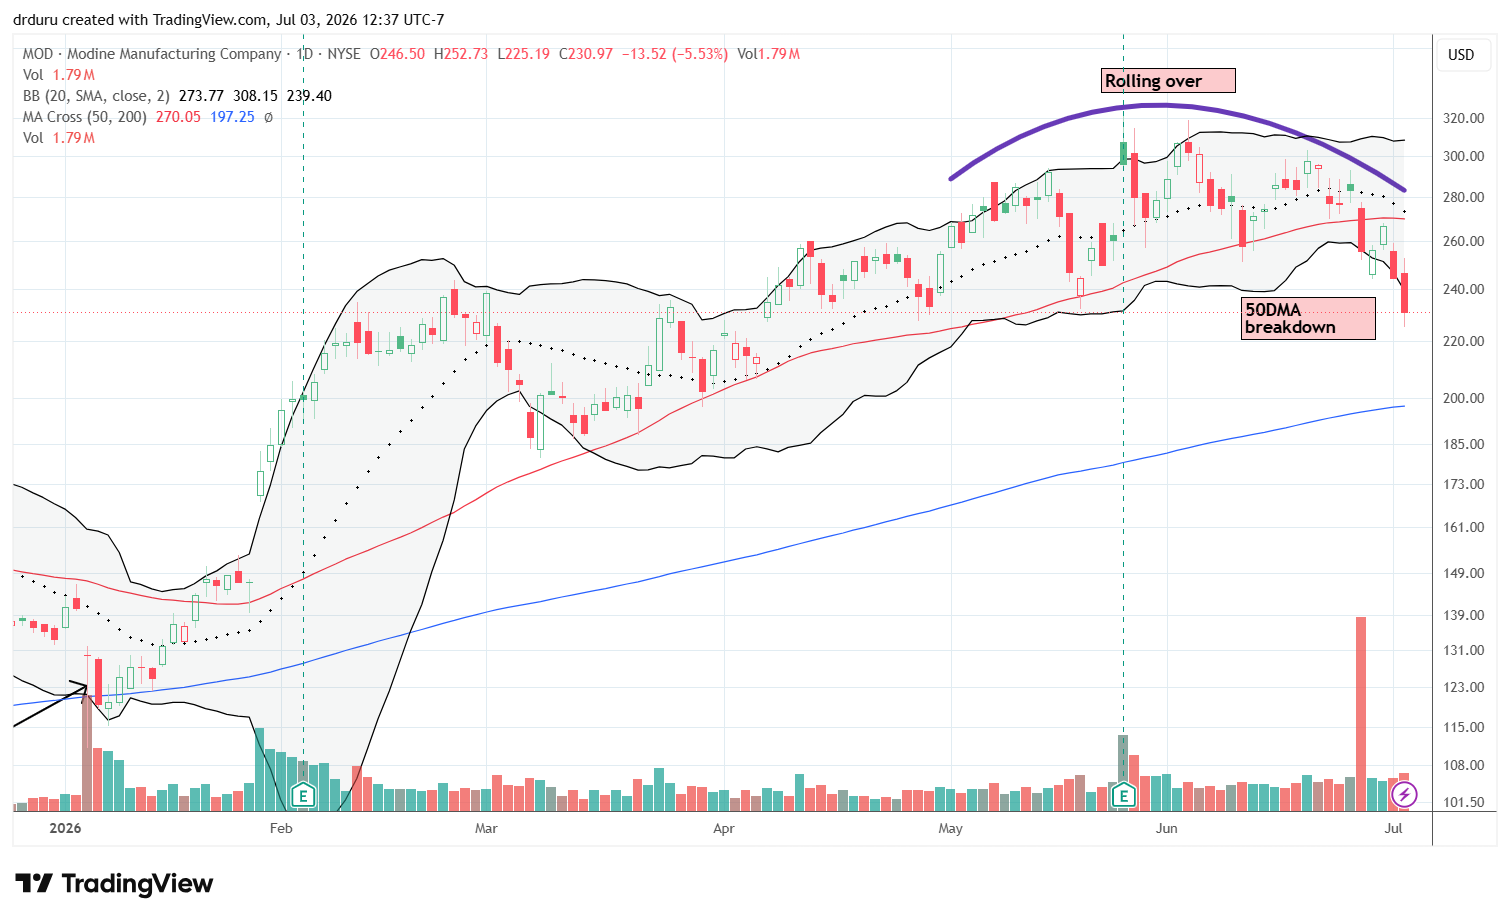
Modine Manufacturing (MOD)
Description: Modine Manufacturing Company develops thermal management systems and technologies for commercial, industrial, and data center applications.
Technical status: Modine Manufacturing (MOD) broke below its 50DMA and weakened its AI-related uptrend.
Trade commentary: Money appears to be rotating away from MOD as part of the slow but notable rotation away from AI-related trades. Last week, MOD confirmed a 50DMA breakdown and trades at a 3-month low. The stock looks positioned for an eventual test of 200DMA support at which point I will consider buying.
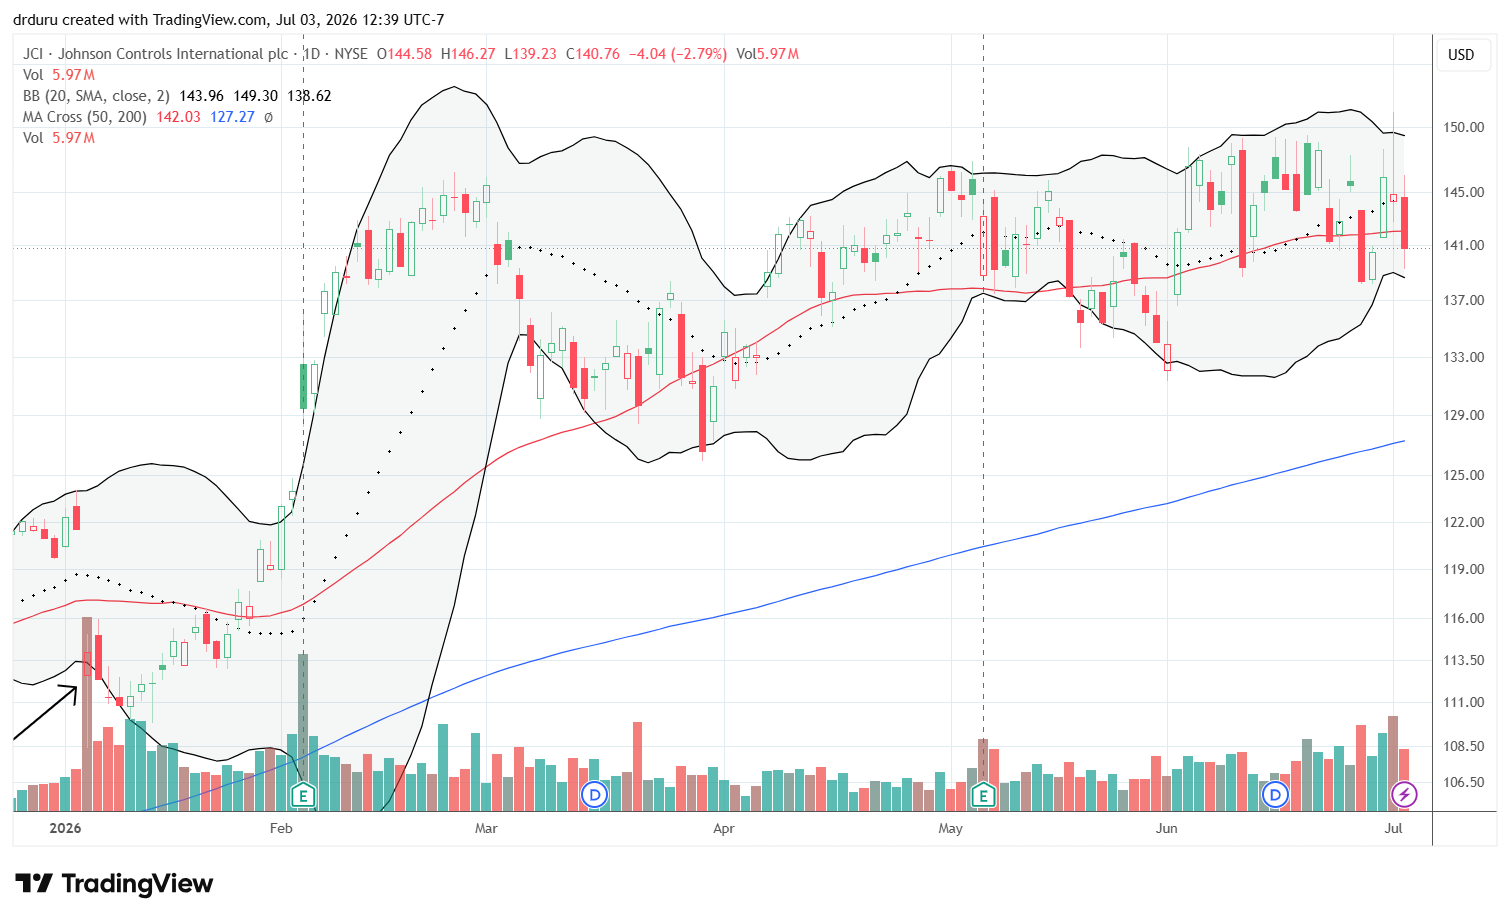
Johnson Controls (JCI)
Description: Johnson Controls International plc provides building automation, HVAC, fire protection, and security solutions.
Technical status: Johnson Controls (JCI) has pivoted around its 50DMA for 4 months while making incremental new all-time highs.
Trade commentary: When NVIDIA (NVDA) announced in January that its chips needed less cooling, I created a pairs trade going long JCI versus short MOD. MOD seemed more dependent on the data center cooling business, but the stock skyrocketed from that first day of selling. JCI meandered and then slowly regained momentum. Overall, the price dynamics were ill-suited for the options that I bought. Now, JCI has finally “caught up” to MOD simply by going nowhere since the peak for the NVDA news recovery in February. I do not see a good trade on JCI until it tests 200DMA support or breaks out to a new all-time high. Between those levels, the stock remains stuck in rangebound price action.
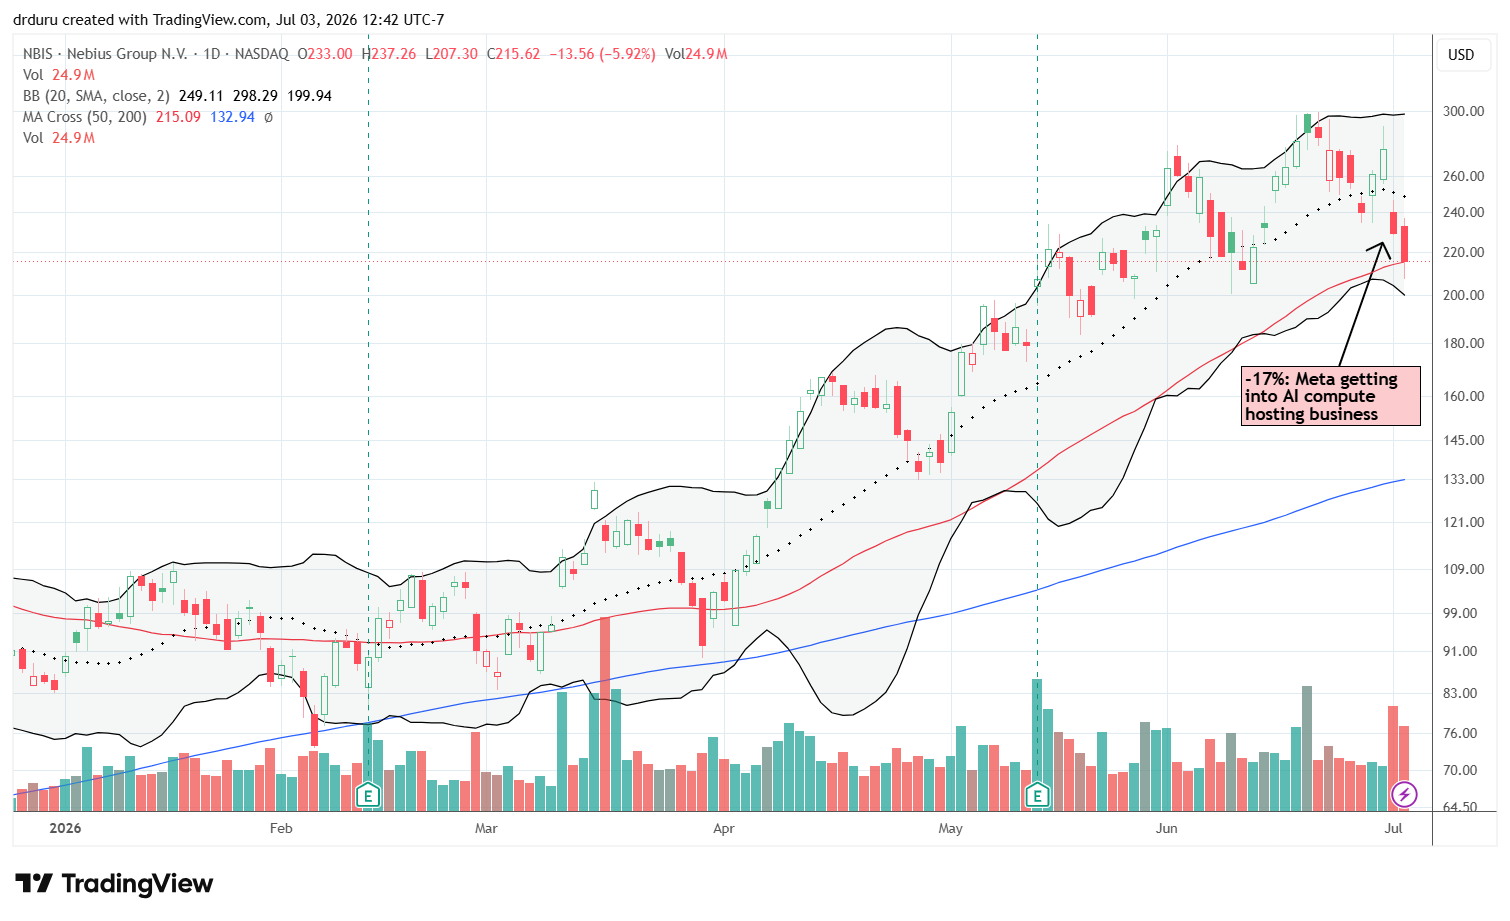
Nebius Group N.V. (NBIS)
Description: Nebius Group N.V. provides AI cloud infrastructure and cloud computing services.
Technical status: Nebius (NBIS) pulled back 17% after reports about Meta moving into the AI compute business and is now testing 50DMA support for the first time since March.
Trade commentary: I have been waiting for an opportunity to buy NBIS, and this pullback may provide that chance. I will be watching carefully to see whether 50DMA support holds.
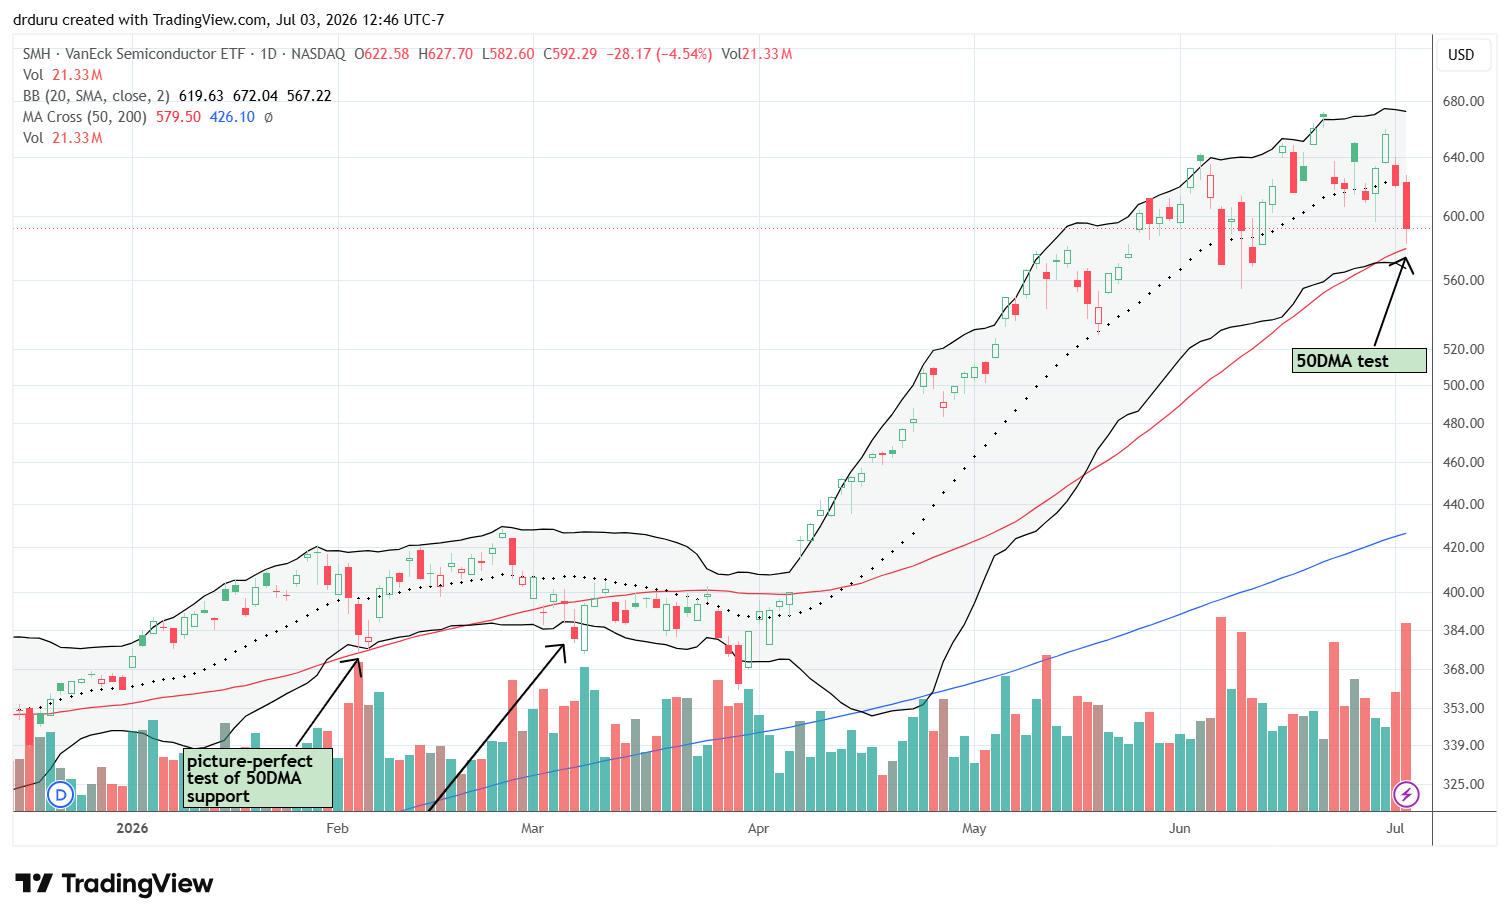
VanEck Semiconductor ETF (SMH)
Description: The VanEck Semiconductor ETF seeks to track companies involved in semiconductor production and equipment.
Technical status: The VanEck Semiconductor ETF (SMH) rolled over and approached 50DMA support.
Trade commentary: Semiconductors are decelerating after a very strong run. The money passing away from the sector appears to be rotating into other sectors ready to lead the next phase of advance in the indices. The uptrending 20DMA defined the latest aggressive buying in SMH. The multiple tests and breaks of 20DMA support indicate slowing interest.
Roundhill DRAM ETF (DRAM)
Description: The Roundhill DRAM ETF invests in companies involved in memory semiconductor technologies.
Technical status: The Roundhill Memory ETF (DRAM) fell below 20DMA support after a blow-off top and headed toward a test of its 50DMA.
Trade commentary: The deceleration in semiconductors is even more pronounced in DRAM. A second blow-off top on June 22 looks more ominous than the now invalidated blow-off top from May 11. While a top at that time was aligned with topping signals in the rest of the market, this latest topping signal is a significant divergence from the general market. I am watching closely for the results of a test of 50DMA support. DRAM also has support at $55, its price at May’s peak and blow-off top.
")
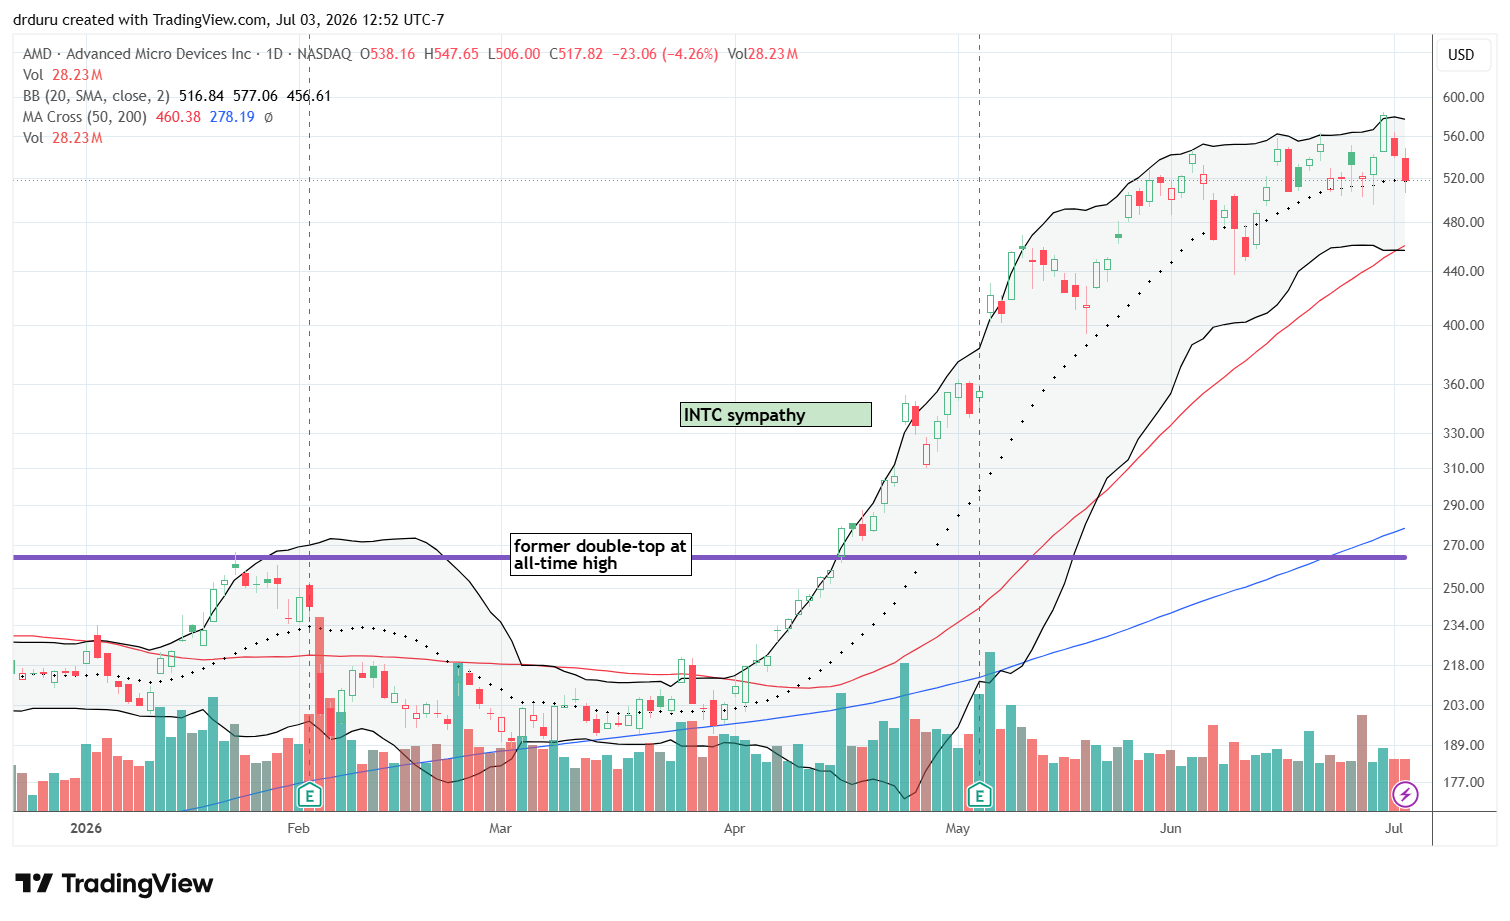
Advanced Micro Devices (AMD)
Description: Advanced Micro Devices develops processors, graphics products, and adaptive computing technologies.
Technical status: Advanced Micro Devices (AMD) remained in a healthy uptrend while holding 20DMA support.
Trade commentary: AMD continues to provide one of the brighter spots within semiconductors as 20DMA support held last week. Still, the rapid gains from April and May gave way to churning in June. I remain astounded by AMD’s rapid ascension with more than a double since April’s breakout.
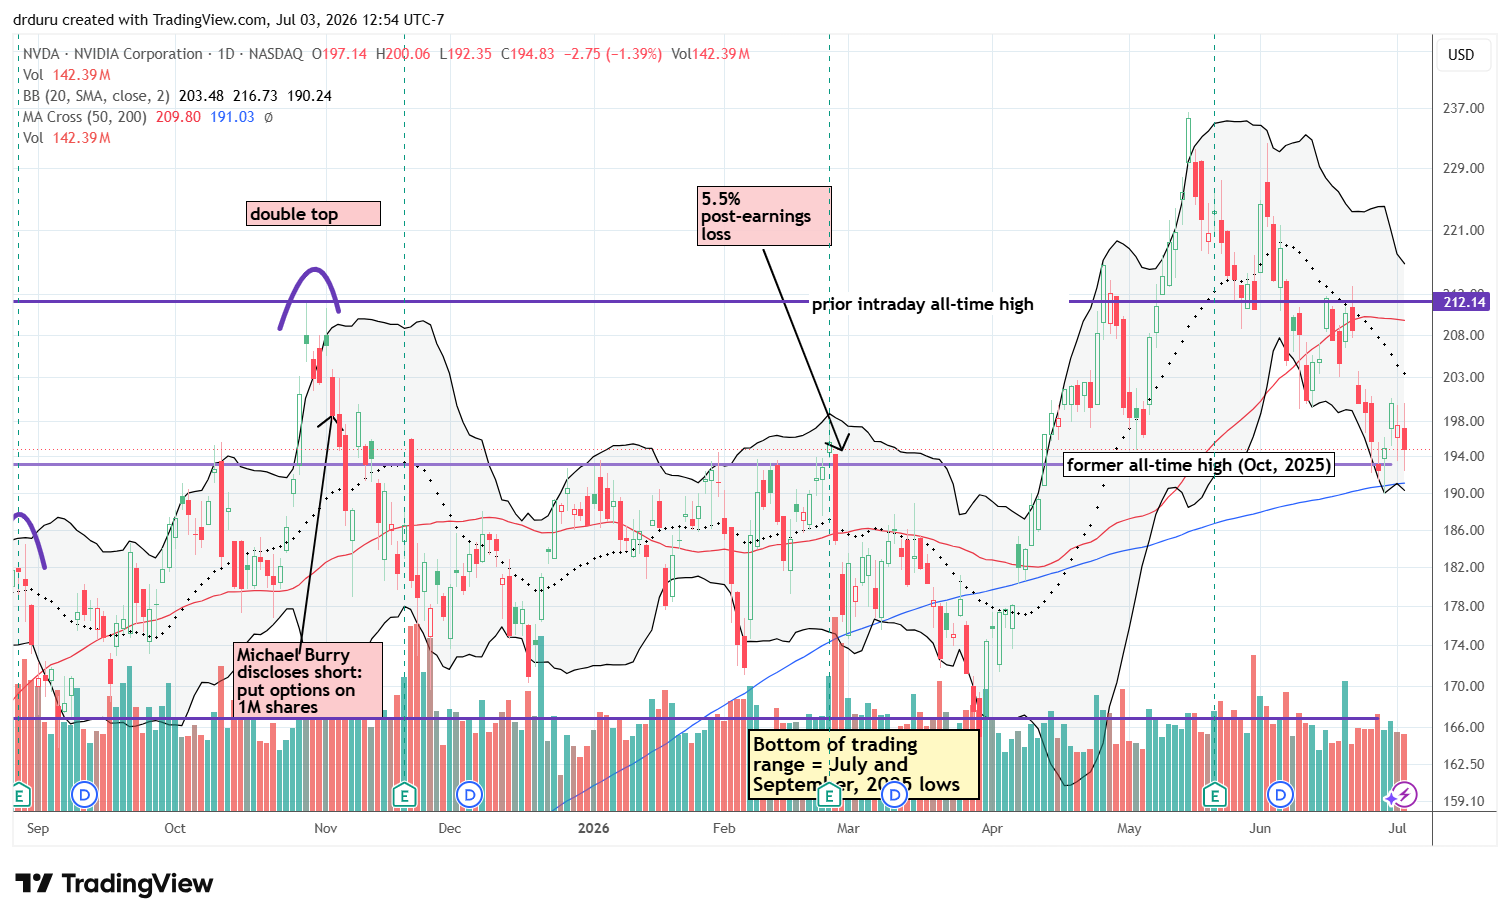
NVIDIA (NVDA)
Description: NVIDIA Corporation develops graphics processors, AI computing platforms, networking hardware, and software.
Technical status: NVIDIA (NVDA) held critical 200DMA support.
Trade commentary: NVDA looks ready to affirm 200DMA support, especially with the convergence with an all-time high from October 2025. However, the stock is stuck again in a trading range. NVDA may be settling into a trading range extending back to June 2025.
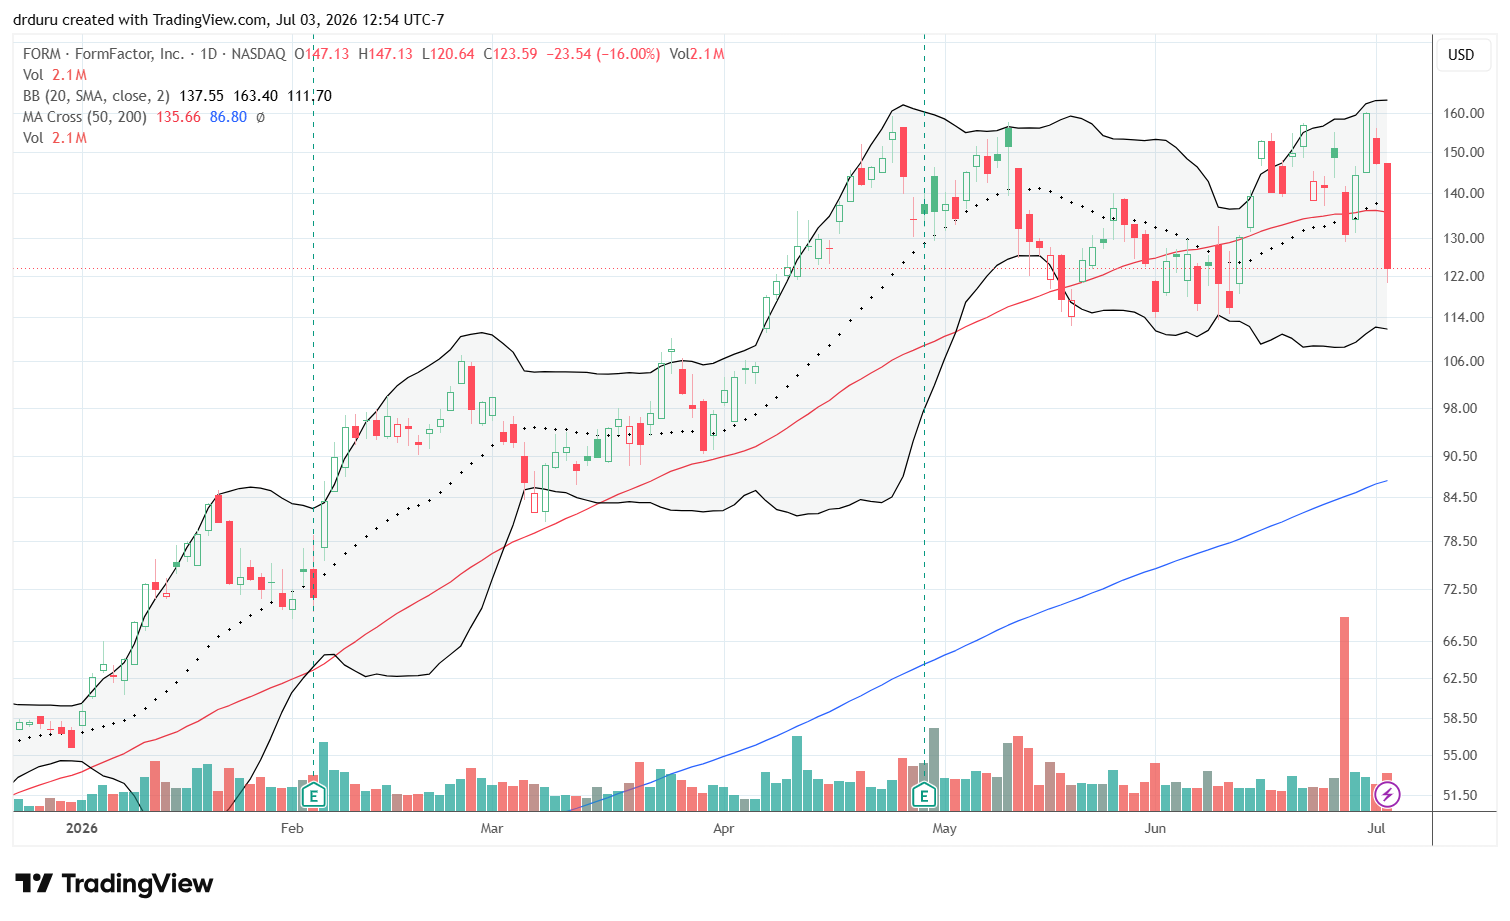
FormFactor (FORM)
Description: FormFactor, Inc. manufactures semiconductor testing and measurement equipment.
Technical status: FormFactor (FORM) plunged below its 50DMA after a 16% selloff and yet did not even test its low from June.
Trade commentary: FORM suffered one of the weakest performances in my semiconductor group, but I could not find any news to explain the outsized selling. A close below June’s low would make the stock bearish. Otherwise, I do not see a trade here beyond continuing to monitor as a potential indicator of the health of the semi trade.
iShares Expanded Tech-Software Sector ETF (IGV)
Description: The iShares Expanded Tech-Software Sector ETF tracks U.S. software companies.
Technical status: The iShares Expanded Tech-Software Sector ETF (IGV) broke out above its 50DMA but remained below 200DMA resistance.
Trade commentary: Software appears to be catching its breath after a difficult June. My expectations remain low until a 200DMA breakout. In the meantime, I took profits on two software trades I initiated after what looked like overextended selling.
")
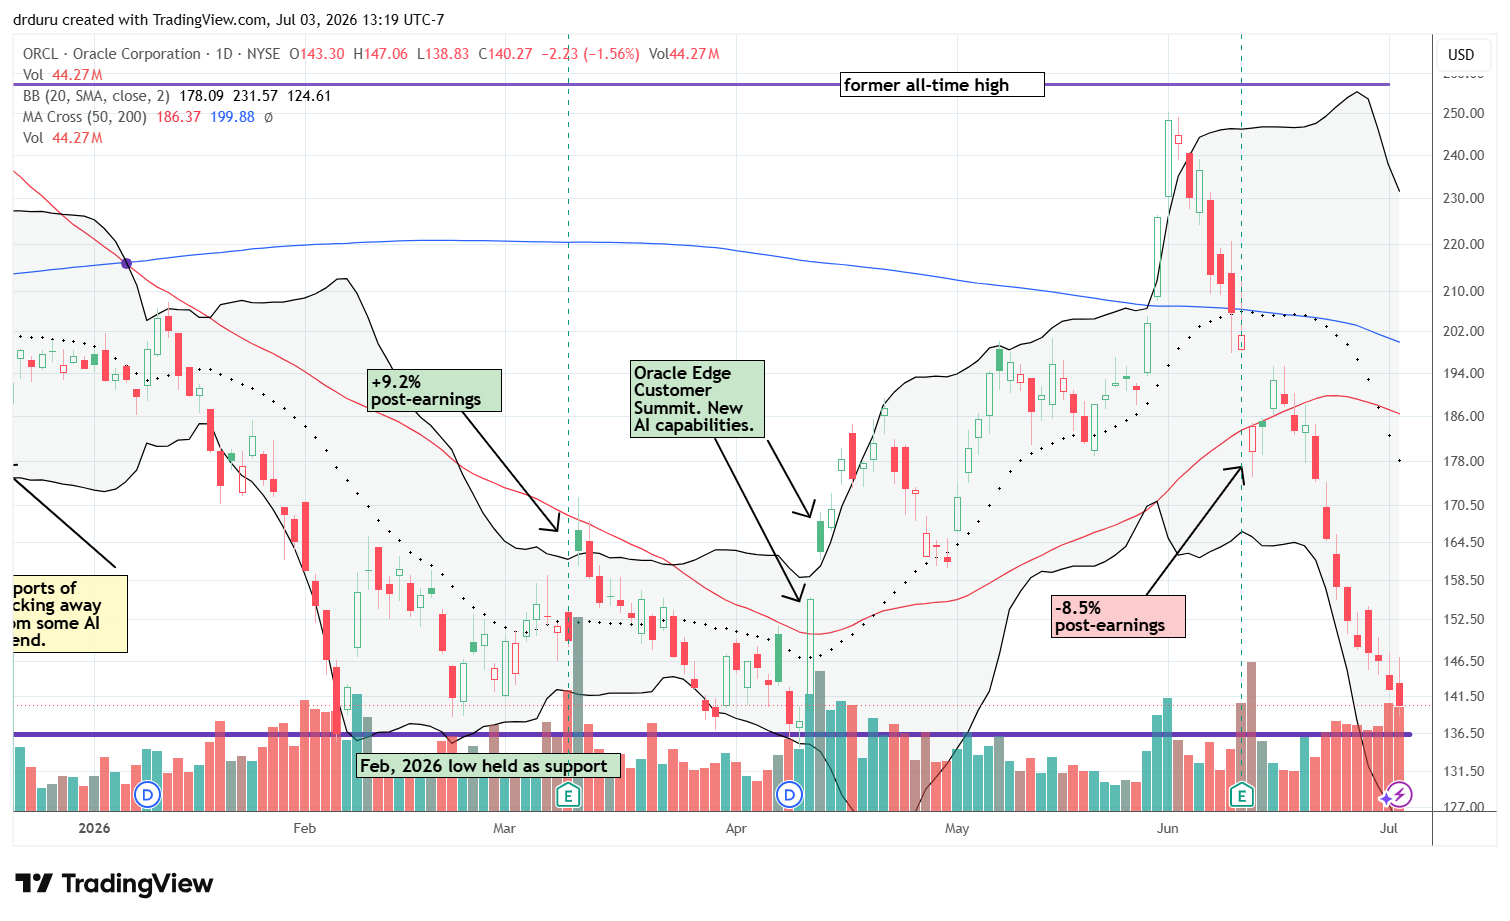
Oracle (ORCL)
Description: Oracle provides a complete suite of integrated cloud applications and a cloud infrastructure platform.
Technical status: Oracle (ORCL) continued selling toward major support with increasing downside volume.
Trade commentary: ORCL held its $135 bottom in picture-perfect form back in April. I took profits far too early when the stock soared during the Oracle Edge Customer Summit. ORCL’s collapse from software’s fateful June parabolic move has provided the next test of resolve. I have accumulated shares on the way down with the latest purchase on Thursday. This decline looks as precarious as February’s so I am bracing for a failure in support. Ultimately, I am anticipating a day when ORCL can sustain another rally.
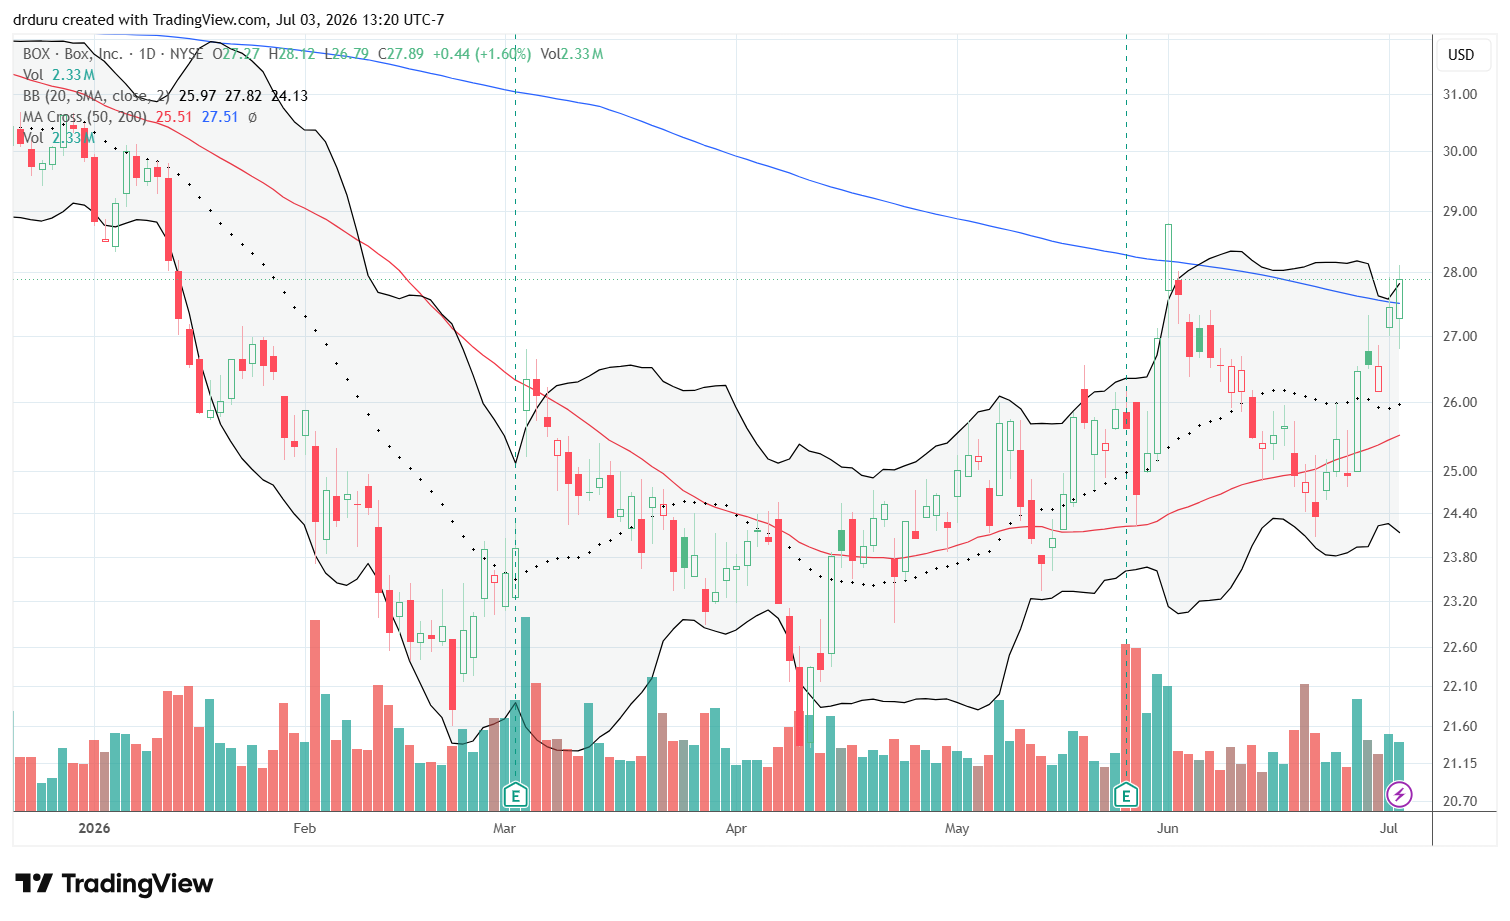
Box (BOX)
Description: Box, Inc. provides cloud-based content management and collaboration software.
Technical status: Box, Inc (BOX) broke out above its 200DMA after successfully defending its 50DMA and is near its June peak.
Trade commentary: BOX was the first software stock I bought in what later became my PAIROS framework. I have held my shares since January and even bit my lip as May’s gains melted into another test of 50DMA support. The stock ended last week with a fresh 200DMA breakout that makes BOX look like it will continue to be my leading position in PAIROS. I also bought a calendar call position in June that is now a long call option.
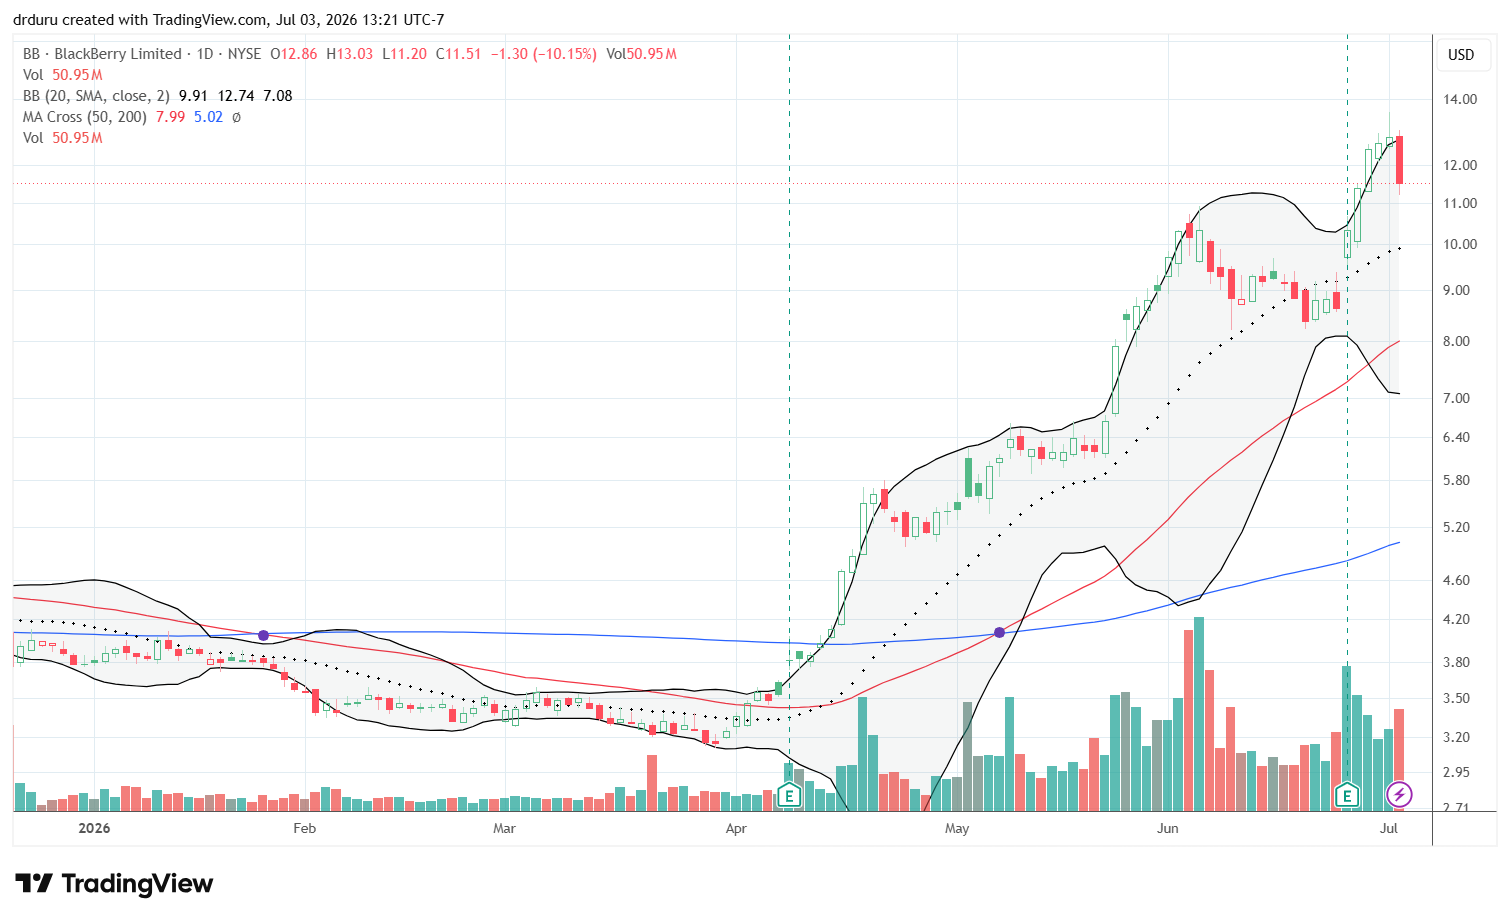
BlackBerry (BB)
Description: BlackBerry Limited provides cybersecurity software and Internet of Things solutions.
Technical status: BlackBerry (BB) surged 20.0% the day after earnings and remained in a fresh breakout despite Thursday’s 10.2% pullback.
Trade commentary: BB is a blast from the past and kudos to the company for making a successful pivot after losing out in the mobile phone/device race. While BB is more than 90% off its all-time high from 2008, the stock clearly offers periodic opportunities for profits like the near triple from April’s breakout. I put BB on my shopping list, but I only buy stocks like this after a successful test of key support; in this case I will patiently wait for a 50DMA test.
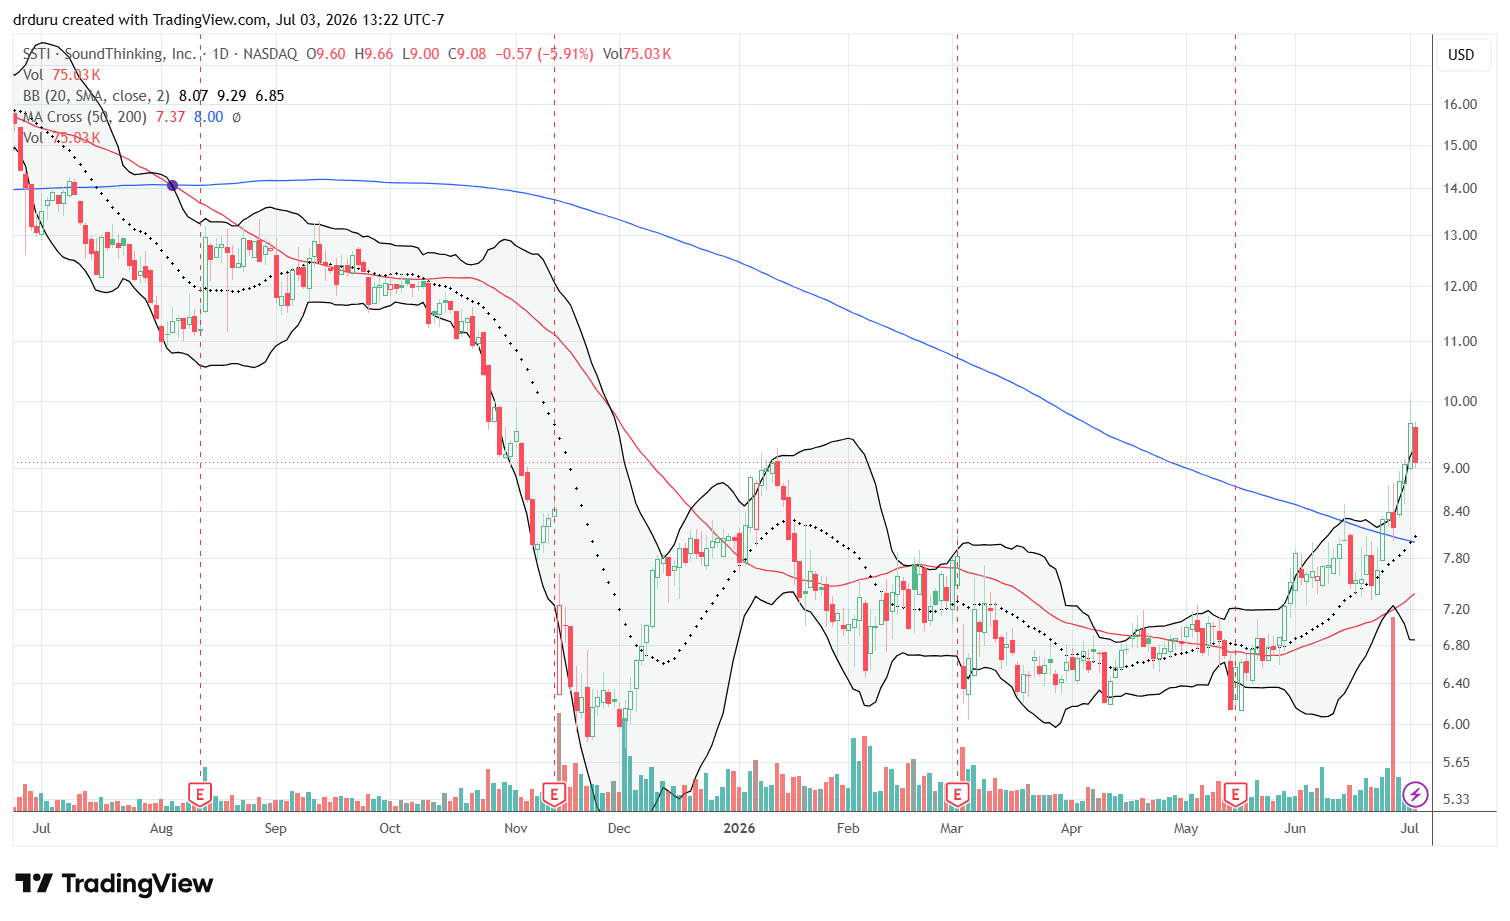
SoundThinking (SSTI)
Description: SoundThinking, Inc. develops public safety technology and data-driven crime prevention software.
Technical status: SoundThinking (SSTI) broke above its 200DMA for the first time in a year.
Trade commentary: SoundThinking rebranded itself from ShotSpotter to emphasize a broad set of solutions for public safety. The stock has struggled for years during this repositioning and portfolio buildout. Investors may finally be warming back up to the story. Last month’s 200DMA breakout continued into July with a new high creating a bearish to bullish reversal pattern. I started buying the stock in Thursday’s pullback. I will buy more down to a test of 200DMA support.
Nike (NKE)
Description: NIKE, Inc. designs, manufactures, and markets athletic footwear, apparel, equipment, and accessories.
Technical status: Nike Inc (NKE) rebounded from 12-year lows and completed a post-earnings bullish intraday reversal.
Trade commentary: I earlier planned to bail on my NKE position on a new low. When the stock fell 4% or 5% in the post-earnings after-hours session, I braced for more pain. However, someone must have called offsides before the market opened. NKE gapped up slightly and ended the day with a 4.9% post-earnings gain. The high buying volume makes the previous day’s high selling volume look like a washout. I am now anticipating a fresh bottom and an eventual, and long overdue, bearish to bullish reversal on a trade above $48.
")
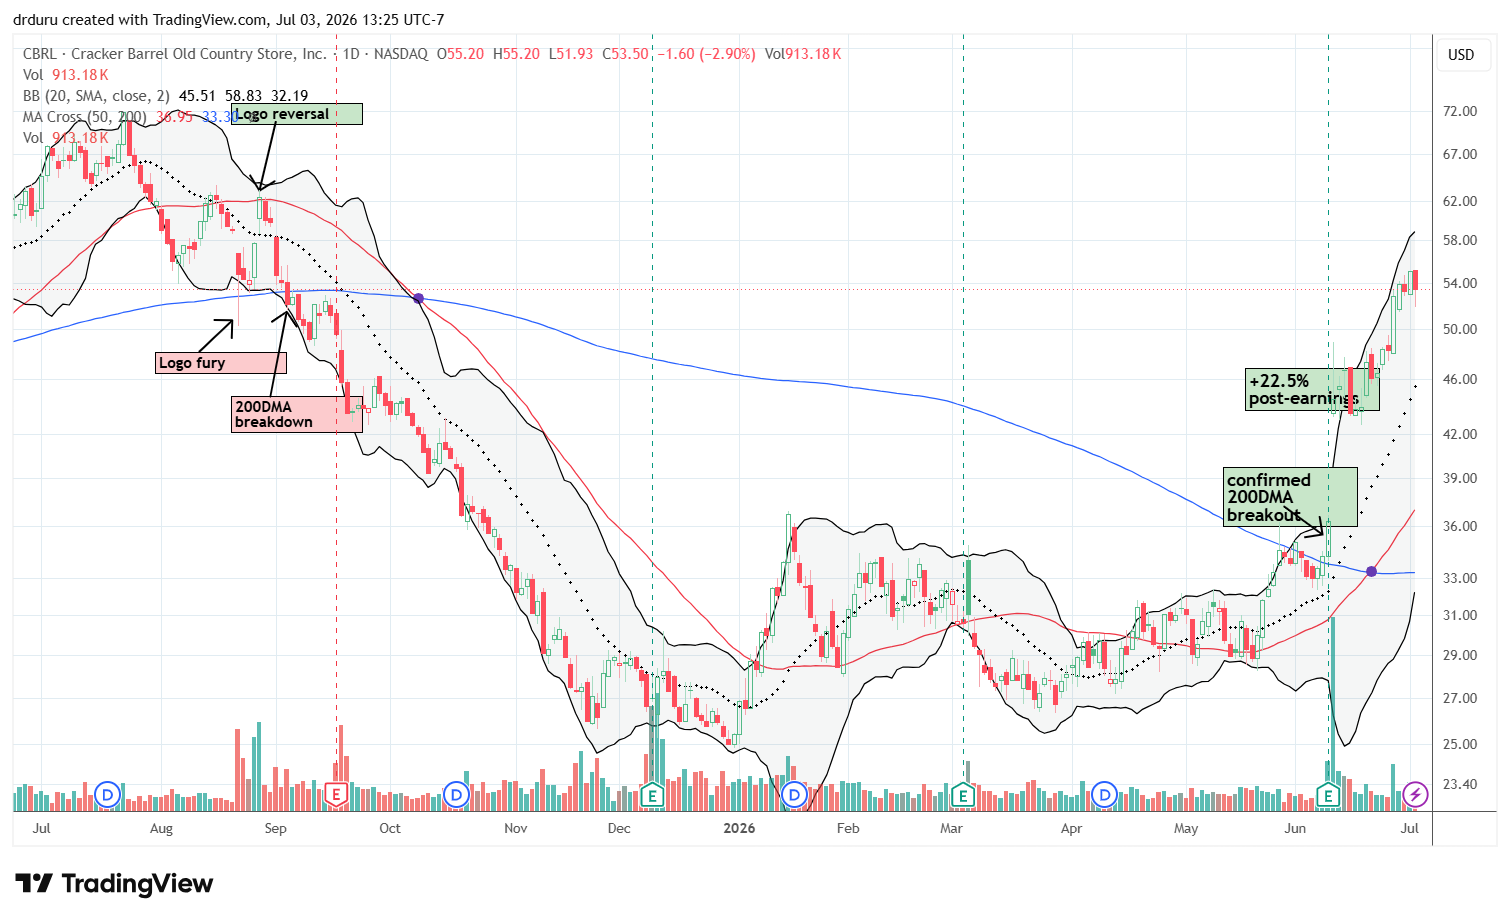
Cracker Barrel Old Country Store (CBRL)
Description: Cracker Barrel Old Country Store, Inc. operates restaurant and retail locations throughout the United States.
Technical status: Cracker Barrel Old Country Store, Inc (CBRL) continued its post-earnings advance.
Trade commentary: My no-regret purchase has worked well as the post-earnings momentum continued. CBRL now faces a critical test with the stock back to where it broke down below 200DMA support under pressure from a controversial change in the store logo.
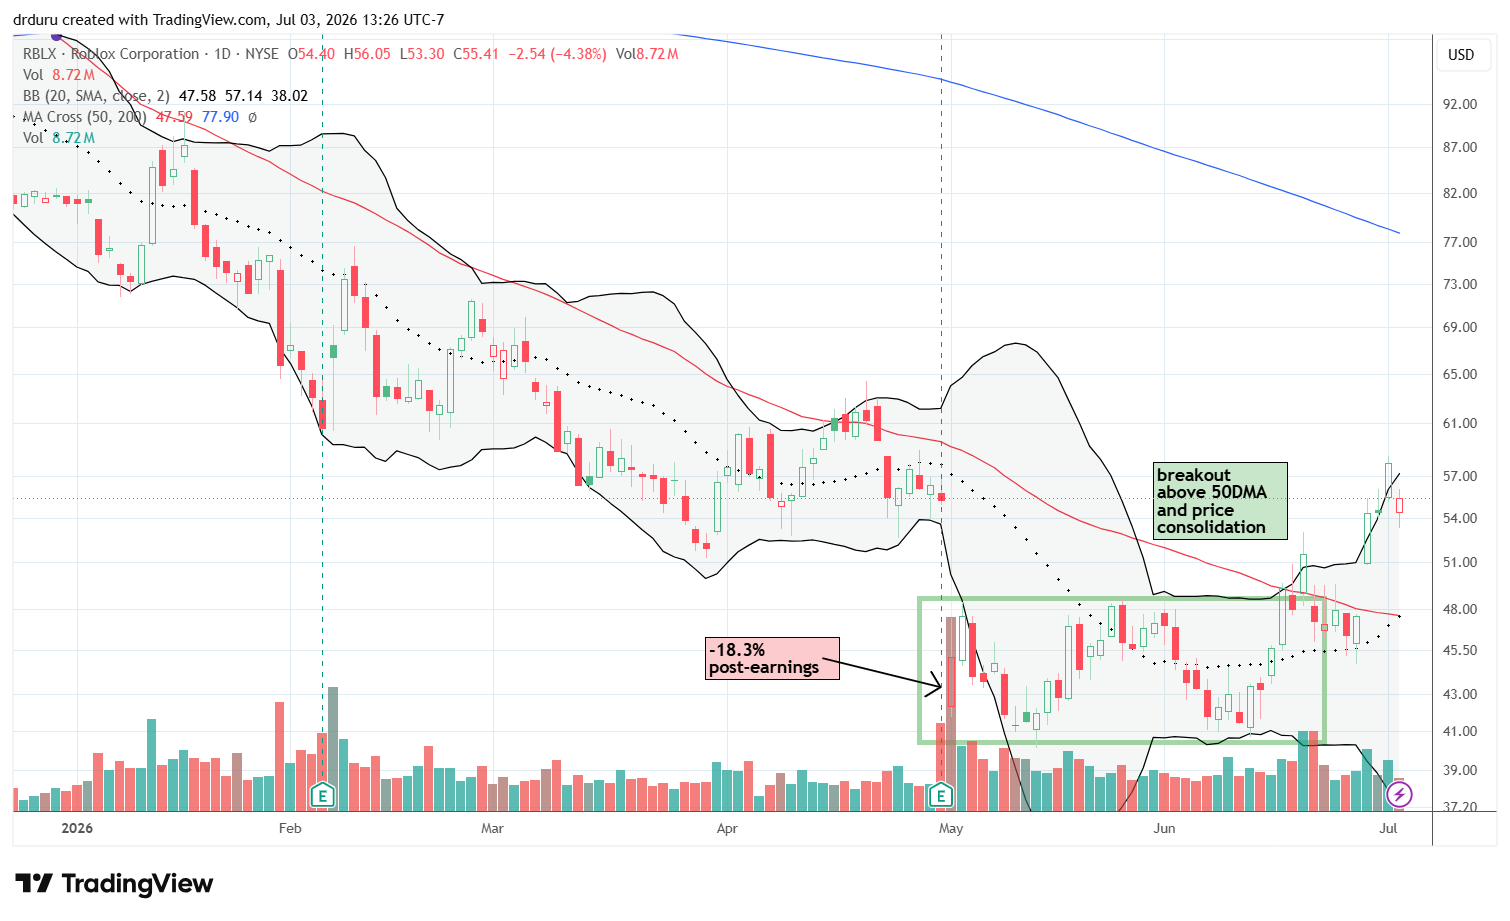
Roblox (RBLX)
Description: Roblox Corporation operates an online platform for immersive digital experiences and games.
Technical status: Roblox Corporation (RBLX) broke above its 50DMA but needed a second breakout to sustain momentum.
Trade commentary: The case I made for a bottom in RBLX is working out after a brief stumble into 20DMA support. I plan to add more shares in the coming week.
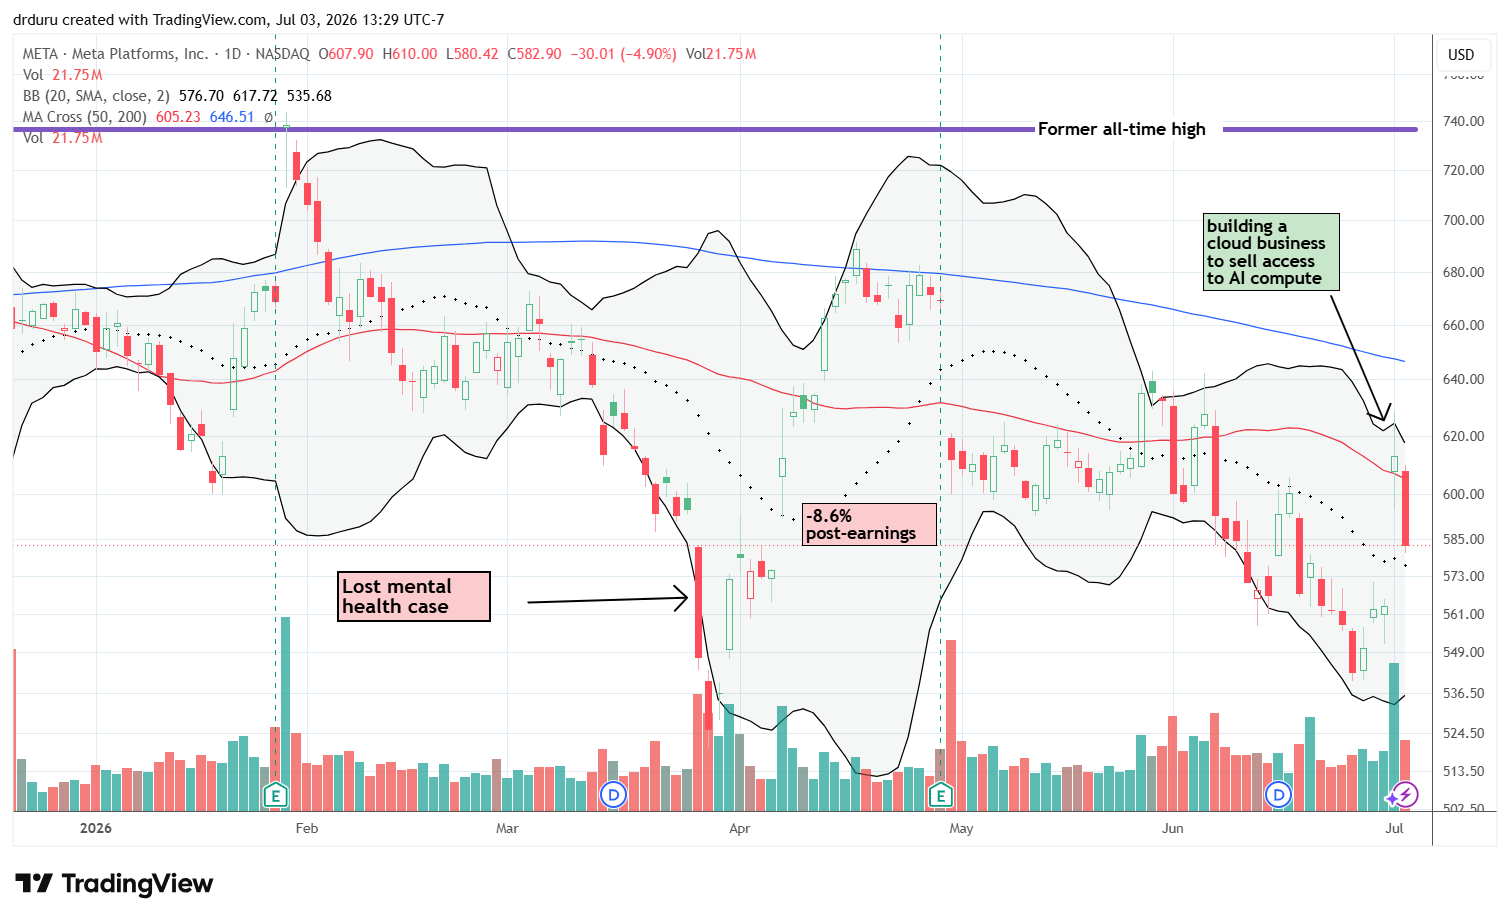
Meta Platforms, Inc (META)
Description: Meta Platforms develops social media platforms, messaging applications, and AI technologies.
Technical status: Meta Platforms, Inc (META) quickly fell from a 50DMA breakout in response to news about moving into AI compute services.
Trade commentary: META faked out buyers one more time. The stock soared 8.8% to a 50DMA breakout on excitement over the company’s move into providing AI compute. The stock promptly fell 4.9% the next day. META will have to prove how this move is a net positive. I interpret the change in AI business model as an admission that the company has overbuilt its AI infrastructure and/or its own AI models cannot get to competitive status alongside OpenAI, Anthropic, and others. The reversal in META is part of the larger rolling over I am noticing in AI-related trades. Prof G Markets discussed below whether META’s decision indicates larger problems in the META ecosystem. I am waiting to see more stocks roll over. META has now gone nowhere for nearly two years.
Apple (AAPL)
Description: Apple Inc. designs and sells smartphones, personal computers, tablets, wearables, and related services.
Technical status: Apple Inc (AAPL) completed a powerful bullish reversal from a panic about Apple price increases. A 4.8% surge brought the stock near all-time highs.
Trade commentary: AAPL plunged 6.1% on news of price increases for iPads and MacBooks driven by soaring memory costs. For one day, we were reminded that the stellar fortunes of one company or an entire industry can come at the expense of other companies or sectors. However, AAPL turned around right away. The next day the stock rebounded 3.1% and by the end of last week AAPL closed just under its all-time high. This incredibly sharp change in market sentiment and daily changes in market cap by hundreds of billions of dollars is quite astonishing. The move was so fast I never thought about conditions for buying. For example, once AAPL traded past the intraday high on Wednesday, the stock confirmed a 50DMA breakout. Still, I would not have contemplated a 4.8% gain on the day! Now I wait for a pullback to presumed support around $302.50 and the previous peak.
")
Tesla (TSLA)
Description: Tesla, Inc. designs, manufactures, and sells electric vehicles, battery storage systems, and energy products.
Technical status: After reporting its latest delivery numbers, Tesla Inc (TSLA) sharply reversed 7.5% turning a bullish breakout into fresh breakdowns below all three of its major moving averages.
Trade commentary: The market reacted quite negatively to Tesla’s production report for June. The headlines provided no clues with Tesla delivering almost 20% above “consensus” expectations of 406K vehicles. I could not find any concrete news to explain a negative interpretation of this report. The plunge particularly surprised me given my assumption that investors and traders stopped caring about the car production business as they wait for robotaxis in every city and Optimus robots in every home.
I have a standing position in TSLQ, but the depth of the selling motivated me to play for a relief bounce. I bought a $420 weekly calendar call spread.
")
Footnotes
Subscribe for free to get email notifications of future posts!
“Above the 50” (AT50) uses the percentage of stocks trading above their respective 50-day moving averages (DMAs) to measure breadth in the stock market. Breadth defines the distribution of participation in a rally or sell-off. As a result, AT50 identifies extremes in market sentiment that are likely to reverse. Above the 50 is my alternative name for “MMFI” which is a symbol TradingView.com and other chart vendors use for this breadth indicator. Learn more about AT50 on my Market Breadth Resource Page. AT200, or MMTH, measures the percentage of stocks trading above their respective 200DMAs.
Active AT50 (MMFI) periods: Day #237 over 20%, Day #64 over 30%, Day #60 over 40%, Day #15 over 50% (overperiod), Day #37 under 60%, Day #210 under 75%
Source for charts unless otherwise noted: TradingView.com
Full disclosure: long NVDA call spread, long FSLR, long COST, long WMT, long ORCL, long BOX shares and call option, long SSTI, long NKE, long CBRL, long RBLX, long TSLA calendar call spread, long TSLQ
FOLLOW Dr. Duru’s commentary on financial markets via StockTwits, BlueSky, and even Instagram!
*Charting notes: Stock prices are not adjusted for dividends. Candlestick charts use hollow bodies: open candles indicate a close higher than the open, filled candles indicate an open higher than the close.
* Blog notes: this blog was partially written based on the heavily edited transcript of the following video that includes a live review of the stock charts featured in this post. I used ChatGPT to process the transcript.