

The Market Breadth Summary
- No place to hide defines a market environment in which war-related uncertainty, higher oil prices, and disrupted trade flows pressure equities across sectors and styles.
- Market breadth weakened sharply toward oversold territory with the majority of stocks now trading below their critical long-term 200-day moving averages.
- The S&P 500 confirmed a breakdown below its 200-day moving average, while the NASDAQ reached a six-month low and small caps lost relative resilience.
- Elevated volatility and persistent downside pressure keep risk management at the center of the market outlook, even if a short-term rebound develops.
- Defensive assets and traditional havens failed to provide consistent shelter as gold, silver, Treasuries, and health care equities also came under pressure.
Stock Market Commentary
A week ago, I claimed that the stock market was all about oil. Now the stock market is all about war. Oil prices are up because of the war by the U.S. and Israel against Iran. An even larger issue is the cascade of impacts from an escalating conflict. Oil is not flowing through the Strait of Hormuz. Fertilizers and other products needed for the global economy are stuck as well. Infrastructure, including civilian infrastructure, is being destroyed, damaged, and targeted. The range of possible outcomes keeps widening, and the market is stepping out of the way of that uncertainty. As a result, market breadth is declining toward oversold levels. This deterioration signals that the market offers no place to hide from risk and volatility. Not even Chair Jerome Powell offered reassuring words during the Federal Reserve’s latest statement on monetary policy.
Temptations can run high in times like these to increase news consumption, chase all the war commentary from various experts, and then conclude it is possible to analyze and predict outcomes. I am specifically avoiding such temptations. For the stock market, I am sticking to the technicals along with a deep deference to a wide band of uncertainty. Risk management is paramount right now.
The stock market approached oversold levels into Friday’s close. Reassurance followed as news emerged that the U.S. is not considering ground troops for Iran. The instant rally that ensued lasted throughout the after hours period and reversed all of Friday’s loss. If this rebound holds Monday, then I will assume the stock market got “close enough” to oversold for me to flip bullish. Even so, as long as the war continues to escalate, the stock market will be at ongoing risk for sinking back into oversold trading conditions.
The Stock Market Indices
S&P 500 (SPY)
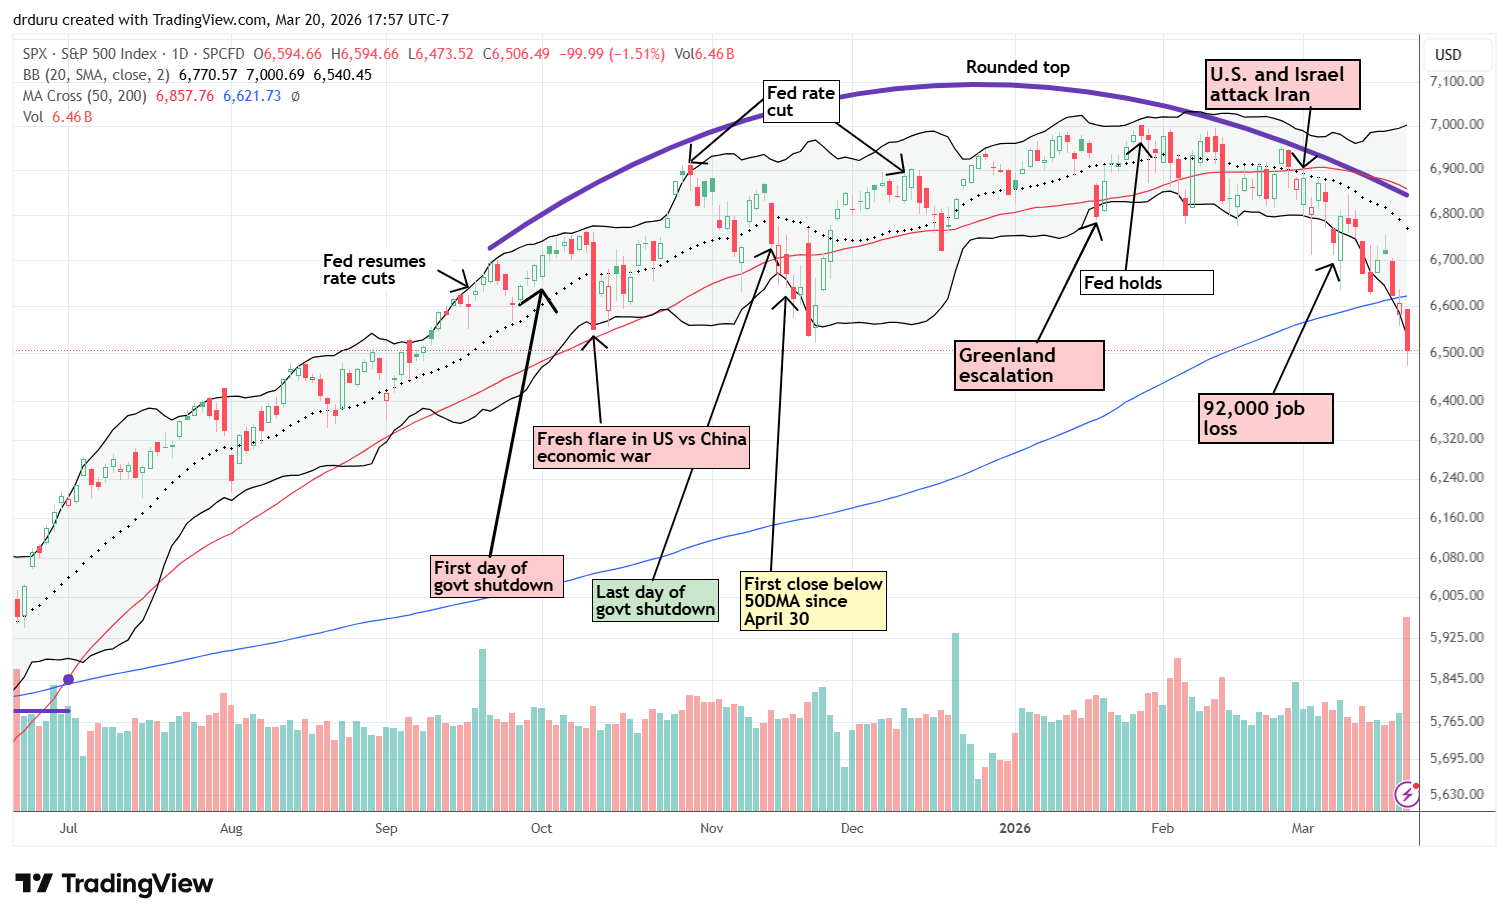
The S&P 500 accelerated its decline as oil pressure weighed on markets. The week started out hopefully with two consecutive gains. However, Jerome Powell helped to bring the rebound to a screeching halt. The index fell 1.4% and closed right at support at its 200-day moving average (DMA) (the blue line); the S&P 500 last traded below its 200DMA last May. In past selling episodes, buyers automatically stepped into such obvious technical setups. Not this time. The index broke down the very next day. Escalating war took the S&P 500 below its lower Bollinger Band on Friday’s 1.5% loss. This confirmed 200DMA breakdown puts the S&P 500 in bear market territory and also confirmed the rounded top (purple line below). As a reminder, I do not wait for a 20% loss from the all-time high to define a bear market for the major indices; a confirmed 200DMA breakdown is sufficient.
NASDAQ (COMPQ)
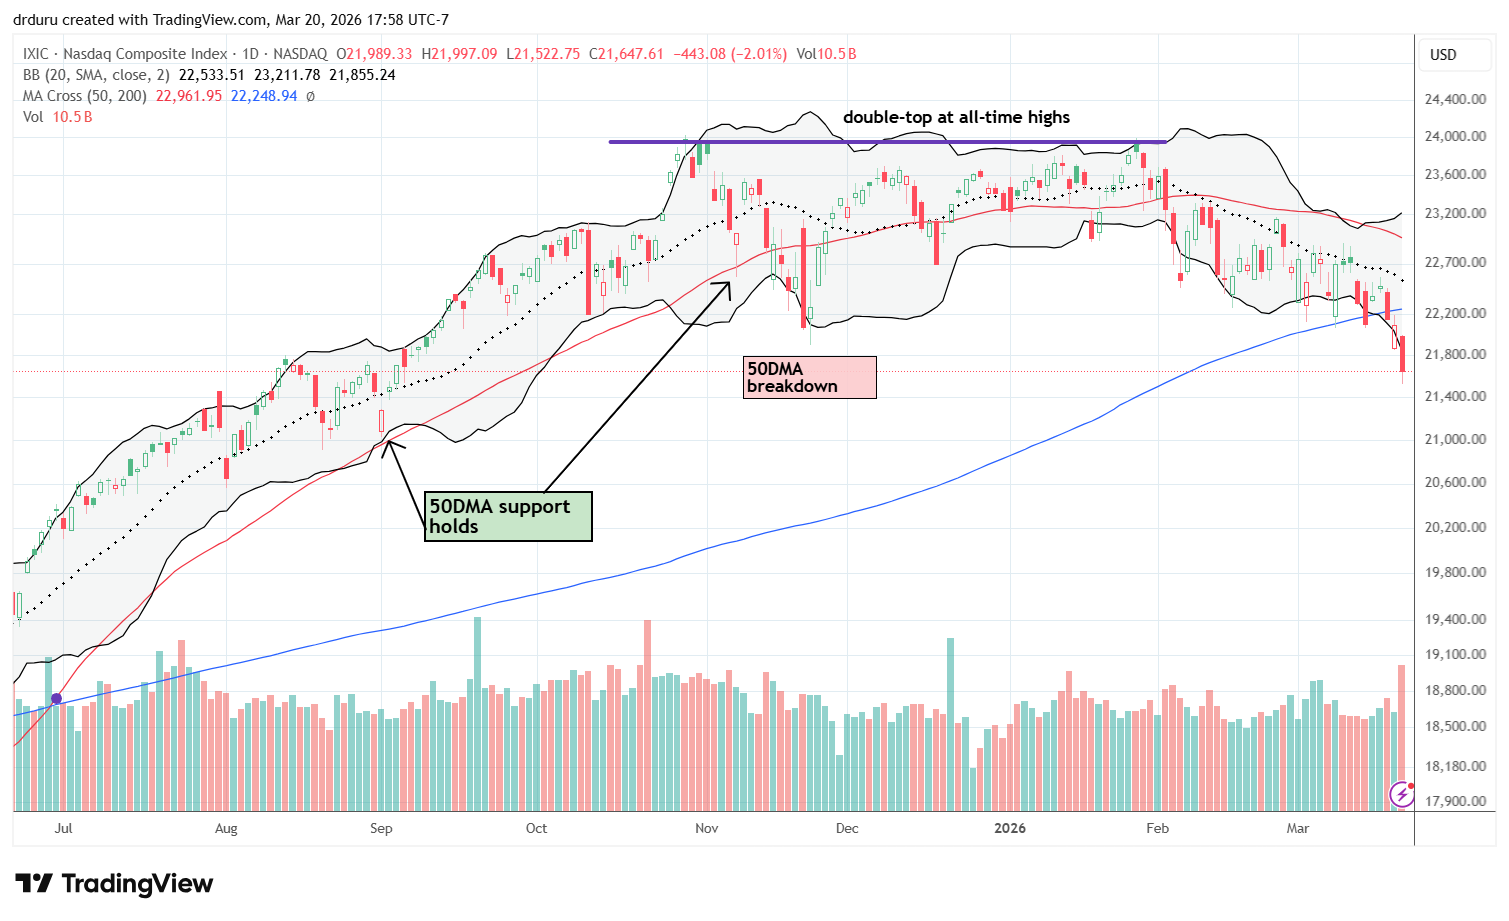
I had already been calling the NASDAQ bearish since its failure at 50DMA resistance (the red line) in February. Throughout March, the tech-laden index fought to hold 200DMA support but finally failed with last week’s accelerated selling. Friday’s 2.0% loss took the NASDAQ to a 6-month low. There is no place to hide in tech stocks.
iShares Russell 2000 ETF (IWM)
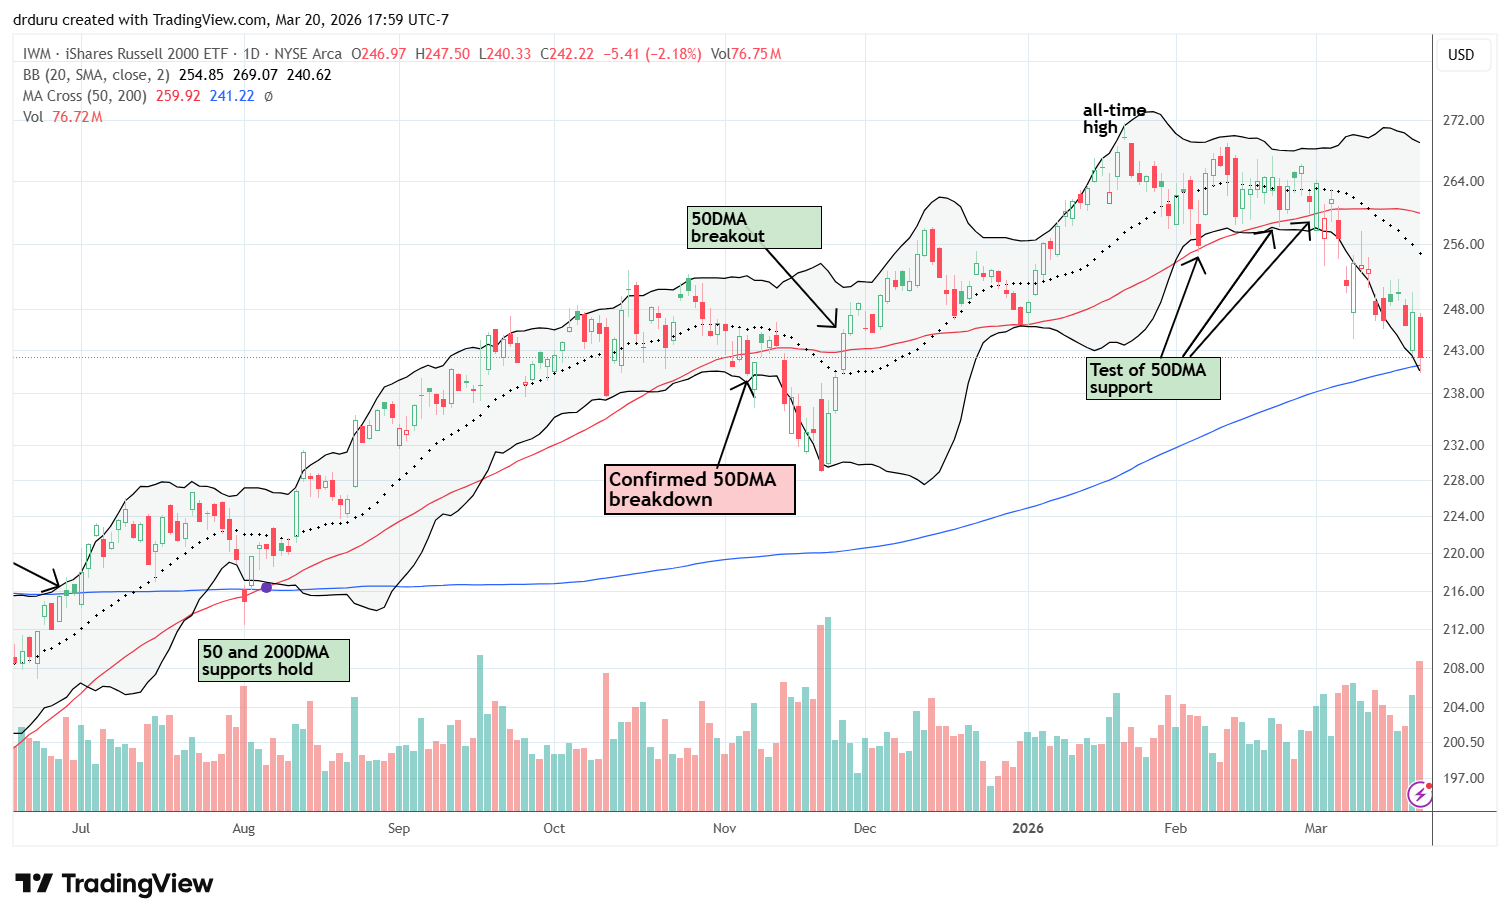
IWM is still outperforming on a relative basis, with Friday’s close a hair above 200DMA support. I got greedy and overconfident with my routine IWM call option trade after IWM outperformed on Thursday with a 0.7% gain and a rebound from a 4-month low. While IWM did not carve out a distinct topping pattern like the other two indices, the ETF of small caps printed its first lower low since the rally off the lows of last April’s tariff drama, trauma, and noise.
The Short-Term Trading Call With No Place to Hide
- AT50 (MMFI) = 22.4% of stocks are trading above their respective 50-day moving averages
- AT200 (MMTH) = 42.4% of stocks are trading above their respective 200-day moving averages
- Short-term Trading Call: neutral
AT50 (MMFI), the percentage of stocks trading above their respective 50DMAs, closed the week at 22.4%. The oversold threshold at 20% is just another day of selling away. As I suggested earlier, the short-term trading call stays neutral for now, but it will likely flip bullish on Monday. A sustained rebound that creates a full recovery from 200DMA breakdowns will justify a bullish with “close enough” oversold conditions creating a presumed bottom. Renewed selling on Monday could push AT50 below 20% and into oversold territory where the AT50 trading rules provide direct guidance.
A resumption of selling will extend the bear market in the indices. Given an escalating war further expands the downside possibilities for the stock market, I am braced for multiple trips to or through the oversold threshold.
")
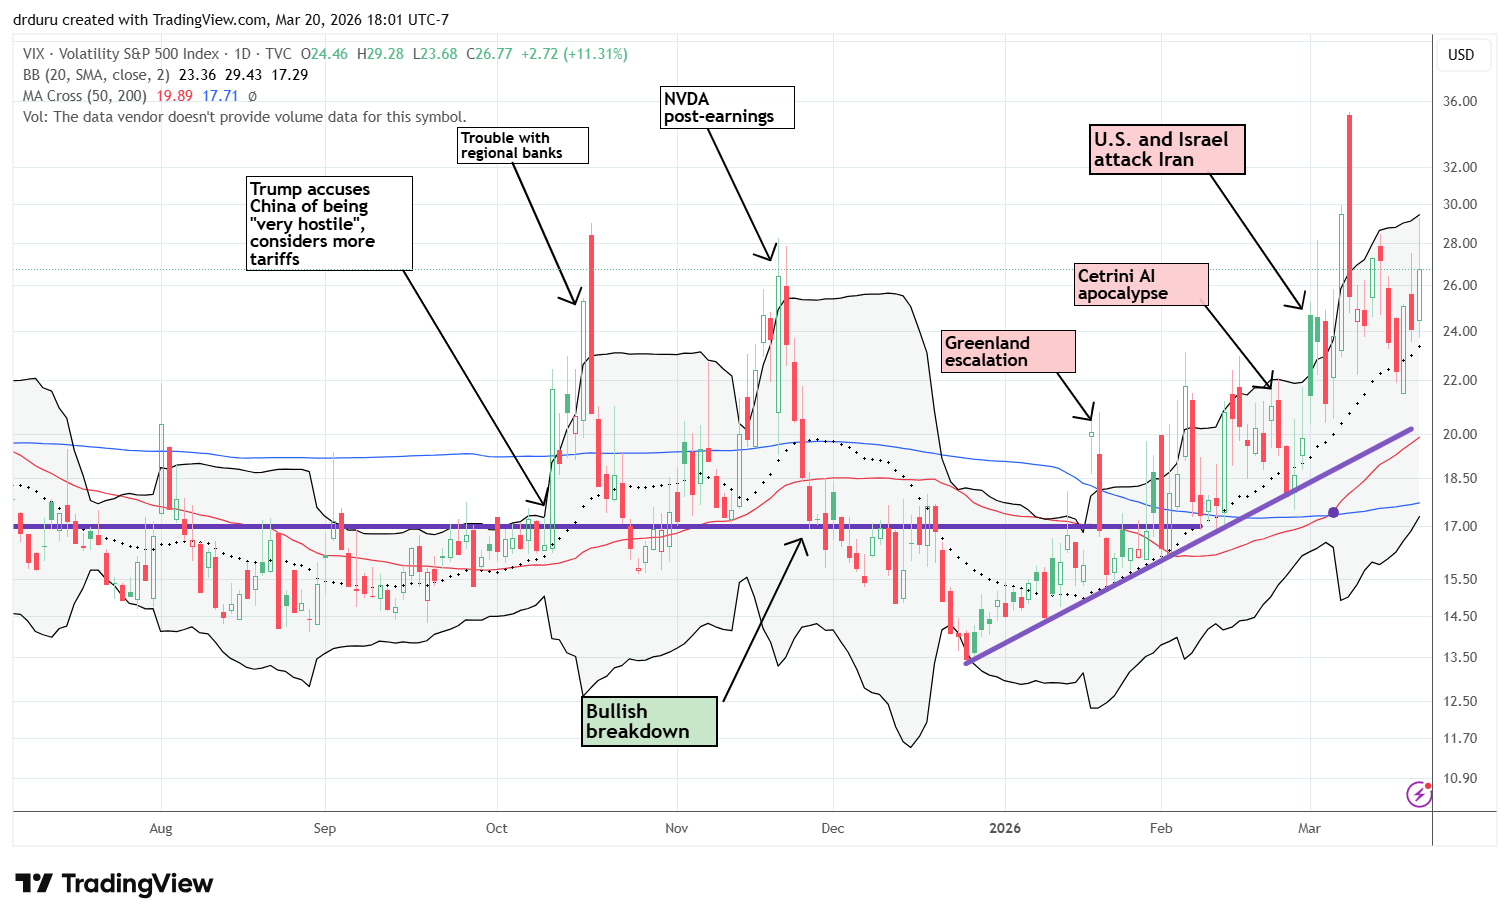
Per the AT50 trading rules, the volatility index (VIX) becomes a handy partner signal in the case of oversold conditions in a bear market. A bear market creates ongoing selling pressures including fades and false breakouts. As a result, the VIX remains elevated in a bear market. A large fade (like a blow-off top) signals a potential peak in the VIX and an imminent end to the selling pressure. Ironically, the VIX already suffered a sharp fade in the previous week. However, the ongoing resilience in the VIX has worked against a bottom. From here, I am looking for another sharp fade and/or a break of the current uptrend (the purple line below). Conveniently, the end of the uptrend would come with a value below 20, a threshold that represents elevated volatility.
AT200, the percentage of stocks trading above their respective 200DMAs, also shows there has been no place to hide. This indicator of longer-term health in market breadth has been stuck in a steep downtrend all month. The majority of stocks are now trading below their 200DMAs. This milestone means most stocks are in their own bear markets. The condition aligns with breakdowns for the S&P 500 and the NASDAQ.
")
In case you missed it…
The technicals came through for Bitcoin (BTC/USD) after a 50DMA breakout confirmed the bottom. At the time of writing, Bitcoin is testing its 50DMA as support. The next day the Federal Reserve disappointed markets with heightened policy uncertainty and the near erasure of any hope for a rate cut this year.
United States Oil Fund, LP (USO)
Description: United States Oil Fund, LP is an exchange-traded fund designed to track the daily price movements of light, sweet crude oil.
Technical status: United States Oil Fund (USO) skyrocketed throughout March, but has almost stabilized over the last 2 weeks.
Trade commentary: I am sure I do not need to tell anyone that oil prices remain elevated. As long as oil stays elevated, the stock market will suffer from high volatility. I now expect all my USO fades to fail.
")
SPDR Gold Shares (GLD)
Description: SPDR Gold Shares is a trust whose shares are intended to reflect the performance of the price of gold bullion, less the trust’s expenses.
Technical status: SPDR Gold Shares (GLD) crashed below its 50DMA, approaching its former all time high as support.
Trade commentary: The worst weekly sell-off in gold since 2011 (per CNBC’s Fast Money) emphasized trading conditions with no place to hide. The short-term is bearish with the confirmed 50DMA breakdown, but I still sold short a GLD April $400 put. I do not mind owning GLD below $400. Nothing has changed for the longer-term gold fundamentals.
After the war ends and rebuilding begins, the U.S. (and other governments) will incur even higher deficits and greater debt loads. Gold becomes an even more attractive hedge against fiscal largess. However, for now, highly leveraged players are getting squeezed out of precious metals (again, per CNBC); forced selling is a short-term disruption.
")
iShares Silver Trust (SLV)
Description: iShares Silver Trust seeks to reflect generally the performance of the price of silver.
Technical status: The iShares Silver Trust (SLV) broke down below its 50DMA before gold did, and last week gapped down well below its lower Bollinger Band to a 3-month low.
Trade commentary: Silver can be a safe-haven play, but it is more of a commodities play. On Thursday, I speculated on an SLV April call spread because it was well below its lower Bollinger Band. I was profitable by the close. However, Friday’s continued selling pushed my position into a loss. Note that SLV has more downside risk than GLD on further selling given the remaining distance to 200DMA support.
")
iShares 20+ Year Treasury Bond ETF (TLT)
Description: iShares 20+ Year Treasury Bond ETF seeks to track the investment results of an index composed of U.S. Treasury bonds with remaining maturities greater than twenty years.
Technical status: The iShares 20+ Year Treasury Bond ETF (TLT) confirmed both a 200DMA and 50DMA breakdown, taking a 1.9% dive on the last day of the week as inflation fears drive interest rates higher.
Trade commentary: I now buy TLT as a contrarian play. I started buying at 50/200DMA support before appreciating how seriously the bond market would take the latest inflation threat. The erasure of expectations for a rate cut this year have cascaded into higher bond yields which have in turn put pressure on gold and silver prices.
")
iShares U.S. Home Construction ETF (ITB)
Description: iShares U.S. Home Construction ETF seeks to track the investment results of an index composed of U.S. equities in the home construction sector.
Technical status: The iShares US Home Construction ETF (ITB) had a rough week thanks to rising interest rates, trading all the way back to prices from last June.
Trade commentary: ITB has had a rough 5 weeks of trading. The new bear market for ITB accelerated thanks to rising bond yields. The seasonal strength in ITB has turned into underperformance with the S&P 500. I even closed out my weakest homebuilder seasonal trade as part of my overall risk management.
")
Roundhill Magnificent Seven ETF (MAGS)
Description: Roundhill Magnificent Seven ETF offers equal-weight exposure to Alphabet, Amazon, Apple, Meta, Microsoft, Nvidia, and Tesla.
Technical status: Roundhill Magnificent Seven ETF (MAGS) broke down below its 200DMA, returning to where it traded last August.
Trade commentary: The NASDAQ is actually outperforming the MAG 7 (Magnificent 7) on a relative basis. MAGS entered its own bear market in February with multiple 200DMA breakdowns. Friday’s 2.0% loss confirms the accentuated weakness in a group of stocks that used to lead the market, especially against the drag from bearish and declining market breadth.
")
iShares Expanded Tech-Software Sector ETF (IGV)
Description: iShares Expanded Tech-Software Sector ETF seeks to track the investment results of an index composed of North American software companies along with select interactive media and services firms.
Technical status: The iShares Expanded Tech-Software Sector ETF (IGV) broke down below its 20DMA, nearing a complete reversal of March’s rebound gains.
Trade commentary: I am looking to buy back into IGV as my contrarian positioning against the SaaSpocalypse. I will remain patient with IGV closing below 20DMA support. Note that the declining 50DMA resistance looms as a stiff near-term ceiling on the price action.
")
Spotify Technology (SPOT)
Description: Spotify is an audio streaming platform that offers music, podcasts, and audiobooks to users across global markets.
Technical status: Spotify Technology (SPOT) broke down below its 50DMA and 20DMA, approaching its February low as market pressures weighed.
Trade commentary: If I had noticed SPOT on Thursday, I would have shorted the stock. The clean slice through 50DMA support was signature exhaustion from an otherwise impressive post-earnings breakout (now a fake-out). A short SPOT position would have worked much better than most of the other short plays I picked to ride until oversold trading conditions.
")
Applied Optoelectronics (AAOI)
Description: Applied Optoelectronics provides semiconductors, laser components, optical transceivers, and HFC networking products for telecom, FTTH, sensing, datacenter, wireless, and cable access markets.
Technical status: Applied Optoelectronics Inc (AAOI) fell away from its all-time highs. Its 20DMA breakdown puts a 56.9% post-earnings surge in danger.
Trade commentary: AAOI presented perfect technical setup last week. I waited for a good risk/reward entry that never came. Friday’s 14.1% reversal confirmed increasing selling pressure in the stock market; the strongest stocks are now showing signs of profit-taking. The close below 20DMA support took the stock off my buy list for now. I would reconsider at a test of 50DMA support.
")
Dell Technologies (DELL)
Description: Dell Technologies provides computers, servers, storage, monitors, accessories, and related technology solutions, services, and support.
Technical status: Dell Technologies Inc (DELL) continued to rise after it surged by 21.9% post-earnings. Another week of outperformance ended ominously with a sharp fade from an intraday all-time high.
Trade commentary: DELL outperformed last week especially with a 5.1% rebound on Thursday that created a bullish engulfing technical setup. Friday’s sharp fade from an intraday all-time high signals possible exhaustion. The move follows a strong AI-driven run since the 21.9% post-earnings surge.
")
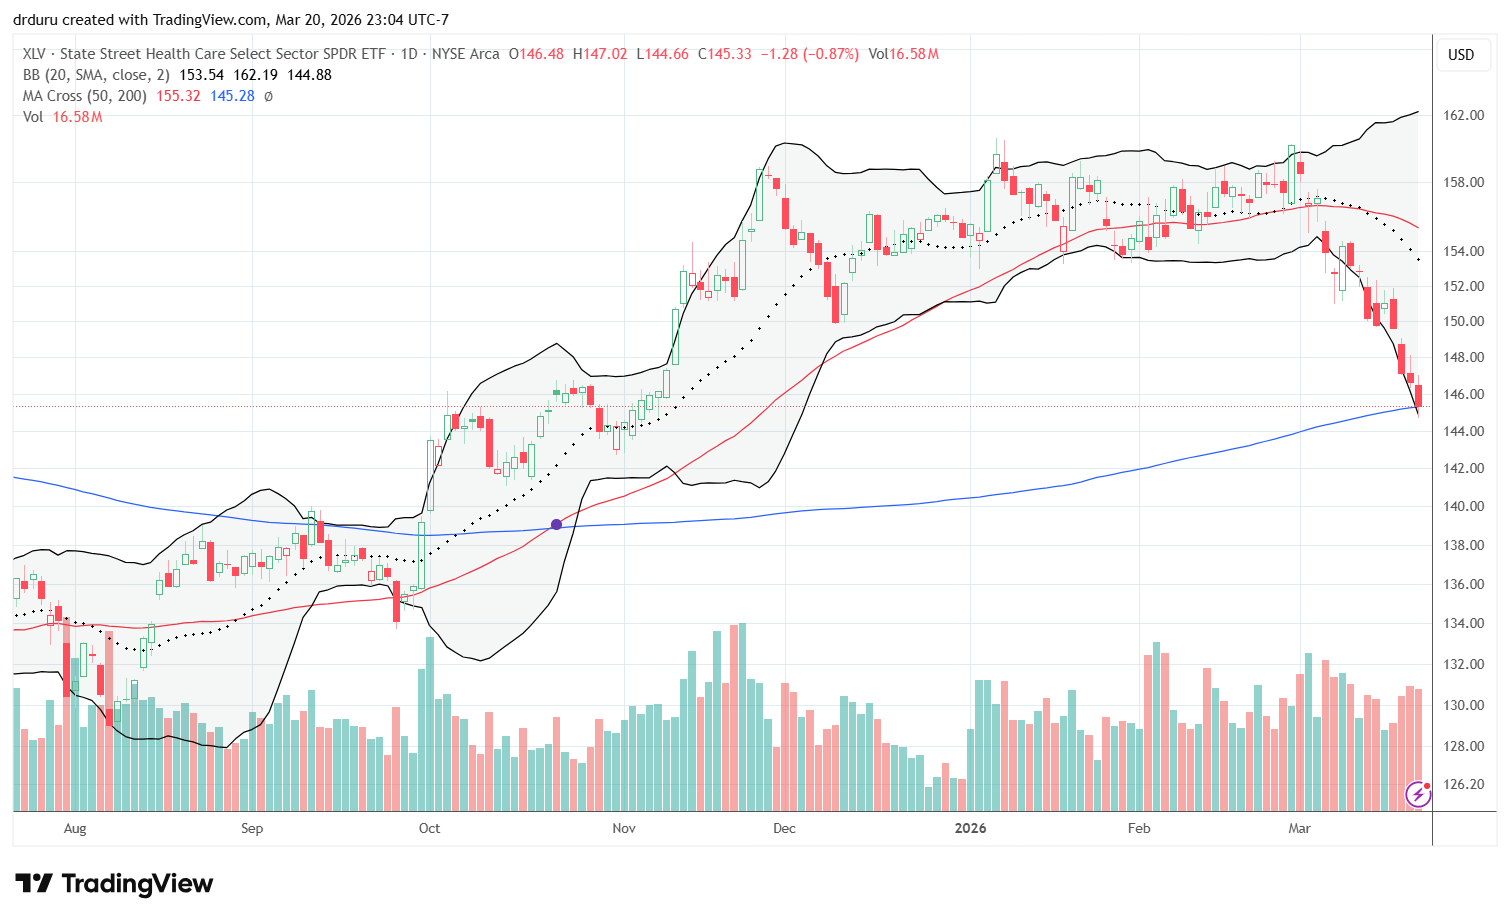
State Street Health Care Select Sector SPDR ETF (XLV)
Description: State Street Health Care Select Sector SPDR ETF (XLV) is an exchange-traded fund that seeks to track the performance of the health care sector of the S&P 500, including pharmaceuticals, biotechnology, health care equipment, and providers.
Technical status: Since a 2% gap down and 50DMA breakdown in early March, the State Street Health Care Select Sector SPDR ETF (XLV) has offered no place to hide. Now XLV faces a critical test of 200DMA support.
Trade commentary: There is no place to hide when traditional defensive sectors like health care sell off nearly every day. Still, I will add to my position if XLV rebounds off 200DMA support. A 200DMA breakdown will increase my wariness about oversold trading conditions.
Be careful out there!
Footnotes
Subscribe for free to get email notifications of future posts!
“Above the 50” (AT50) uses the percentage of stocks trading above their respective 50-day moving averages (DMAs) to measure breadth in the stock market. Breadth defines the distribution of participation in a rally or sell-off. As a result, AT50 identifies extremes in market sentiment that are likely to reverse. Above the 50 is my alternative name for “MMFI” which is a symbol TradingView.com and other chart vendors use for this breadth indicator. Learn more about AT50 on my Market Breadth Resource Page. AT200, or MMTH, measures the percentage of stocks trading above their respective 200DMAs.
Active AT50 (MMFI) periods: Day #170 over 20%, Day #3 under 30% (underperiod), Day #6 under 40% (underperiod), Day #9 under 50%, Day #17 under 60%, Day #143 under 70%
Source for charts unless otherwise noted: TradingView.com
Full disclosure: long IWM shares and calls, long IBIT, long BTC/USD, long GLD, long SLV call spread, long TLT, long ITB, long XLV
FOLLOW Dr. Duru’s commentary on financial markets via StockTwits, BlueSky, and even Instagram!
*Charting notes: Stock prices are not adjusted for dividends. Candlestick charts use hollow bodies: open candles indicate a close higher than the open, filled candles indicate an open higher than the close.
* Blog notes: this blog was partially written based on the heavily edited transcript of the following video that includes a live review of the stock charts featured in this post. I used ChatGPT to process the transcript.