

The Market Breadth Summary
- Market breadth shows key signs of a developing bottom with higher highs and higher lows.
- Equity indices recovered from sharp declines, signaling improving sentiment despite persistent macro uncertainty and ongoing large increases in the price of oil.
- The major indices tested resistance at key moving averages, with a confirmed breakout needed to validate a sustainable bottom.
- Small-cap bullishness reinforces key signs of broader market stabilization.
- Volatility faded sharply but remains in an uptrend, suggesting cautious optimism rather than full confirmation.
- Sector-level behavior, including financials and semiconductors, contributed additional key signs of potential market recovery.
Stock Market Commentary
After five straight down weeks, the stock market finally enjoyed an up week. The move looked strong enough to flash key signs of a bottom in the making. The last day of trading for the holiday shortened week was particularly telling. The stock market gapped lower at the open in a negative reaction to the President’s update on the war against Iran. A rebound took flight after reports that Iran was working with Oman to open the Strait of Hormuz. The market rallied without waiting for details on which countries would qualify for passage through this economic chokepoint. Even as oil held its large price gain for the day, stocks rallied from deep losses to achieve small gains for the day.
Market breadth is also becoming the market’s friend. Higher lows and higher highs in market breadth support a case for a bottom in the stock market.
Still, the war continues to provide plenty of opportunity for setbacks. Every day offers declarations, claims, threats, destruction, tragedy, and ongoing news flashes. Thus, predictions are about as futile as ever, making the market’s reactions to the news more important than ever. What I observe now is a market that thinks it has absorbed the worst of the news. As long as the market acts as though fear is exhausting itself, then a bottom should hold….all else equal.
The Stock Market Indices
S&P 500 (SPY)
Key signs of a bottom appeared in the S&P 500 (SPY). Thursday’s rebound from a gap down open is impressive by itself. The recovery is even more convincing given it followed a 2.9% surge on Tuesday that started with a gap well above the previous day’s close at a near 8-month low. Combined, these moves look like a significant vote of confidence in a bottom.
However, the work for buyers is far from over. The S&P 500 stalled for two straight days at resistance from its 20-day moving average (DMA) (the dotted line). Resistance from its 200DMA (blue line) looms overhead as well. Two higher closes above 200DMA resistance would confirm a bottom for this cycle.
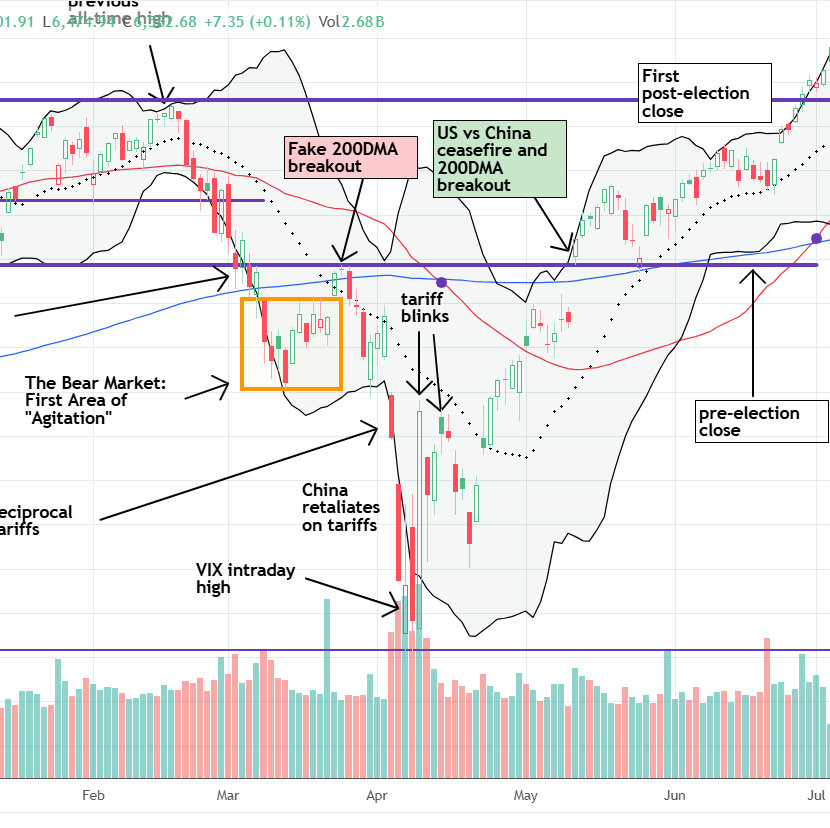
Note well that last year’s tariff drama provided a reality check and an affirmation on the significance of 200DMA breakouts. On March 24, I declared an end to the S&P 500’s bear market after the index closed a second higher day above its 200DMA. Worse news on tariffs dragged the index right back down. See the second chart below for a reminder. The S&P 500 took two more months to achieve a fresh 200DMA breakout; the index soon retested its 200DMA as support but never looked back from there.
")
NASDAQ (COMPQ)
The NASDAQ was not quite as impressive as the S&P 500. After accelerating to the downside for most of March, the NASDAQ accompanied the S&P 500 higher last week. The tech-laden index fully recovered from Thursday’s big gap down and even finished the day up 0.2%. Still, just like the S&P 500, the downtrending 20DMA held as resistance. The NASDAQ’s 200DMA is quickly converging with its 50DMA to offer even stiffer resistance.
")
iShares Russell 2000 ETF (IWM)
IWM is the most positive of the indices. The ETF of small caps defended its 200DMA support, albeit sloppily. IWM sliced through 200DMA support, but the very next day it gapped higher for a quick recovery. I bought an IWM calendar call spread right after the open, fully intending to hold the long side of the trade into the coming week. However, the spread hit my initial profit target the next day as IWM faded from an intraday high of $252.37. The pricing dynamics of choppy trading action make the calendar spread particularly attractive.
With a close above 20DMA resistance, IWM even confirmed its 200DMA as support. As a result, IWM retains bullish status. This status is one of the key signs signaling a bottom for the stock market as a whole.
")
The Short-Term Trading Call With Key Signs
- AT50 (MMFI) = 35.1% of stocks are trading above their respective 50-day moving averages
- AT200 (MMTH) = 47.8% of stocks are trading above their respective 200-day moving averages
- Short-term Trading Call: cautiously bullish
AT50 (MMFI), the percentage of stocks trading above their respective 50DMAs, closed the week at 35.1%. My favorite technical indicator failed to drop below the 20% oversold threshold, but it is acting like it already completed a tour of duty in oversold territory. The current sequence of higher lows and higher highs represent the classic signals of a bottom. While I prefer waiting for an official oversold condition before flipping bullish, I think there are enough key signs of a bottom for me to upgrade the short-term trading call from neutral to cautiously bullish.
")
AT200, the percentage of stocks trading above their 200DMAs, is not as positive as AT50. I will be more comfortable with my bullish call after AT200 reaches 49% or 50%. That level clears the recent churn and consolidation and provides the prospect of a double bottom in this longer term measure of market breadth’s health.
")
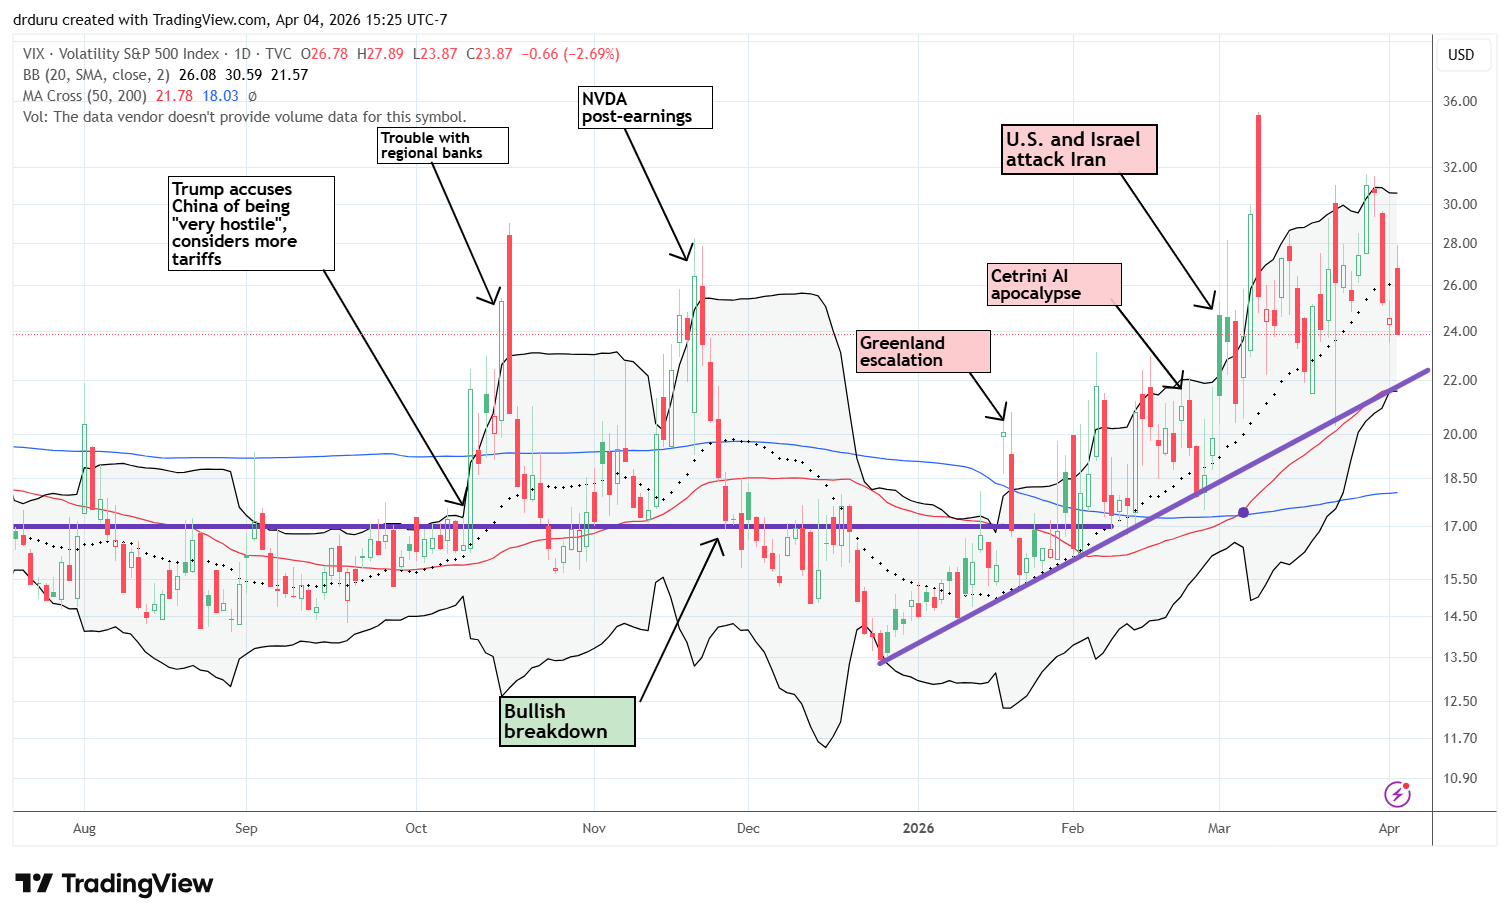
When market breadth is insufficient to declare a bullish transition in oversold conditions, the VIX becomes a handy technical partner. The VIX supports key signs of a bottom although it has not yet provided a confirmation signal. On the positive side, the VIX faded from this cycle’s closing high and did not exceed the intraday high from the major fade on March 9th. However, the uptrend that has been in place all year remains intact. This uptrend led me to conclude recently that the market will get worse before it gets better. Last week’s fade backed me off that ledge of concern.
With these key signs of a bottom, I am much less inclined to buy puts or short stocks. Yet, I remain cautious and unwilling to get aggressive until the next dip and/or a confirmed 200DMA breakout.
The market goes into the coming week of trading on the heels of a March jobs report showing the creation of 178,000 jobs. Those numbers could provide a tailwind of confidence that the U.S. economy will remain resilient despite the war.
In case you missed it…
I made several good trades last year by following the insider buying of company executives. This gambit has largely failed this year. Thus, I was both excited and hesitant when I saw the CEO of cybersecurity software company Palo Alto Networks (PANW) load up on $10M worth of shares. I am on hold until the stock breaks out above $172 resistance.
The Stocks and ETFs
United States Oil Fund (USO)
Description: United States Oil Fund, LP is an exchange-traded security designed to track the daily price movements of light, sweet crude oil.
Technical status: United States Oil Fund (USO) maintained 20DMA support, managing to break out above its upper Bollinger Band to an 11-year high.
Trade commentary: USO was a key sign of a bottom. While USO soared 11.2% on the day in the wake of the President’s address to the nation the night before, the stock market was able to battle back for gains on the day and preserve the week’s gains. This kind of counter-intuitive trading suggests the market is looking over the side of the hill to something better. Of course, if oil just keeps marching ever higher, such optimism will get sorely tested.
")
Goldman Sachs (GS)
Description: The Goldman Sachs Group, Inc. is a leading global investment banking, securities, and asset and wealth management firm that provides a wide range of financial services to a substantial and diversified client base.
Technical status: Goldman Sachs Group Inc (GS) successfully tested 200DMA support three times in a key sign of a strengthening stock market.
Trade commentary: Financials are an important supporting signal for the stock market. Thus the attempt of GS to bottom with a successful test of 200DMA support provides a key sign of a bottom for the general market. A 50DMA breakout would seal the deal.
")
Apple (AAPL)
Description: Apple develops hardware, software, and services that work together across consumer and enterprise use cases.
Technical status: Apple (AAPL) defended its 200DMA during the March sell-off. The next key step is a breakout above 50DMA resistance.
Trade commentary: AAPL is an important stock in big-cap tech and particularly the Magnificent 7. The stock still trades bullishly above its 200DMA support, making it a top performers on a relative technical basis. Alphabet (GOOG) is the only other stock in the Magnificent 7 still in bullish territory. As soon as AAPL achieves a 50DMA breakout, I will get back to the Apple Trade Model (ATM).
")
Alphabet, Inc (GOOG)
Description: Alphabet Inc. is a multinational technology conglomerate holding company, formed in 2015 as the parent of Google and several former Google subsidiaries. It focuses on internet services—including Search, YouTube, and Android—as well as cloud computing and artificial intelligence.
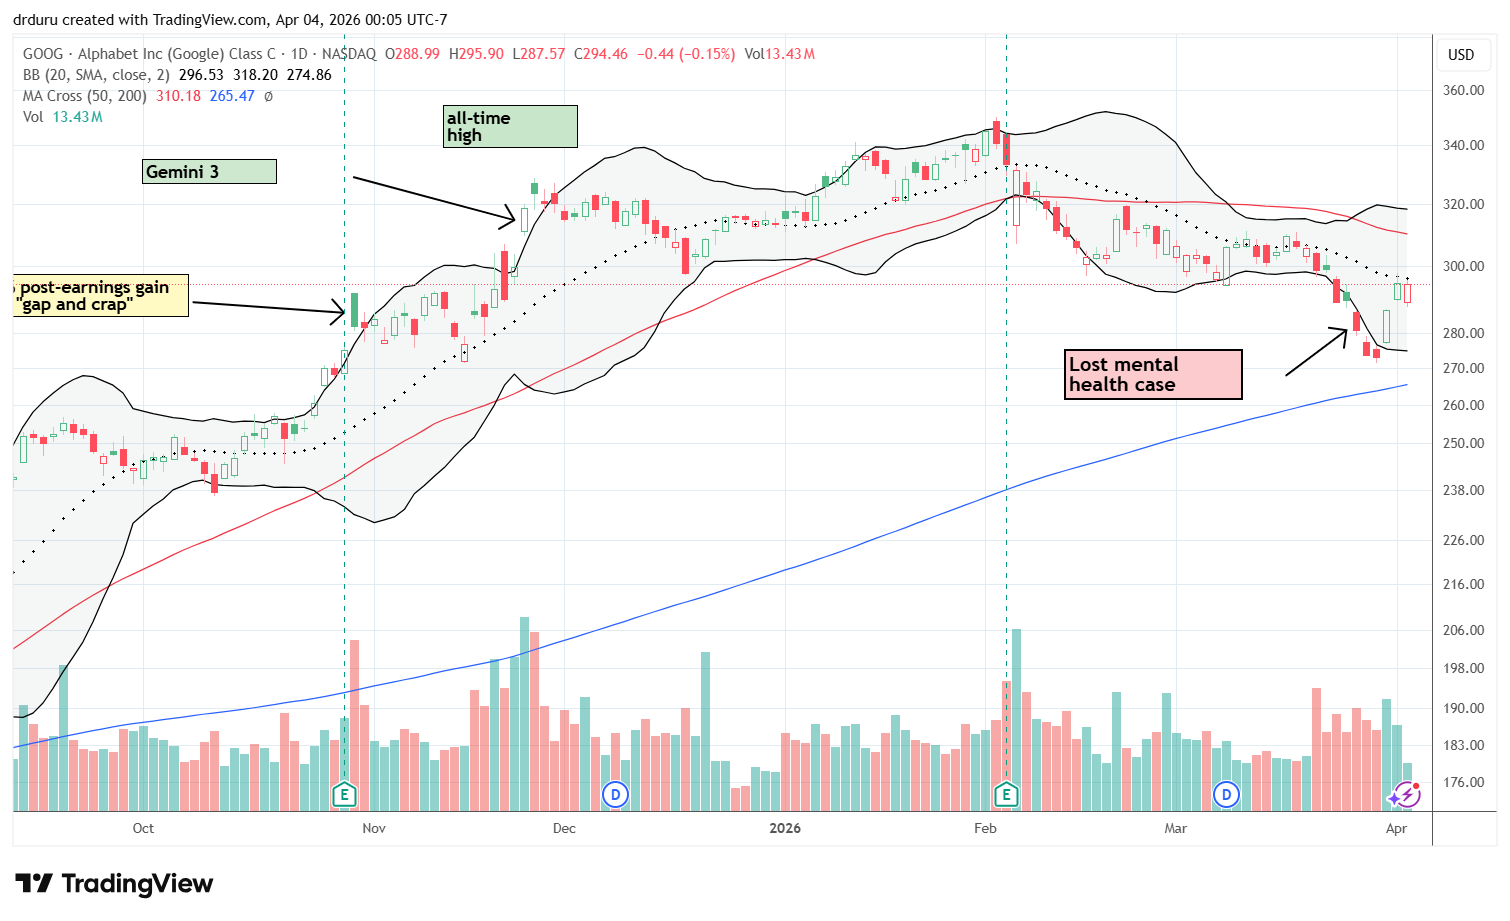
Technical status: Alphabet (GOOG) got close enough to 200DMA support for me to start buying, and so far, so good. The stock rebounded, but precariously stalled at 20DMA resistance.
Trade commentary: I am not ready to buy AAPL, but I did buy GOOG as close enough to 200DMA support. I am trying to hold the stock as a long-term position. The swing trader in me wanted to take profits at 20DMA resistance, but I held on. Note that the stock is already higher than where it traded after the company lost in its mental health trial.
Tesla Inc (TSLA)
Description: Tesla’s mission is to accelerate the world’s transition to sustainable energy.
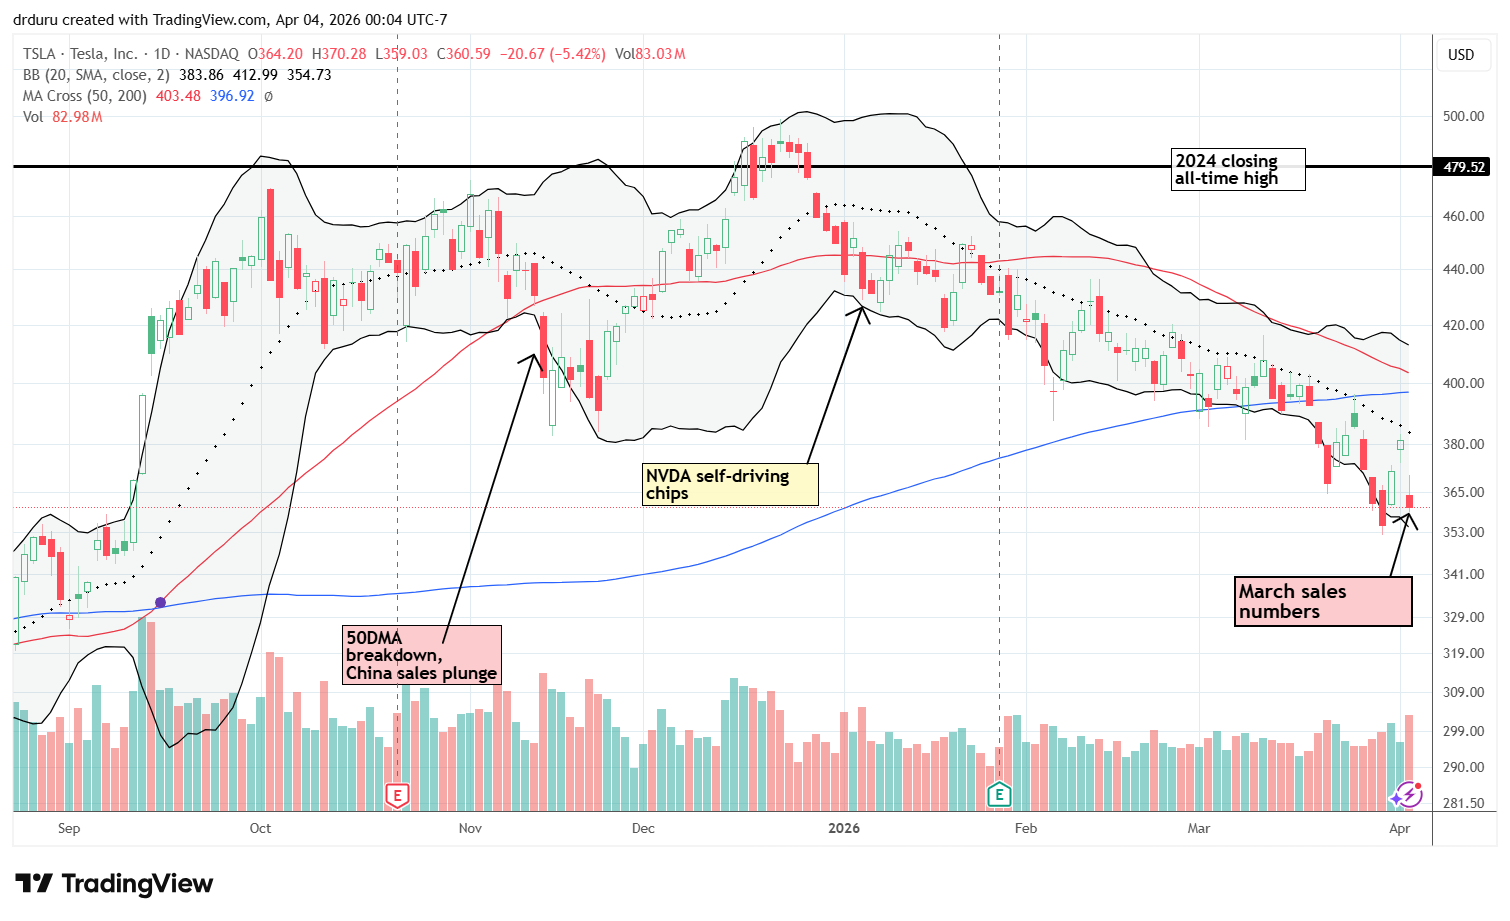
Technical status: Tesla, Inc (TSLA) did not participate in Thursday’s rally and instead fell 5.4% after reporting March sales numbers. The stock remains in a persistent and bearish downtrend.
Trade commentary: TSLA is one of the key laggards I am watching. The stock is deeply bearish as is most of the Magnificent 7, but with the general market potentially bottoming, sellers may have a harder time forcing TSLA to a new low. I am not yet sure how I want to trade TSLA, but I am very interested in the message the market sends through TSLA relative to the rest of the market.
Coherent Corp. (COHR)
Description: Coherent is a global photonics leader serving datacenter, communications, and industrial markets.
Technical status: Coherent Corp (COHR) broke below its 50DMA and did not stay down there for long, rising up again.
Trade commentary: While COHR is a bullish stock that proved quite resilient during the March sell-off, I am not buying it here. If the stock market has indeed bottomed for this cycle, then other stocks should offer more relative upside. I see COHR as a stock that is likely to churn on or around its 50DMA for quite some time.
")
Palantir Technologies (PLTR)
Description: Palantir is a software company that specializes in big data analytics, providing platforms that enable government agencies and large corporations to integrate, analyze, and visualize complex datasets to facilitate data-driven decision-making. The company helps organizations connect fragmented information to optimize operations, detect fraud, and manage critical tasks, often acting as an operating system for their data.
Technical status: Palantir Technologies Inc (PLTR) briefly broke below the important $141.52 level, before recovering with a minor 50DMA breakout.
Trade commentary: I bought PLTR shares instead of calls because the stock may take time to work through the messy technicals. Still, I like how PLTR’s defense of the $141.52 support coincides with a bottom in the stock market. The nascent 50DMA breakout is encouraging.
")
Oracle (ORCL)
Description: Oracle provides a complete suite of integrated cloud applications and a cloud infrastructure platform.
Technical status: Oracle Corp (ORCL) faded post-earnings through most of March, but made a small jump at the end of the month that confirmed support at the February low.
Trade commentary: In February, I made the case for a $135 bottom in ORCL. In March I made two separate buys of shares in anticipation of this bottom holding. Last weeks successful test of this support was picture perfect. Unfortunately, the rebound happened in the wake of a massive layoff at the company. As usual, Wall Street reveled in the news, sending the stock up 6.0% on Tuesday.
")
BHP Group (BHP)
Description: BHP says it is the world’s largest mining company by market capitalization and a leading producer of iron ore, copper, and metallurgical coal.
Technical status: BHP Group Ltd (BHP) confirmed a breakout above its 50DMA, but Thursday’s gap down nearly invalidated the breakout.
Trade commentary: I had exited my commodity plays last month because of technical breakdowns. I wanted to preserve profits in case further selling took stocks like BHP down to 200DMA support. The stock stopped far short of a such test before rallying to a 50DMA breakout. I bought back in on the second day of gains which confirmed the breakout. Thursday’s gap down looked like a fakeout until buyers closed BHP above its 50DMA. While the 20DMA support looks a little more solid, I am leery that my extra large position may be subject to an early exit.
")
Rio Tinto (RIO)
Description: Rio Tinto is a leading global mining and materials company.
Technical status: Rio Tinto Plc (RIO) confirmed a breakout above its 50DMA and preserved the bullish move even after Thursday’s initial gap down.
Trade commentary: I am in the same position in RIO as I am in with BHP. Thursday’s recovery for RIO looks more convincing than BHP’s recovery. Moreover, RIO’s 20DMA support is flattening out, so I am more confident that I can hold RIO. I will keep BHP as long as I can keep RIO.
")
SPDR Gold Shares (GLD)
Description: The investment objective of SPDR Gold Trust is for the shares to reflect the performance of the price of gold bullion, less the Trust’s expenses.
Technical status: SPDR Gold Trust (GLD) sold off hard after its 50DMA breakdown and over-extended below its lower Bollinger Band. The subsequent rebound preserved support from the former all-time high around $403.26.
Trade commentary: My short GLD April $400 put option has experienced a roller coaster. I had to patiently sit through a major test of the former all-time high around $403.26. After buyers confirmed that support, they rallied GLD right to 20DMA resistance. I stopped short of taking profits in order to see whether GLD could push on to a test of 50DMA resistance. Thursday’s gap down now puts my position into a two-week race against time. Note I still do not mind owning GLD below $400, especially with 200DMA support steadily rising.
")
Advanced Micro Devices (AMD)
Description: AMD is the high performance and adaptive computing leader, powering products and services across data center, embedded, gaming, and PC markets.
Technical status: Advanced Micro Devices Inc (AMD) consistently held 200DMA support on its way to two 50DMA breakouts. In a key sign of an improving market, AMD finally looks ready to continue higher.
Trade commentary: AMD has been in swing-trade mode. I have been buying near 200DMA support and selling near 50DMA resistance. The first breakout above 50DMA resistance turned into a fakeout, but the second 50DMA breakout looks better in the context of a bottoming stock market. If AMD follows through I will return to my original desire to hold AMD as a long-term position.
")
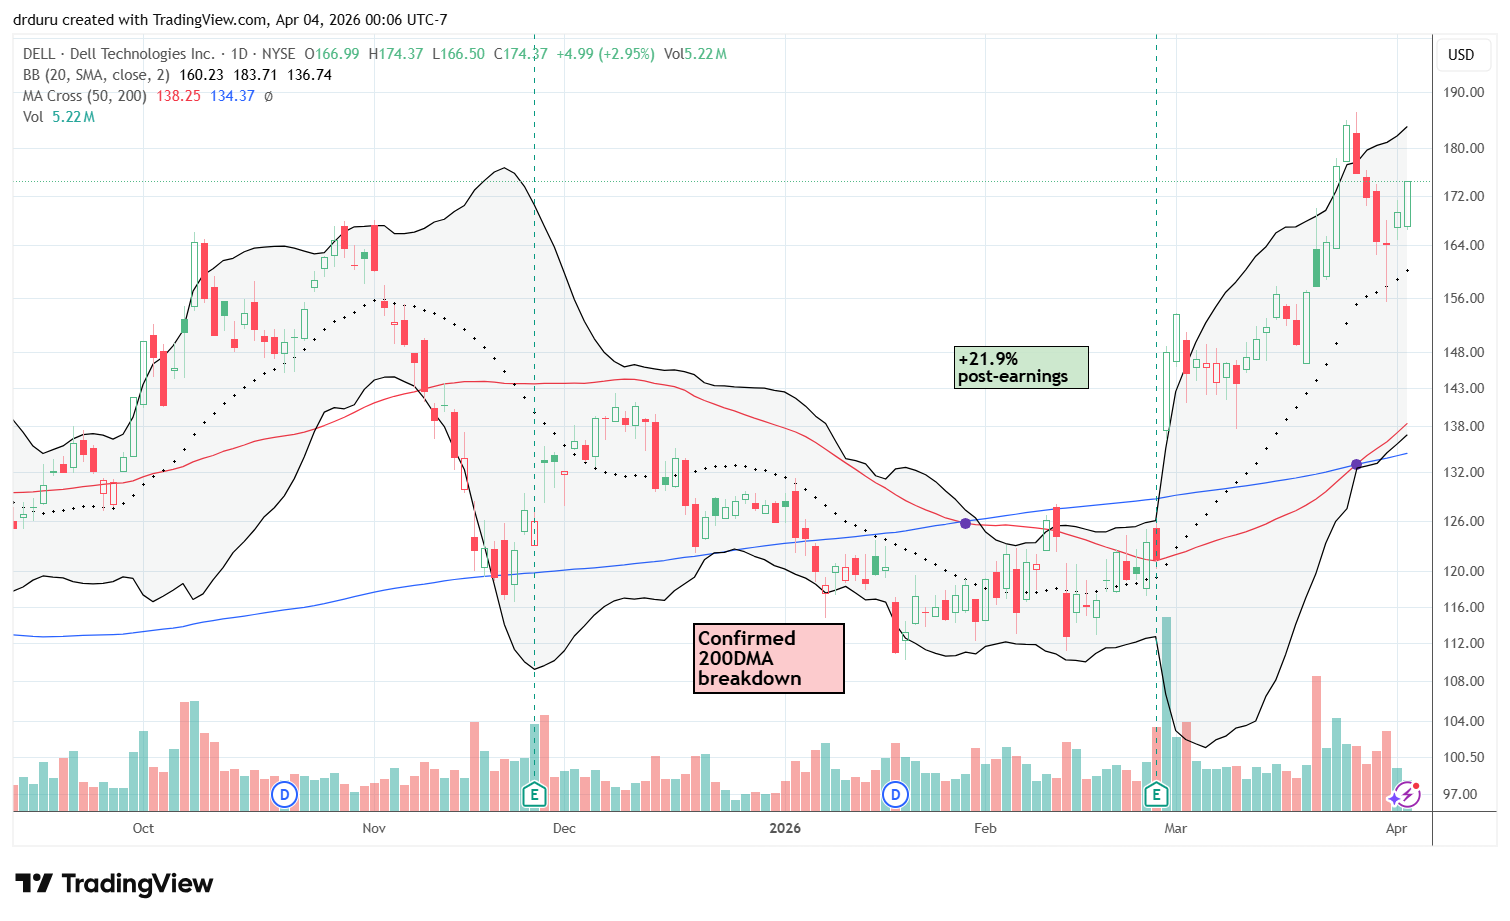
Dell Technologies (DELL)
Description: Dell Technologies says its purpose is to drive human progress through the power of technology.
Technical status: Dell Technologies (DELL) remained impressively strong, even after sellers knocked it back from a new all-time high. The stock has now confirmed 20DMA support.
Trade commentary: Propelled by a 21.9% post-earnings surge, DELL continued to rally in March contrary to the market’s accelerating weakness. Buyers finally over-extended the stock above its upper Bollinger Band (BB), and subsequent selling plunged the stock into a rapid, but successful, test of 20DMA support. Now DELL is back on my shopping list as a swing trade.
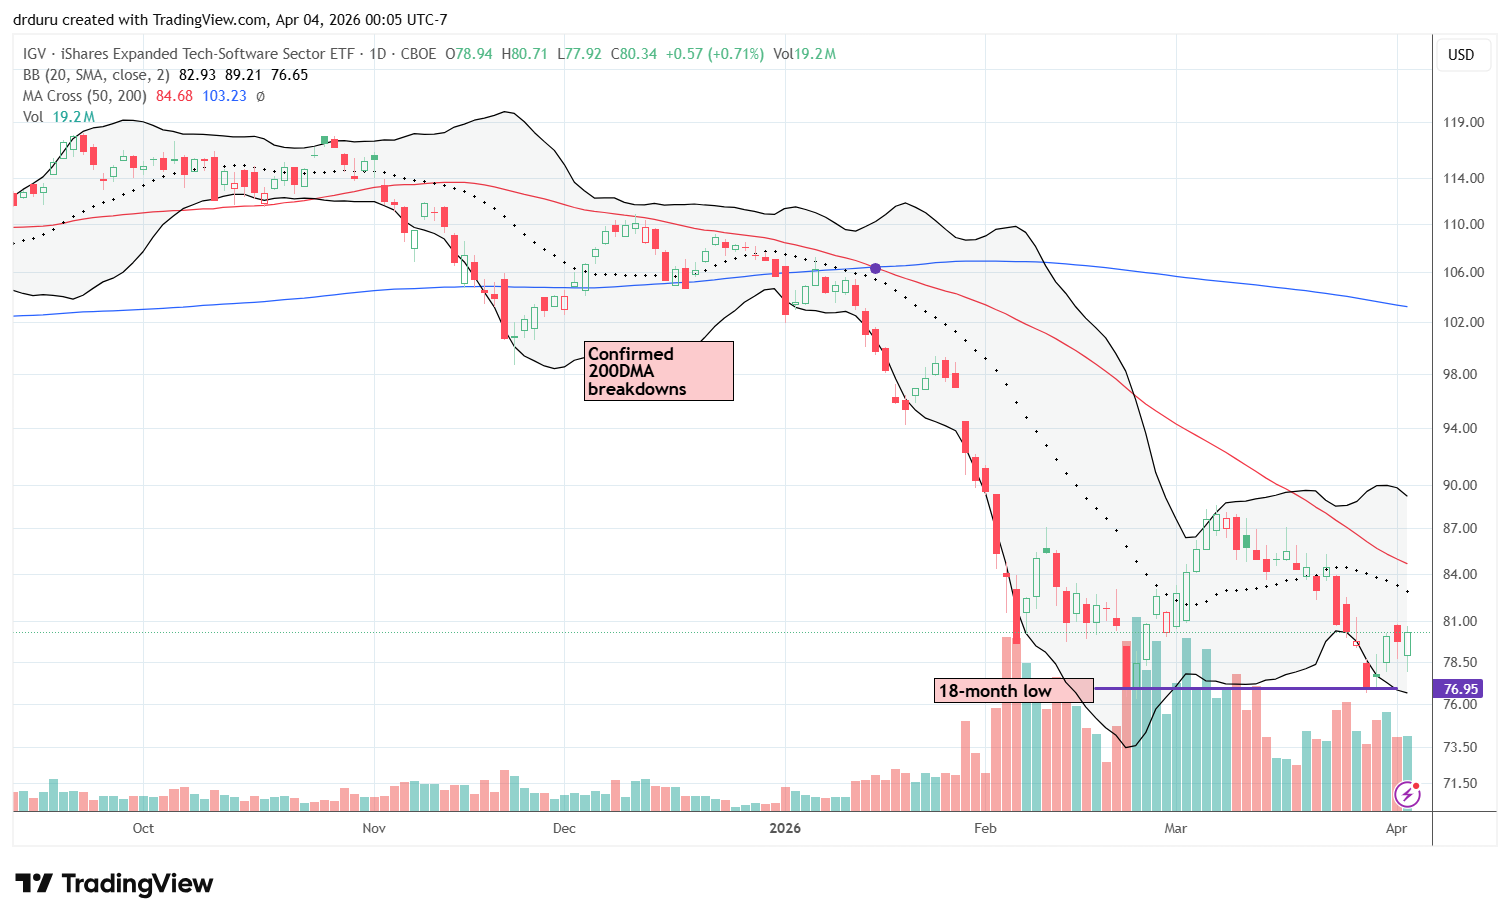
iShares Expanded Tech-Software Sector ETF (IGV)
Description: The iShares Expanded Tech-Software Sector ETF seeks to track the investment results of an index composed of North American equities in the software industry and select interactive media and services companies.
Technical status: The iShares Expanded Tech-Software Sector ETF (IGV) fell below its lower Bollinger Band but closed perfectly on support from February’s low. I bought a new position with an upside target at 20/50DMA resistance.
Trade commentary: I bought back into IGV after it dropped far below its lower Bollinger Band to test the February low. Unlike that drop, I wasted no time in buying a new trading position in IGV. The AI panic in software has turned a lot of software stocks into playgrounds for short-term traders, but I continue to pick my spots in select names I think will survive the SaaSpocalypse. I have flipped the typical approach to use individual company stocks to trade around a core ETF position.
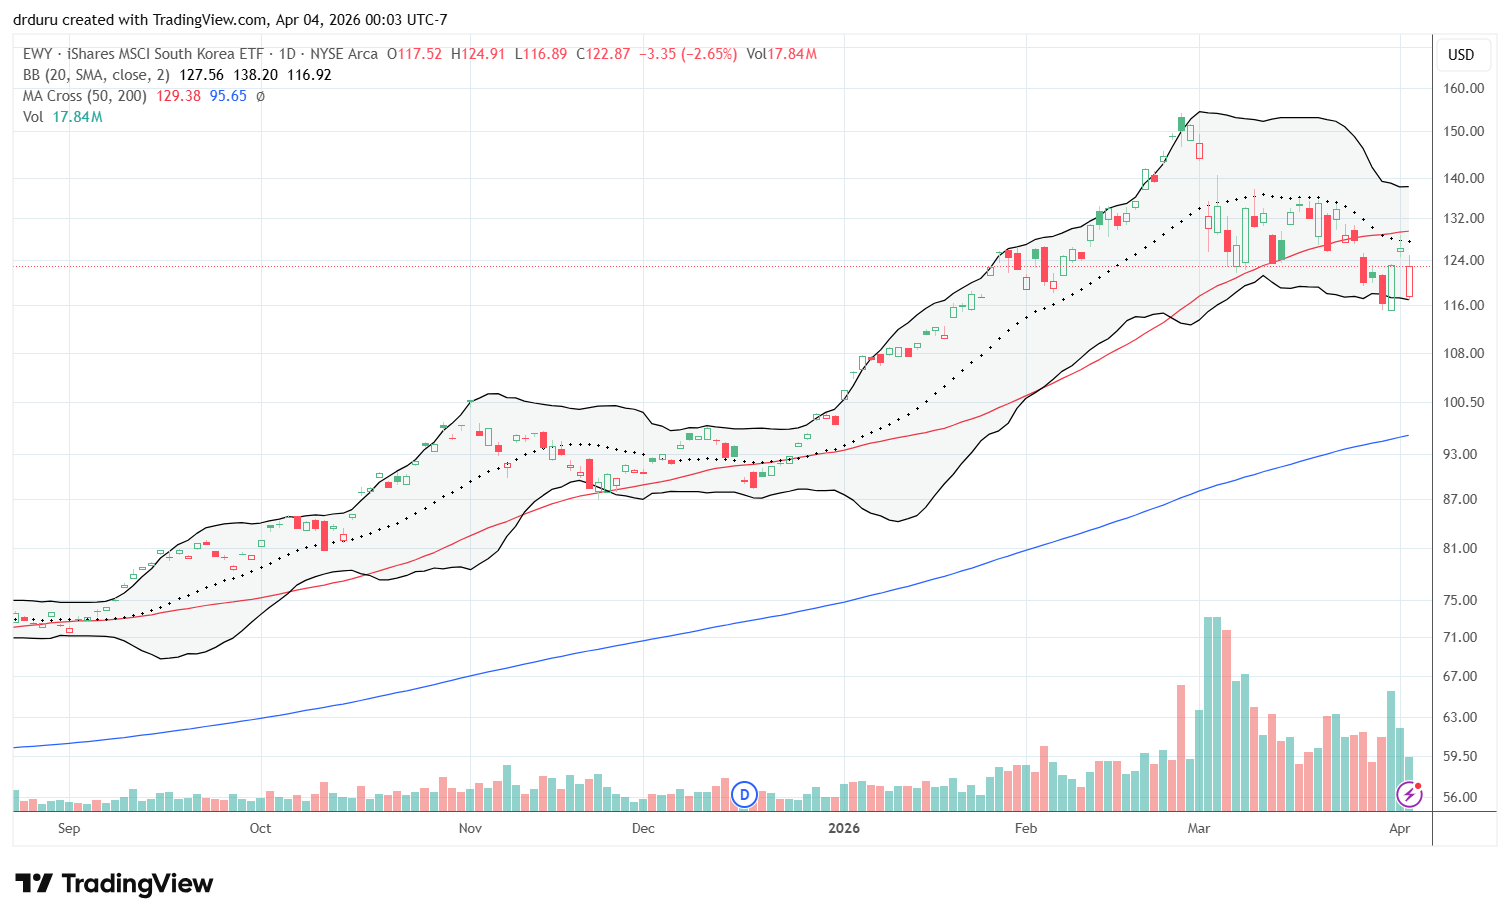
iShares MSCI South Korea ETF (EWY)
Description: The iShares MSCI South Korea ETF seeks to track the investment results of an index composed of South Korean equities.
Technical status: The iShares MSCI South Korea ETF (EWY) suffered two distinct breakdowns in March with 20DMA resistance holding firm. A long-term uptrend is at risk.
Trade commentary: EWY is dominated by Samsung and Hynix. Still, the remaining 42% of the holdings are distributed broadly across South Korean companies and make it an attractive option for trading on South Korea’s momentum. Yet, the country is very vulnerable to the oil shock from the Iran war, so EWY suffered mightily at the onset of the Iran war. EWY fell 10% on the second day of war trading. I bought shares on EWY’s second test of 50DMA support and quickly exited on a test of 20DMA resistance. A 50DMA breakdown and the persistence of 20DMA resistance make me hesitant to buy again. I am content to wait on a 50DMA breakout.
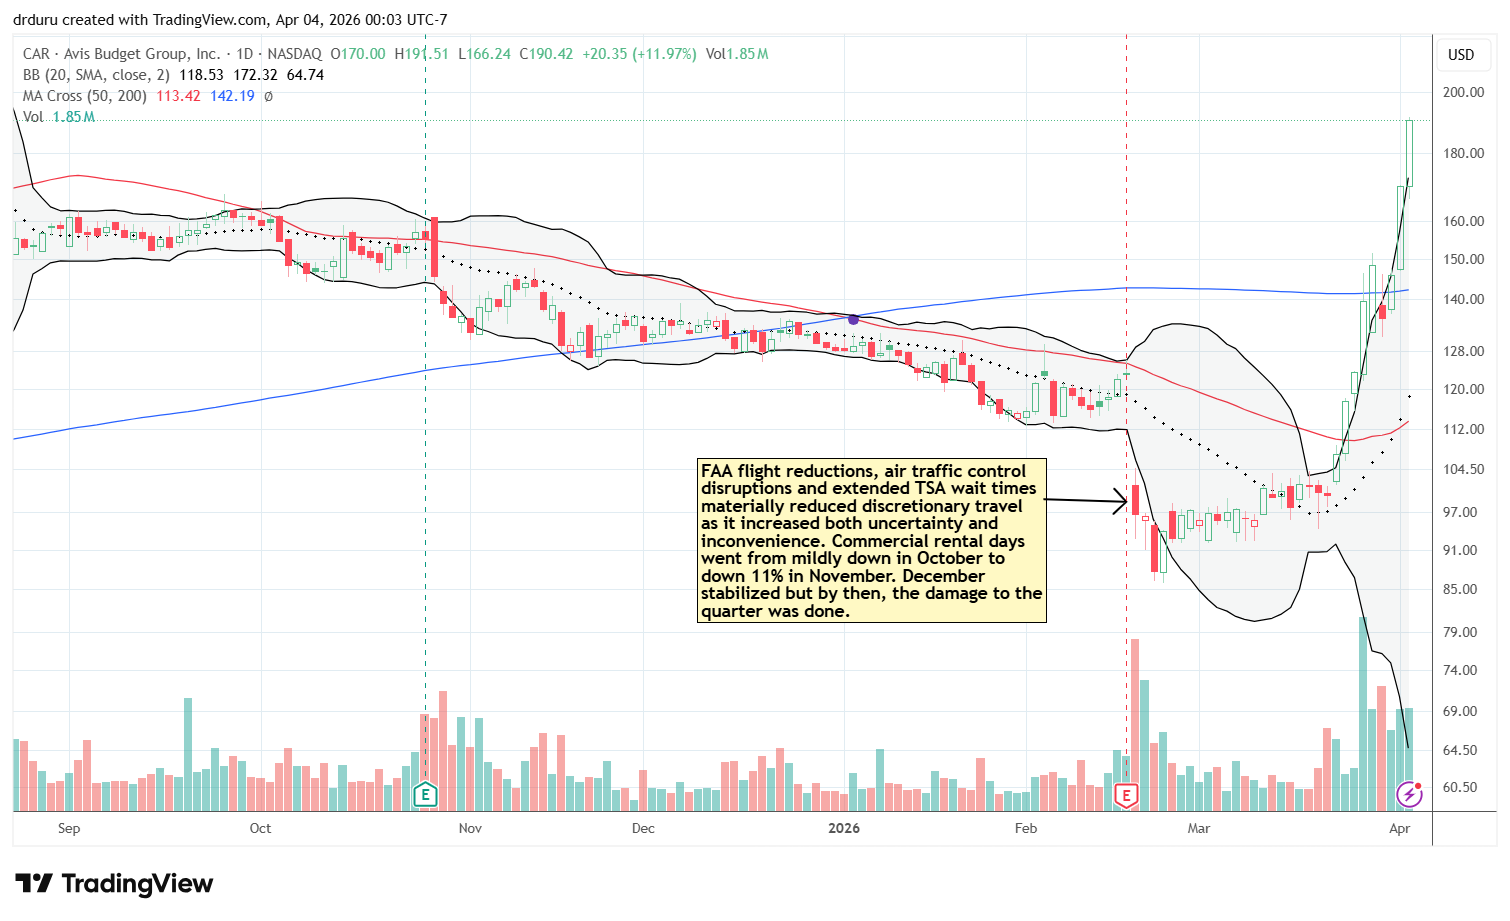
Avis Budget Group (CAR)
Description: Avis Budget Group is a leading global provider of mobility solutions through Avis, Budget, and Zipcar.
Technical status: Avis Budget Group (CAR) had an amazingly strong week, closing multiple times above its upper Bollinger Band. It became extremely overextended as it filled part of a large post-earnings gap down from last July.
Trade commentary: I analyzed the data and the technicals and concluded that CAR, and HTZ (see below), were trading on false hopes. The hopes may be false, but they have staying power. CAR is now parabolic with the stock closing at or above its upper Bollinger Band 7 of the last 8 days. This kind of surge is unsustainable, but there is no way to tell how long it can last. There is just the expectation for significant losses once the move finally ends (or slows). I nibbled on a short position despite the bottoming in the stock market. CAR gained 28.3% last week and 48.6% the prior week! This episode demonstrates how fundamental analysis can fail just as spectacularly as the technicals.
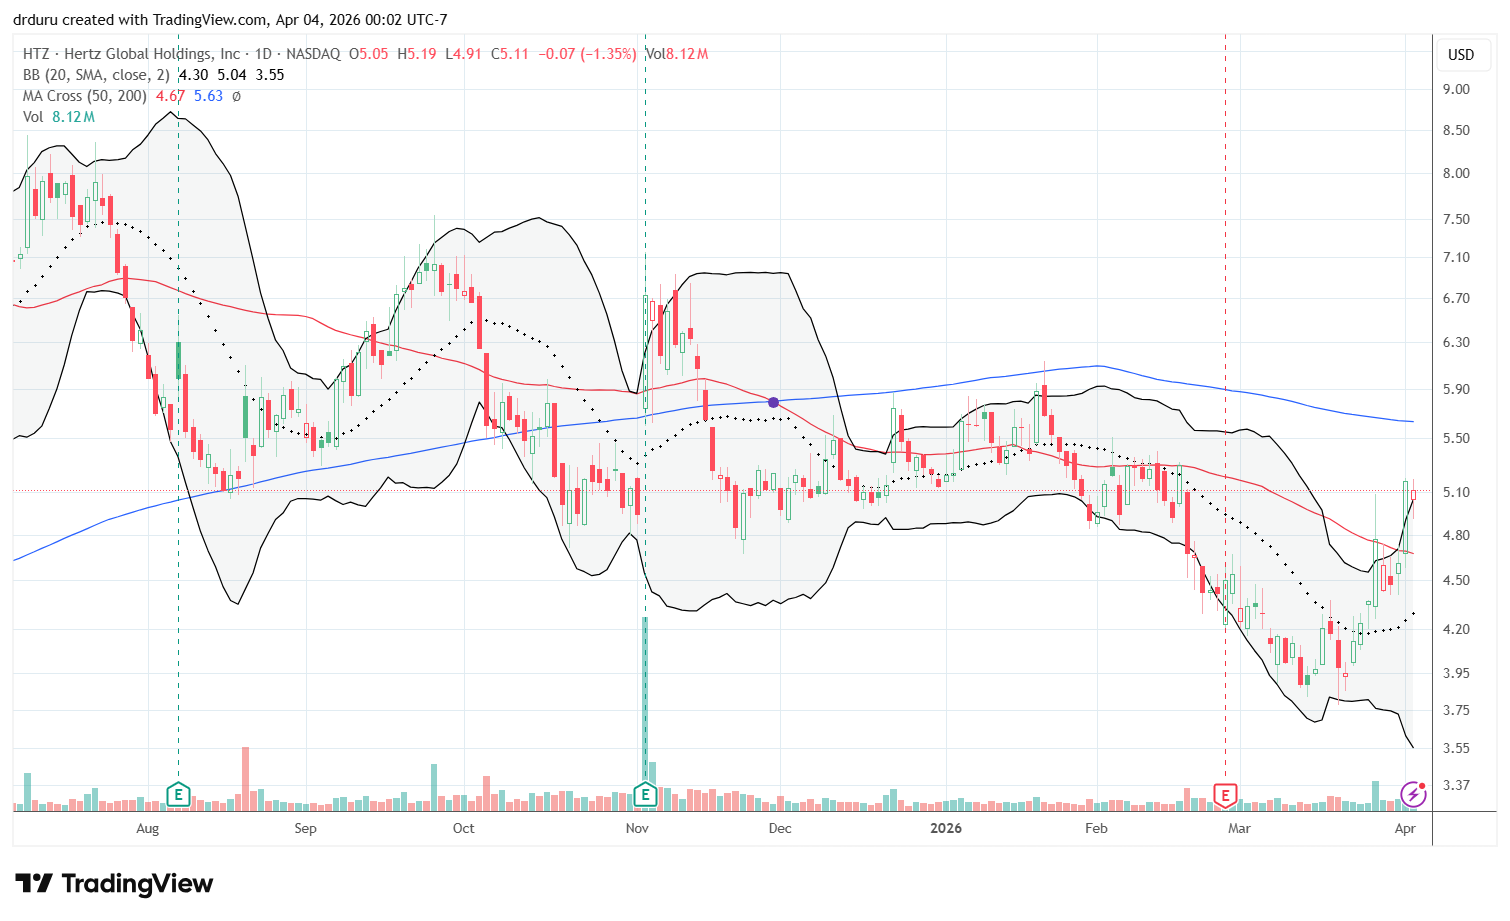
Hertz Global Holdings (HTZ)
Description: Hertz Global Holdings is one of the world’s leading car rental and mobility solutions providers.
Technical status: The resurgence in Hertz Global Holdings (HTZ) looks unremarkable compared to CAR’s move and the overall downtrend in HTZ.
Trade commentary: The divergence between HTZ and CAR is ironic. HTZ was supposedly at the center of the excitement based on the company’s press release about search results. HTZ “only” gained 11.1% and 16.5% the prior week. Still, the current search results are now running directly counter to Hertz’s positive narrative. Thus, HTZ is just as vulnerable to a sharp pullback as CAR.
Be careful out there!
Footnotes
Subscribe for free to get email notifications of future posts!
“Above the 50” (AT50) uses the percentage of stocks trading above their respective 50-day moving averages (DMAs) to measure breadth in the stock market. Breadth defines the distribution of participation in a rally or sell-off. As a result, AT50 identifies extremes in market sentiment that are likely to reverse. Above the 50 is my alternative name for “MMFI” which is a symbol TradingView.com and other chart vendors use for this breadth indicator. Learn more about AT50 on my Market Breadth Resource Page. AT200, or MMTH, measures the percentage of stocks trading above their respective 200DMAs.
Active AT50 (MMFI) periods: Day #179 over 20%, Day #2 over 30% (overperiod), Day #15 under 40% (underperiod), Day #18 under 50%, Day #26 under 60%, Day #152 under 70%
Source for charts unless otherwise noted: TradingView.com
Full disclosure: long IWM shares, short GLD put, long USO puts and calendar put spread, long PLTR, long ORCL, long BHP, long RIO, long IGV, short CAR
FOLLOW Dr. Duru’s commentary on financial markets via StockTwits, BlueSky, and even Instagram!
*Charting notes: Stock prices are not adjusted for dividends. Candlestick charts use hollow bodies: open candles indicate a close higher than the open, filled candles indicate an open higher than the close.
* Blog notes: this blog was partially written based on the heavily edited transcript of the following video that includes a live review of the stock charts featured in this post. I used ChatGPT to process the transcript.