Stock Market Commentary
The stock market’s bearish divergence is too strong to ignore. The S&P 500 and the NASDAQ achieved all-time highs while market breadth sunk again this week. Both short-term and long-term market breadth indicators are at key support levels. Even if market breadth somehow rebounds from current levels, I find myself getting yet even more wary about the stock market. While an entire swath of stocks suffer, so much of the market’s liquidity is pouring into a few big cap winners and a few crazed meme stocks. This unbalanced combination reads like a recipe for trouble.
In timely fashion, I stumbled on a recent MarketWatch article titled “Index funds are ruining the stock market.” The author summarized and commented on an even more timely research paper titled “Passive Investing and the Rise of Mega-Firms.” The authors from Michigan State University, the London School of Economics, and the University of California-Irvine concluded the following (from the abstract):
“Flows into passive funds raise disproportionately the stock prices of the economy’s largest firms, and especially those large firms that the market overvalues. These effects are sufficiently strong to cause the aggregate market to rise even when flows are entirely due to investors switching from active to passive. Our results arise because flows create idiosyncratic volatility for large firms, which discourages investors from correcting the flows’ effects on prices. Consistent with our theory, the largest firms in the S&P500 experience the highest returns and increases in volatility following flows into that index.”
The authors might as well have prophesied about the recent trading action in NVDA and now AAPL over the past two months. Just these two stocks alone have tacked on hundreds of billions of fresh market cap while market breadth has waned, like they are sucking the oxygen for market breadth out of the room. Perhaps the dynamics of the passive fund flows mean market breadth is slowly becoming a quaint technical indicator. Perhaps a stock market that is all about a handful of companies is the new reality for the foreseeable future. For now, I think this latest streak of concentration spells trouble that is difficult to quantify…but it is definitely too strong to ignore.
The Stock Market Indices
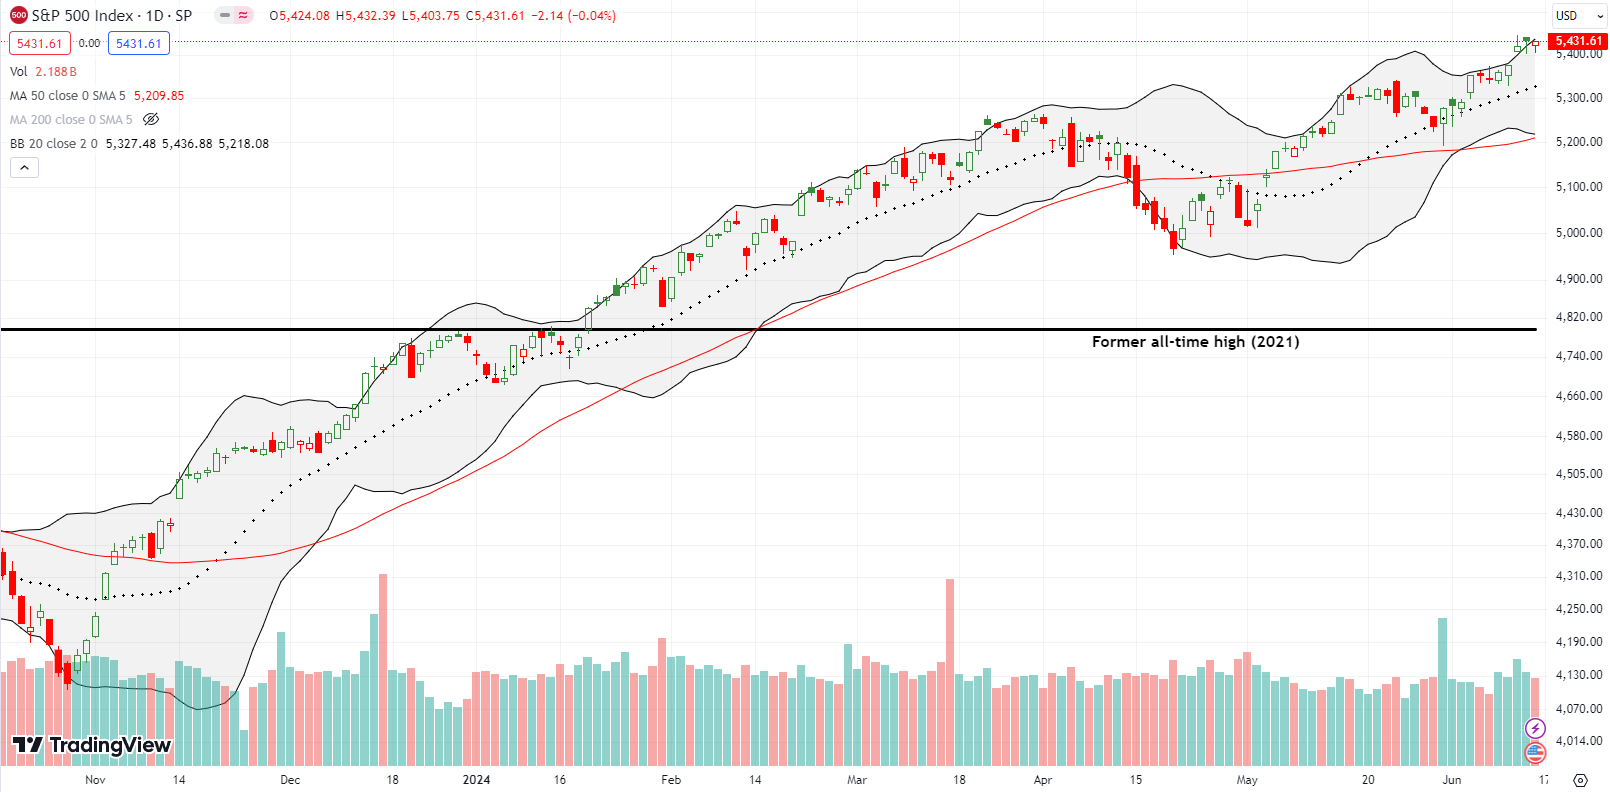
The S&P 500 (SPY) set all-time highs the first 4 days of the week. The index closed the week just two points off the all-time high as the persistent buyers (passive flows?) conveniently picked the S&P 500 off the 5400 level. This hugging of the upper Bollinger Band (BB) comes in the wake of Wednesday’s positively received CPI report and the Federal Reserve’s latest meeting. That gap higher on Wednesday is begging for a fill, so I bought SPY put options expiring next Friday. This trade materializes my claim that the stock market is experiencing a bearish divergence too strong to ignore. Of course, I could easily get steamrolled given the market’s current momentum.
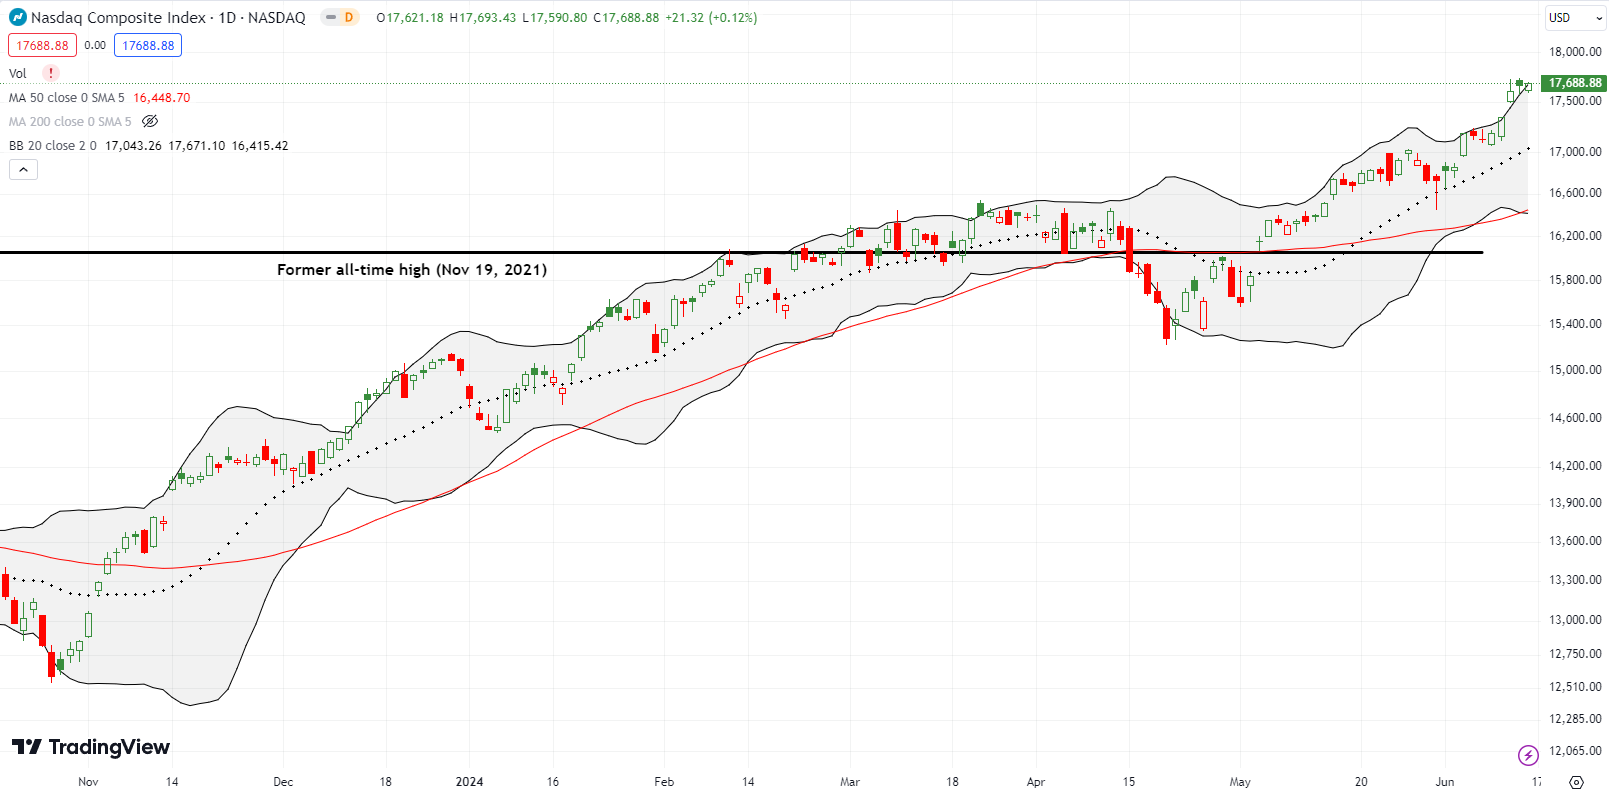
The only difference between the NASDAQ (COMPQ) and the S&P 500 last week was that the NASDAQ succeeded in hitting all-time highs EACH day of the week. I watched my weekly QQQ put options expire worthless. They were small hedges on my bullish tech positions during the week. I did not dare bet on a gap fill like I did with the S&P 500.
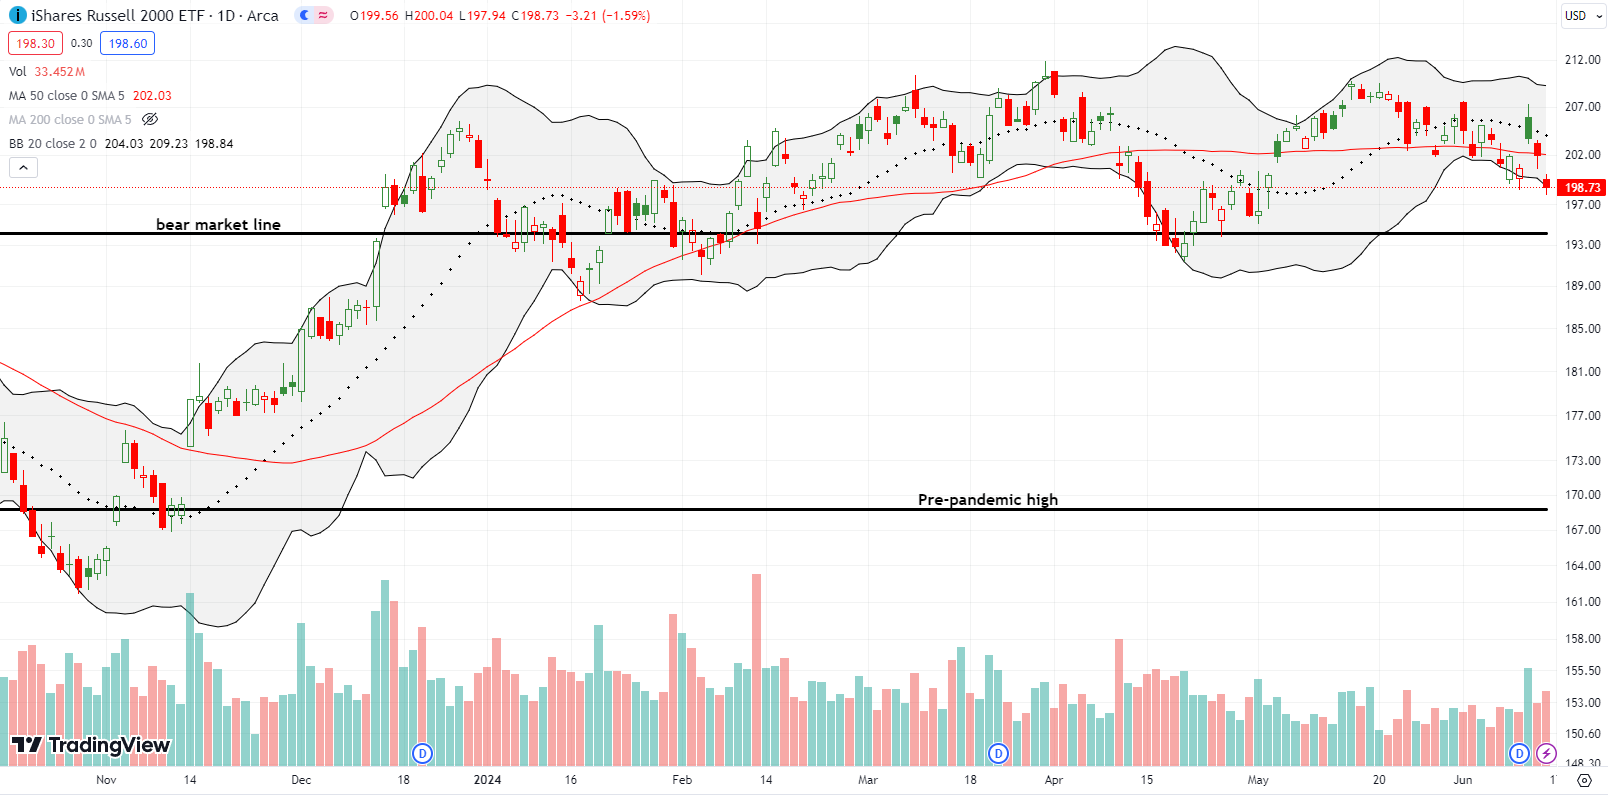
The iShares Russell 2000 ETF (IWM) significantly lagged the S&P 500 and the NASDAQ yet again. The ETF of small caps even closed at a 6-week low and looks ready to test its bear market line yet again. I was successful in being a little contrary at the beginning of the week by buying IWM call options and selling them into the Wednesday’s CPI/Fed celebration. I pushed my luck by buying a weekly call option into Friday’s selling. The modest profit target sits at 50DMA resistance. Note I bought the position before concluding that the bearish divergence in the stock market is too strong to ignore.
The Short-Term Trading Call When Signals Are Too Strong to Ignore
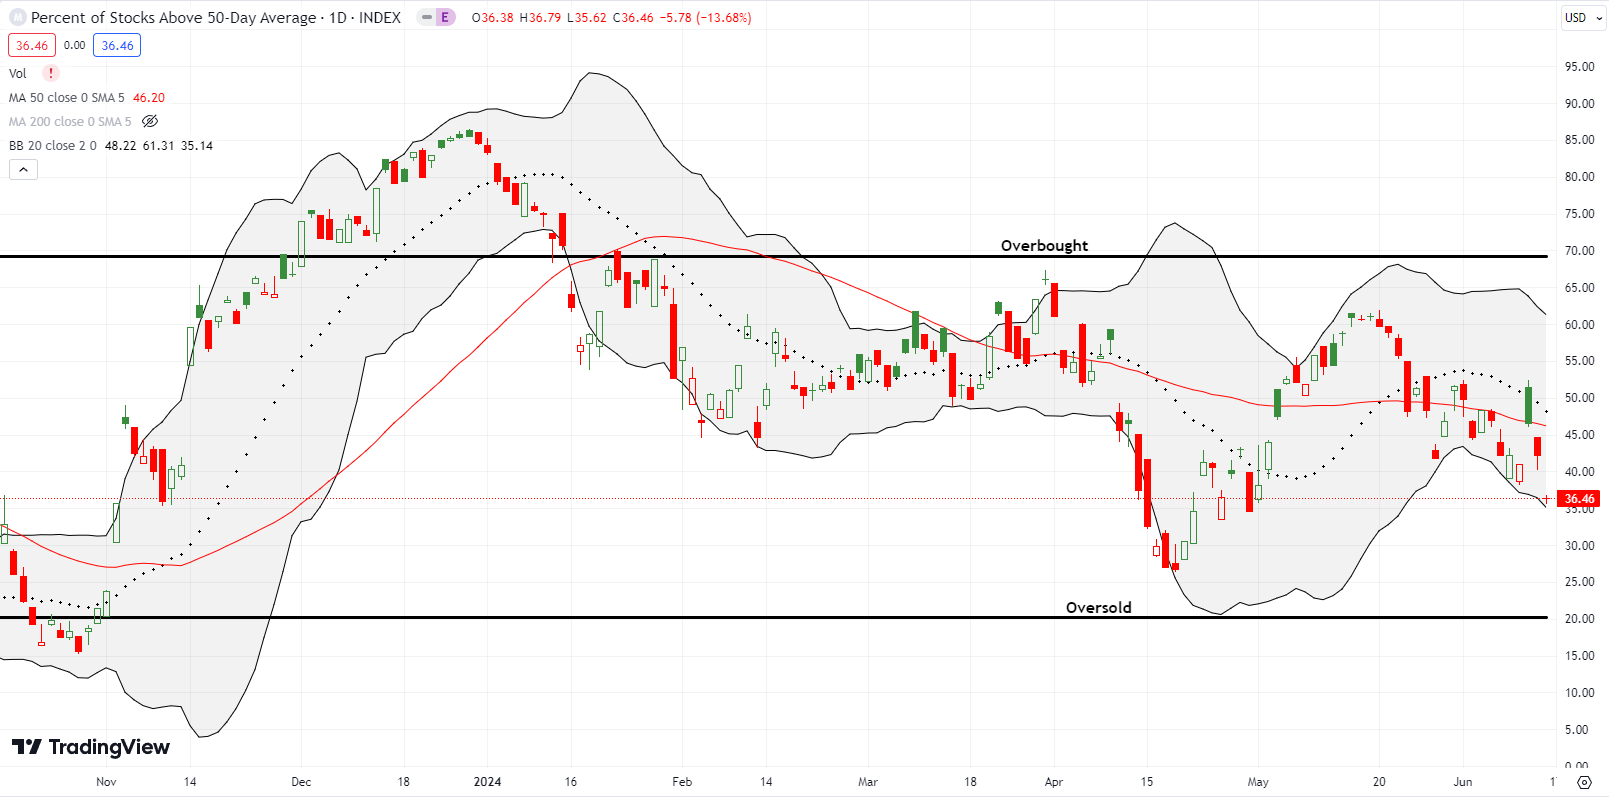
- AT50 (MMFI) = 36.5% of stocks are trading above their respective 50-day moving averages
- AT200 (MMTH) = 51.2% of stocks are trading above their respective 200-day moving averages
- Short-term Trading Call: neutral
AT50 (MMFI), the percentage of stocks trading above their respective 50DMAs, faded from Wednesday’s high of the month to Friday’s 6-week low. This rapid turnaround was too strong to ignore given the S&P 500 and the NASDAQ made all-time highs through the turbulence. AT200 (MMTH), the percentage of stocks trading above their respective 200DMAs, looks even more ominous. This longer-term indicator of market breadth ended the week close to its low of the year set 2 months ago.I am guessing support will not hold. IWM symbolizes the problem outside of the dominant big cap tech stocks.
The bearish divergence is strong enough to downgrade my short-term trading call from cautiously bullish to neutral. I cannot stay bullish while market breadth continues to sink and diverge from the major indices. However, I cannot get bearish with the major indices firmly holding upward momentum, and my favorite technical indicator (AT50) is already trading near half the overbought level (70%). So I am stuck in the middle playing a balancing act with my trading positions.
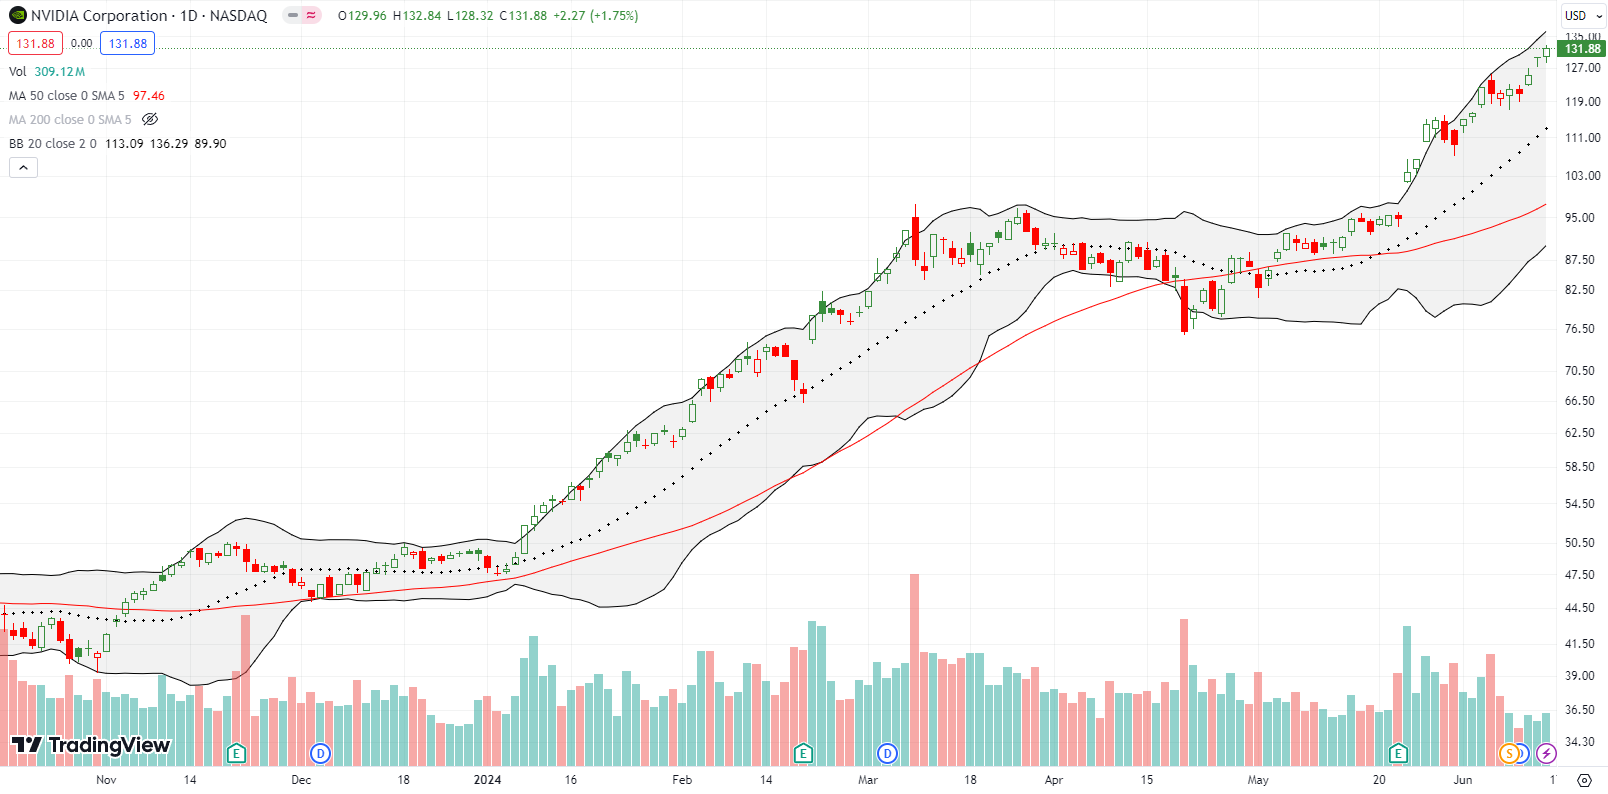
Talking about the mind-boggling and persistent rise in NVIDIA Corporation (NVDA) feels like playing the same song over and over. NVDA tacked on another 10.3% for the week for fresh all-time highs. NVDA is a poster child for a bearish divergence too strong to ignore because the stock is a major contributor to the strength of the S&P 500 and the NASDAQ. According to Fortune, NVDA is responsible for a third of all the S&P 500’s gains this year. The struggles of the average floundering stock hardly matter. NVDA is now worth an eye-popping $3.4 trillion.
I had a hedged trade in place on NVDA that ended up significantly capping my trading gains (maybe a 10% gain is no longer an outlier week). I refreshed the long side just enough to have an interest in NVDA either pulling back under $129 or zipping to $135 by the end of the coming week. Other semiconductor stocks and the ETF, SMH delivered clean profits. Semis are truly the place to be right now.
Apple Inc (AAPL) woke up in a big way last week. After earnings last month, AAPL steadily rose into its annual Worldwide Developer’s Conference (WWDC). On the previous Friday I kicked myself for missing a quick rebound. My Apple Trading Model (ATM) triggers on any weakness on a Thursday or a Friday. If I had bought my regular call options on Thursday, I would have taken profits on that previous Friday.
So, when AAPL faded on Monday, I happily took the second chance to buy call options. I expected a sell-the-news reaction to the start of WWDC. The next day’s 7.3% surge took me completely by surprise. Investors and analysts suddenly concluded that Apple Intelligence is actually an awesome and groundbreaking development after all. I took profits on my call option after AAPL was up about 2% on the day. Needless to say, I watched the NVDA-like rise in AAPL with stunned anguish. I could barely collect myself as AAPL continued to soar the next day. Calendar call spreads became my trade of choice to reduce the cost and risk of chasing the momentum. I flipped one spread for a small profit and go into this week with the surviving long sides of two other call calendar spreads: weekly strikes at $215 and $222.50.
It is hard to record lessons from this experience because these price dynamics are such extreme outliers for AAPL. Extrapolating from extremes is worse than missing a trade on extremes. However, I am now going to trade AAPL a little more aggressively until this fever breaks. Under normal circumstances, I would assume the sharp fade from $220 signaled a top.

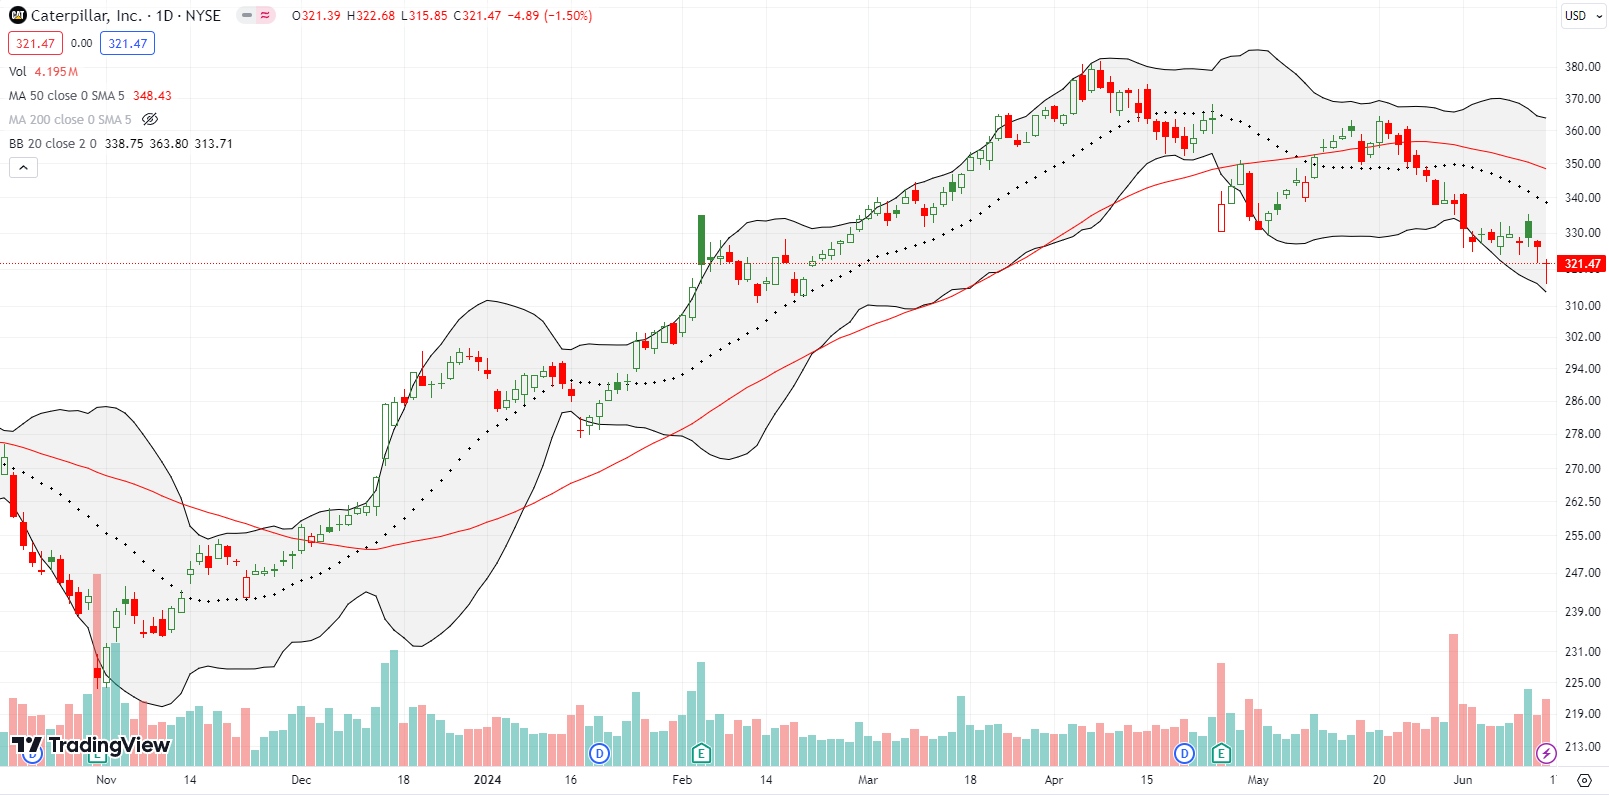
If NVDA and AAPL are poster children for the positive side of the bearish divergence that is too strong to ignore, then Caterpillar, Inc (CAT) is a poster stock for the victim side of the bearish divergence. CAT topped out in April after a strong run for the year. The stock lost 7.0% after April earnings, but buyers slowly filled the gap 3 weeks later with two brief 50DMA breakouts. CAT has traded mostly downhill since then. On Friday CAT traded down as much as 3% before buyers rallied the stock back to its open. Still, CAT closed at a 4-month low and looks set to continue its contribution to the negative side of the bearish divergence too strong to ignore.
I took profits on a put option and bought an outlier put with a $310 strike price.
Zoom Video Communications, Inc (ZM) is another victim of the bearish divergence. While the big boys enjoyed all-time highs last week, sellers suddenly overwhelmed ZM with a 3-day selling spree. The week ended with an all-time low for ZM. Until last week, I held out expectations that ZM would recapture the imaginations of traders and investors for at least one last good rally. After all, this one-time pandemic darling almost reached $600/share in 2020! Instead, ZM has continued to disappoint in a slow grind for almost two years. ZM is one of the many stocks that Cathie Wood and company continue to champion despite awful performance. Accordingly, stocks like ZM have ground down ARK ETFs like ARKK, now down around 18% year-to-date, into a bearish divergence that is definitely too strong to ignore! (I am overdue for an update on how I am handling the ARK ETF trading strategy).
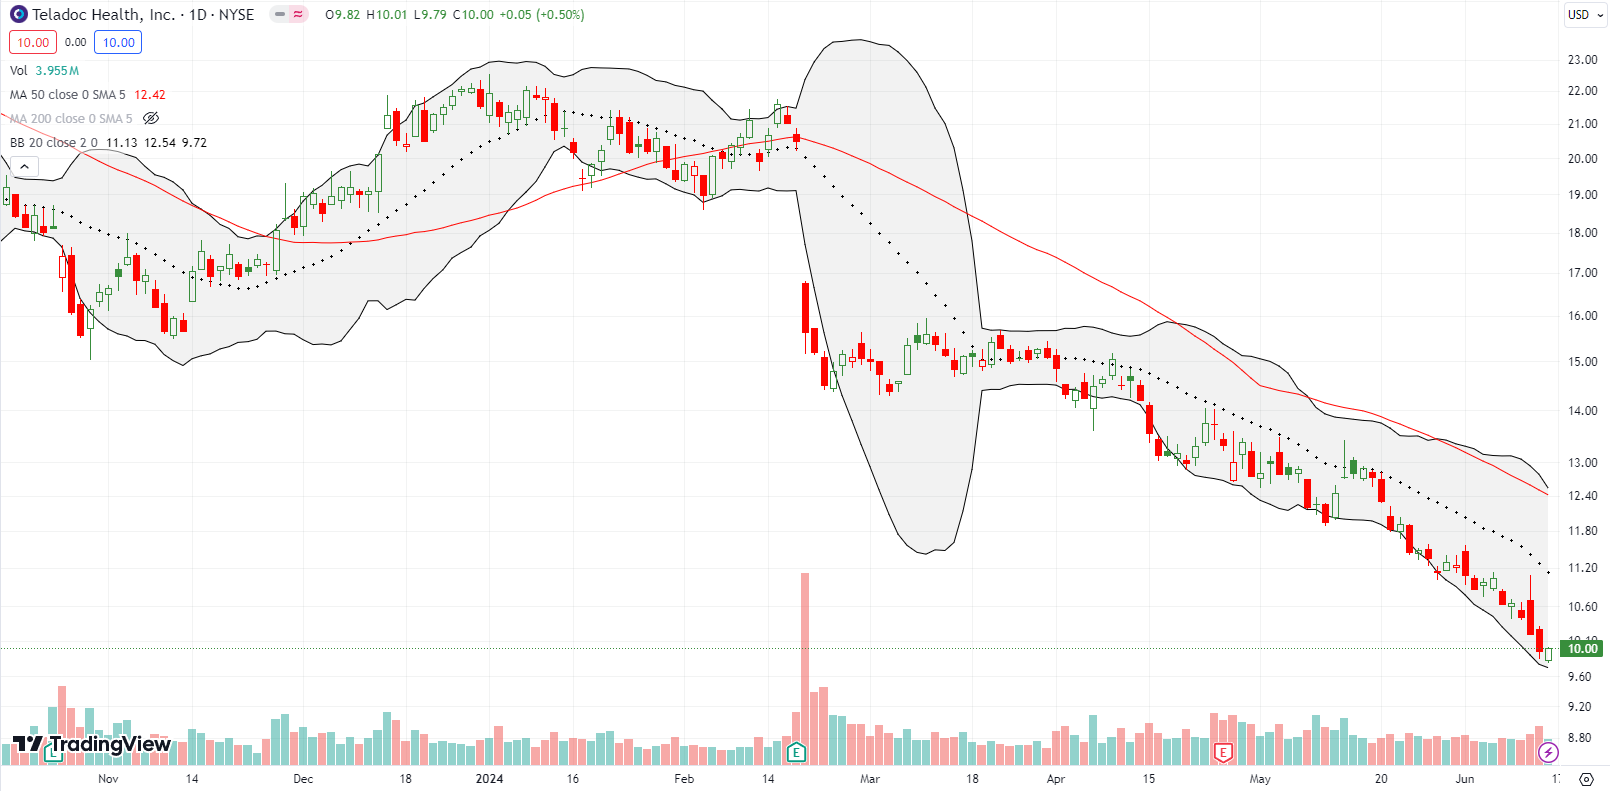
Like ZM, virtual health services company Teledoc Health, Inc (TDOC) was a pandemic darling. TDOC enjoyed one last spurt to $300 in February 2021 before collapsing. In the summer of 2023 I traded on what looked like a technical bottom. Last February, I gave up on TDOC…and thank goodness. The stock is down another 33% since then. Meanwhile, Cathie Wood continues to cling to TDOC. Thus, again like ZM and so many other dying stocks, TDOC is contributing to the bearish divergence that is too strong to ignore for the ARK family. TDOC is testing all-time lows set in 2016.
Dave & Buster’s Entertainment Inc (PLAY) clearly exhausted itself with April’s 10.1% post-earnings pop. PLAY has slid downhill ever since, including last week’s 10.9% post-earnings loss. I am always befuddled by such dramatic changes in investor reactions to earnings. In two months PLAY has shifted from a 7-year high to a new low for the year. If PLAY manages to trade all the way down to the bottom of the previous trading range (around $30-31), I will consider getting back into my old PLAY trade on insider buying.

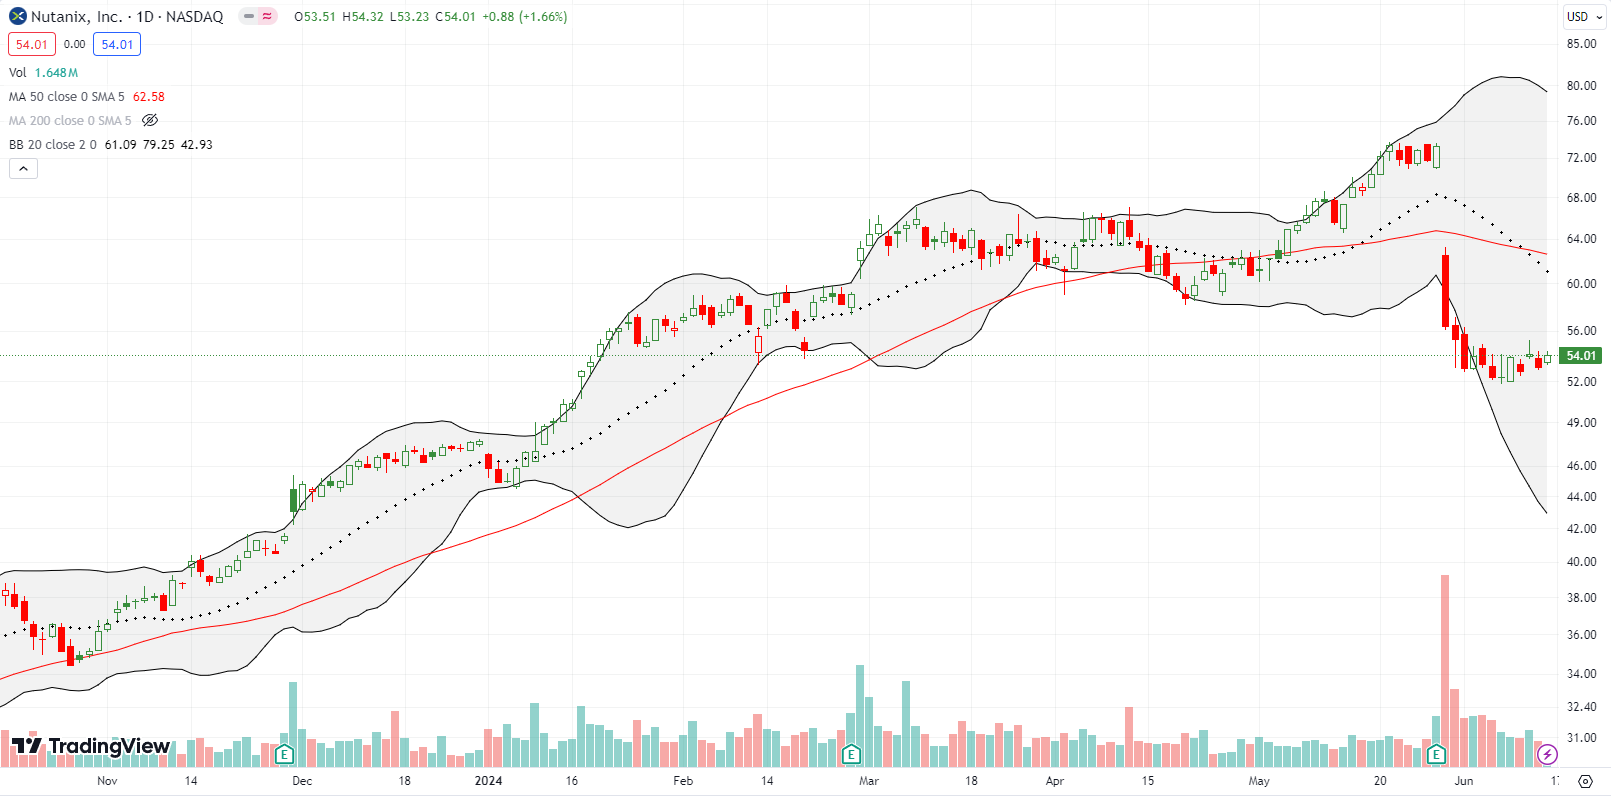
I missed this year’s resurgence for Nutanix, Inc (NTNX). I am a big fan of the stock and even assumed the company would get bought out by now. Fast-forward to last month’s 23% post-earnings plunge, and NTNX finally looks topped out for now. Tightening enterprise IT budgets promise to keep a lid on NTNX for a while.
Software for human resources (HR) departments has suffered recently. Paycom Software (PAYC) collapsed 38.5% last November and made a feeble attempt to recover from that post-earnings disaster. The stock drifted up and then drifted down to last week’s 5 1/2 year low. I bought a June $140 put to speculate on a quick resumption of the selling. This is the kind of stock to short except that any moment some hedge fund or big money institution could speculate on an acquisition to take the company private. On a trailing basis, PAYC trades at 4.7 price/sales and is thus close to the “discount” levels that attract acquirers.

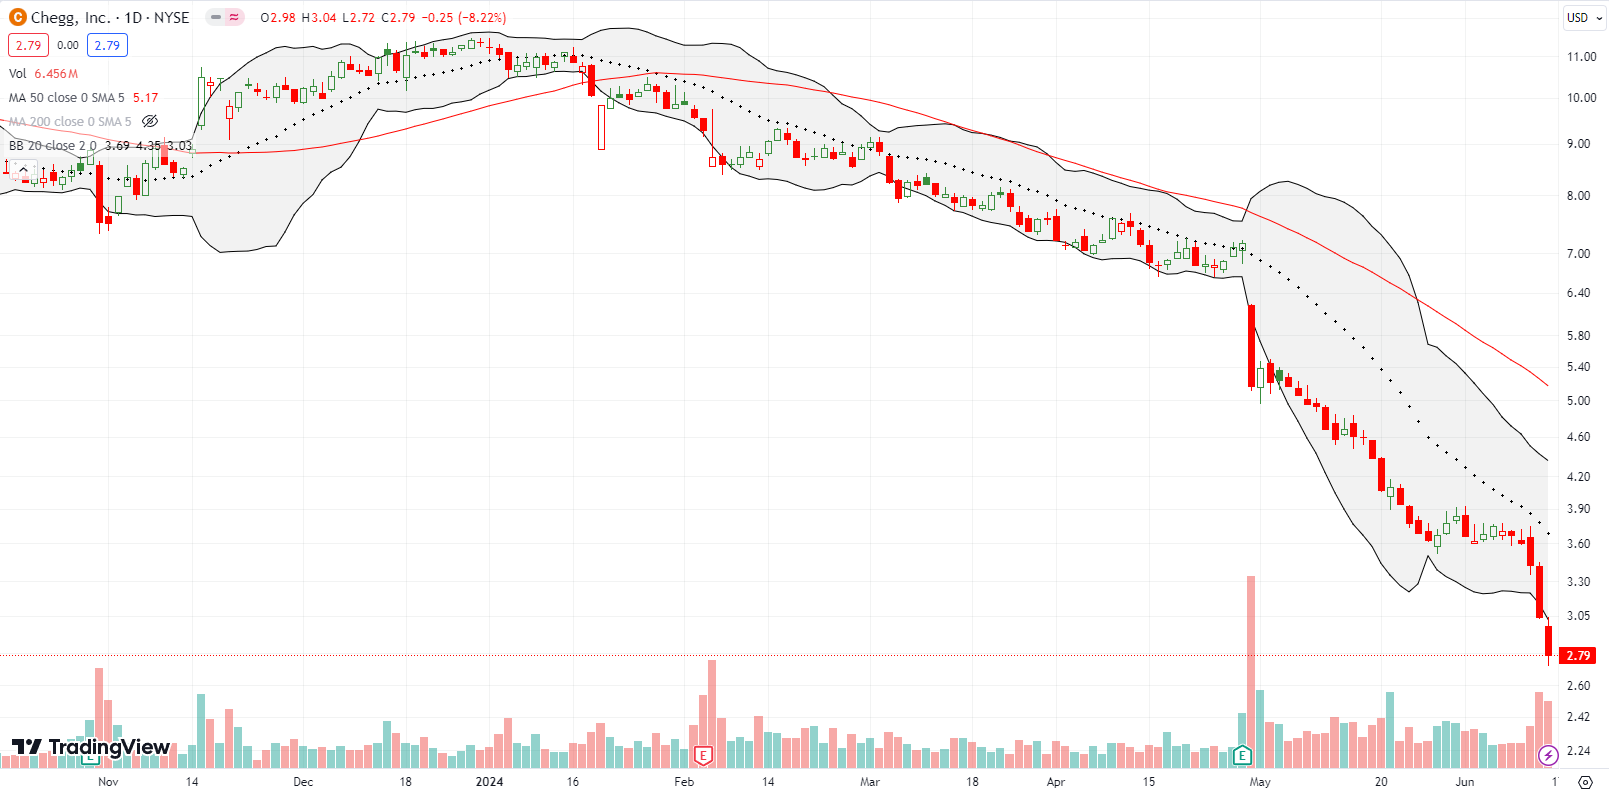
The entire online/virtual learning space has been in near freefall for the past two years or so. Like ZM and TDOC, these darlings of the pandemic have unraveled. The hope and expectation that the pandemic opened up new opportunities for remote learning simply have failed to materialize. Now, companies like Chegg, Inc (CHGG) are performing below pre-pandemic levels. Last month, CHGG set an all-time low after cracking support in place in 2016. The selling accelerated from there and especially last week. I made the mistake of believing management when I wrote bullishly about the potential for a turnaround over 2 years ago. After a post-earnings collapse in May, 2022 I started to get cold feet. I finally abandoned ship earlier this year.
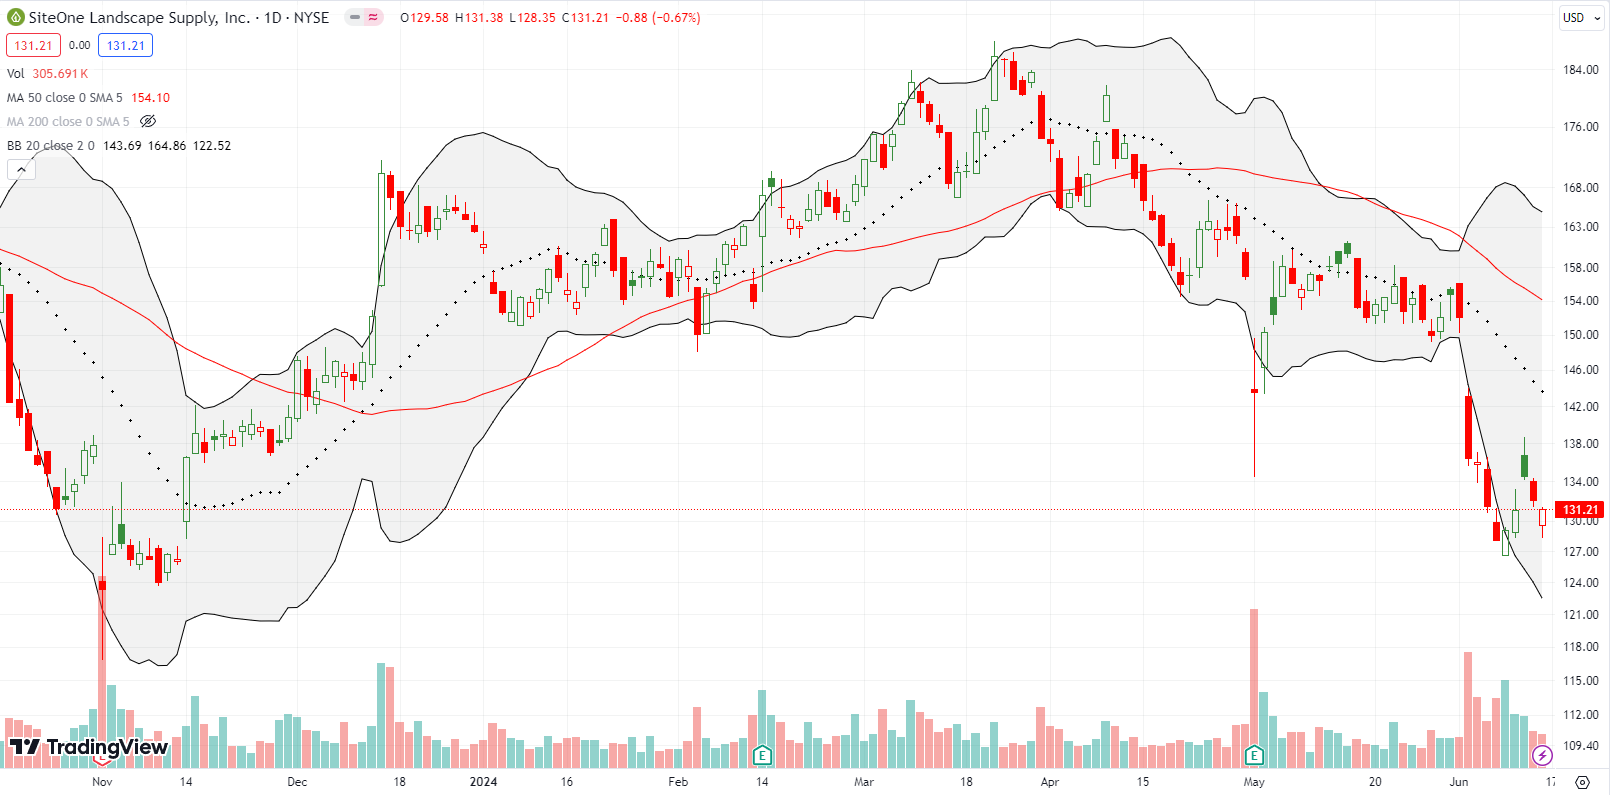
SiteOne Landscape Supply, Inc (SITE) is a recent find. Despite my vigilant study of the housing market and related stocks, I continue to find names like this that somehow avoided by my radar in recent years. SITE dropped 8.5% post-earnings last month, promptly recovered all those losses and then some, and gapped down June 4th along with a sector-wide sell-off. Unlike other housing-related stocks, SITE has yet to recover from that pullback. Something tells me the stock will test its October low in due time.

Be careful out there!
Footnotes
Subscribe for free to get email notifications of future posts!
“Above the 50” (AT50) uses the percentage of stocks trading above their respective 50-day moving averages (DMAs) to measure breadth in the stock market. Breadth defines the distribution of participation in a rally or sell-off. As a result, AT50 identifies extremes in market sentiment that are likely to reverse. Above the 50 is my alternative name for “MMFI” which is a symbol TradingView.com and other chart vendors use for this breadth indicator. Learn more about AT50 on my Market Breadth Resource Page. AT200, or MMTH, measures the percentage of stocks trading above their respective 200DMAs.
Active AT50 (MMFI) periods: Day #141 over 20%, Day #40 over 30% (overperiod), Day #1 under 40% (underperiod ending 30 days above 40%), Day #10 under 50%, Day #19 under 60%, Day #108 under 70%
Source for charts unless otherwise noted: TradingView.com
Full disclosure: long IWM calls, long SPY puts and put spread, long AAPL calls, short NVDA call spread and long call spread, long CAT put
FOLLOW Dr. Duru’s commentary on financial markets via StockTwits, Twitter, and even Instagram!
*Charting notes: Stock prices are not adjusted for dividends. Candlestick charts use hollow bodies: open candles indicate a close higher than the open, filled candles indicate an open higher than the close.


