Stock Market Commentary
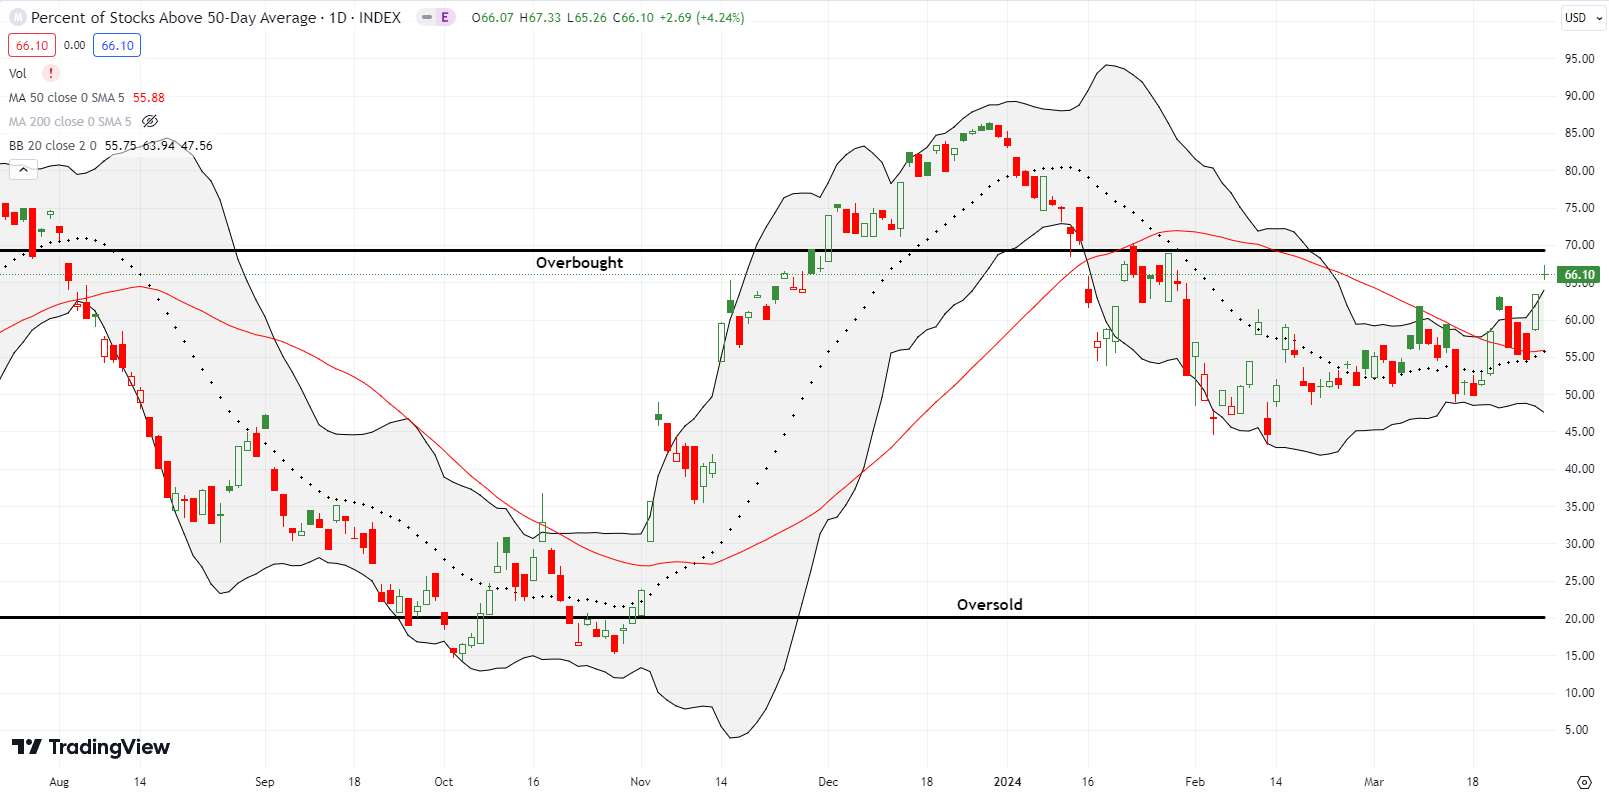
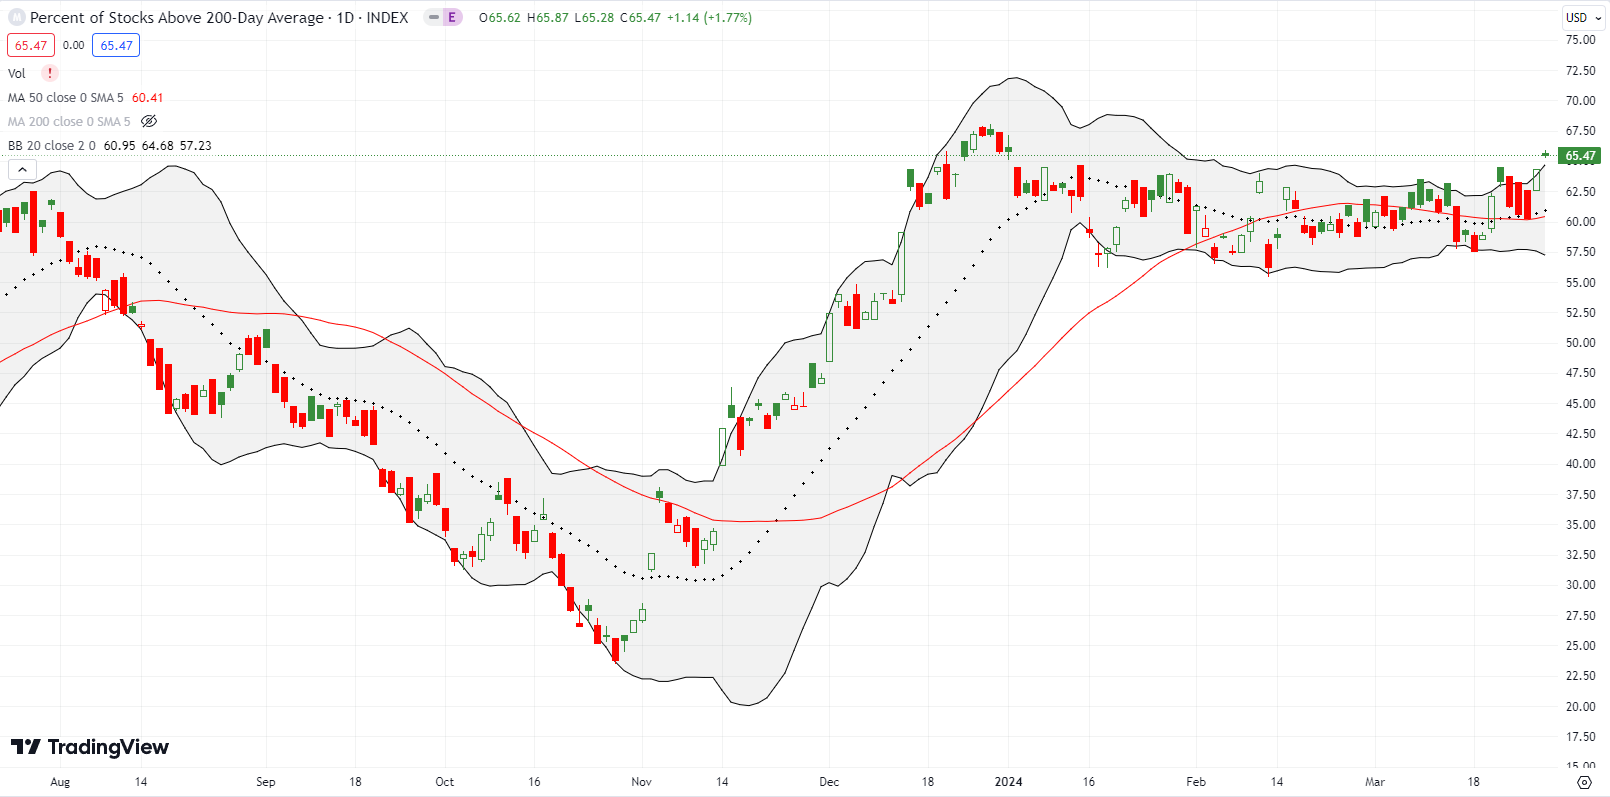
The stock market put an exclamation point on the end of the previous week’s statement performance. Market breadth made an important breakout to a 2-month high and almost looks ready to return to overbought conditions. Such a milestone would finally align my favorite technical indicator with the relentless strength in the stock market.
Q1 delivered one of those market moments which challenged my trading rules on market breadth. The rules remain the same, but I did create a new short-term trading call: “skeptical.” My skepticism facilitated a constructive and functional approach to trading while maintaining my wariness (be ready, so you don’t have to get ready). Let’s review an absolutely astounding quarter of trading action.
The Stock Market Indices
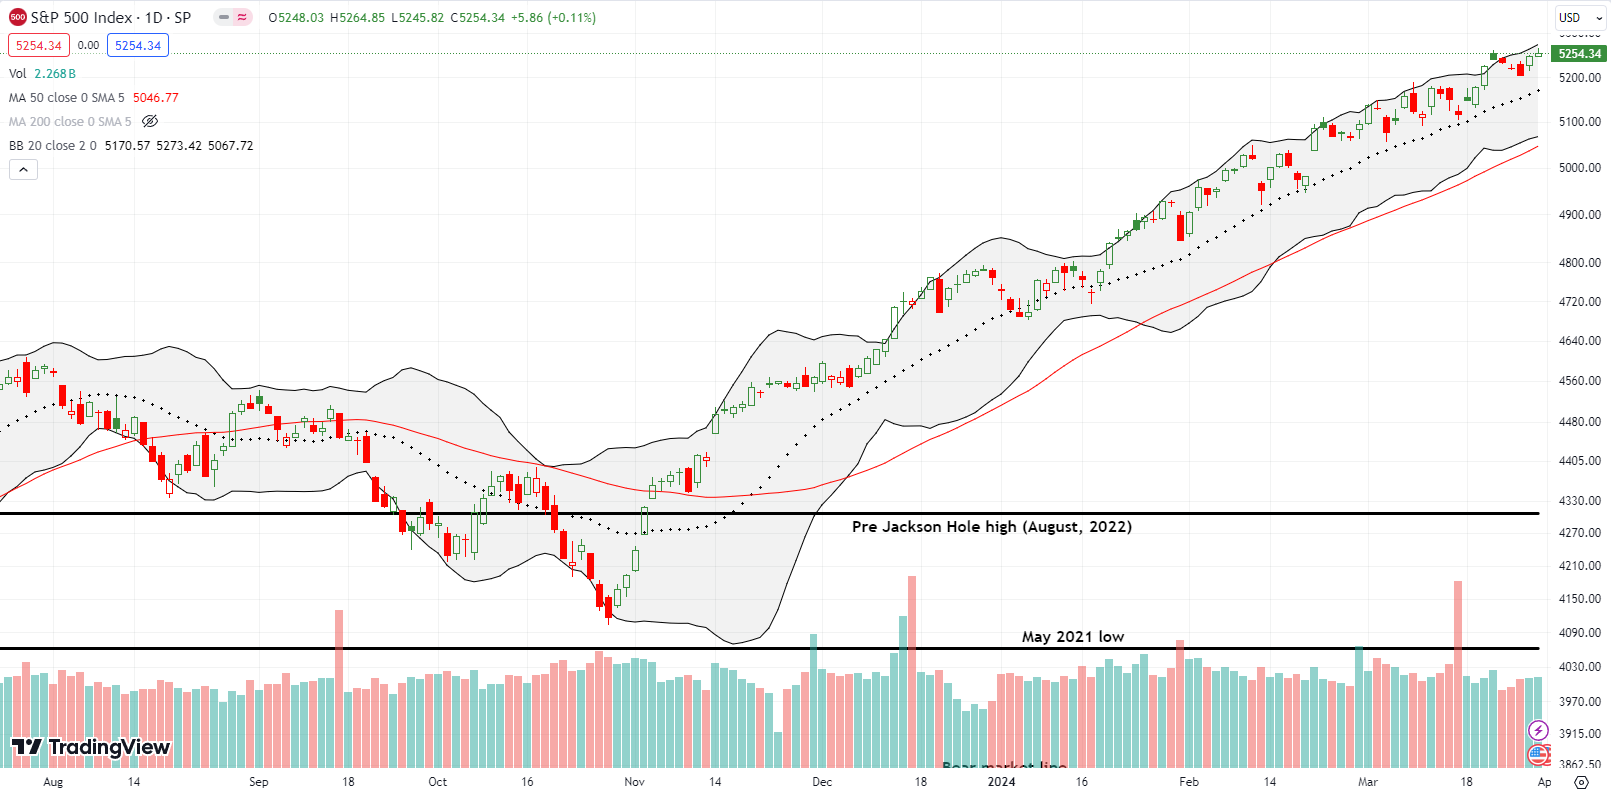
The S&P 500 (SPY) gained 10.1% for Q1. This performance contrasts sharply with the rough start to the year. The index’s relentless rally since that momentary weakness makes all that handwringing seem so misplaced! There are many ways to measure the index’s startling strength. I marvel at the shallowness of the periodic pullbacks, almost each one marked by technical warning signs. The 20-day moving average (DMA) (the dotted line below) has provided firm support with the S&P 500 closing below this line only TWICE all year. I am also amazed that this strength never returned market breadth to overbought trading conditions.
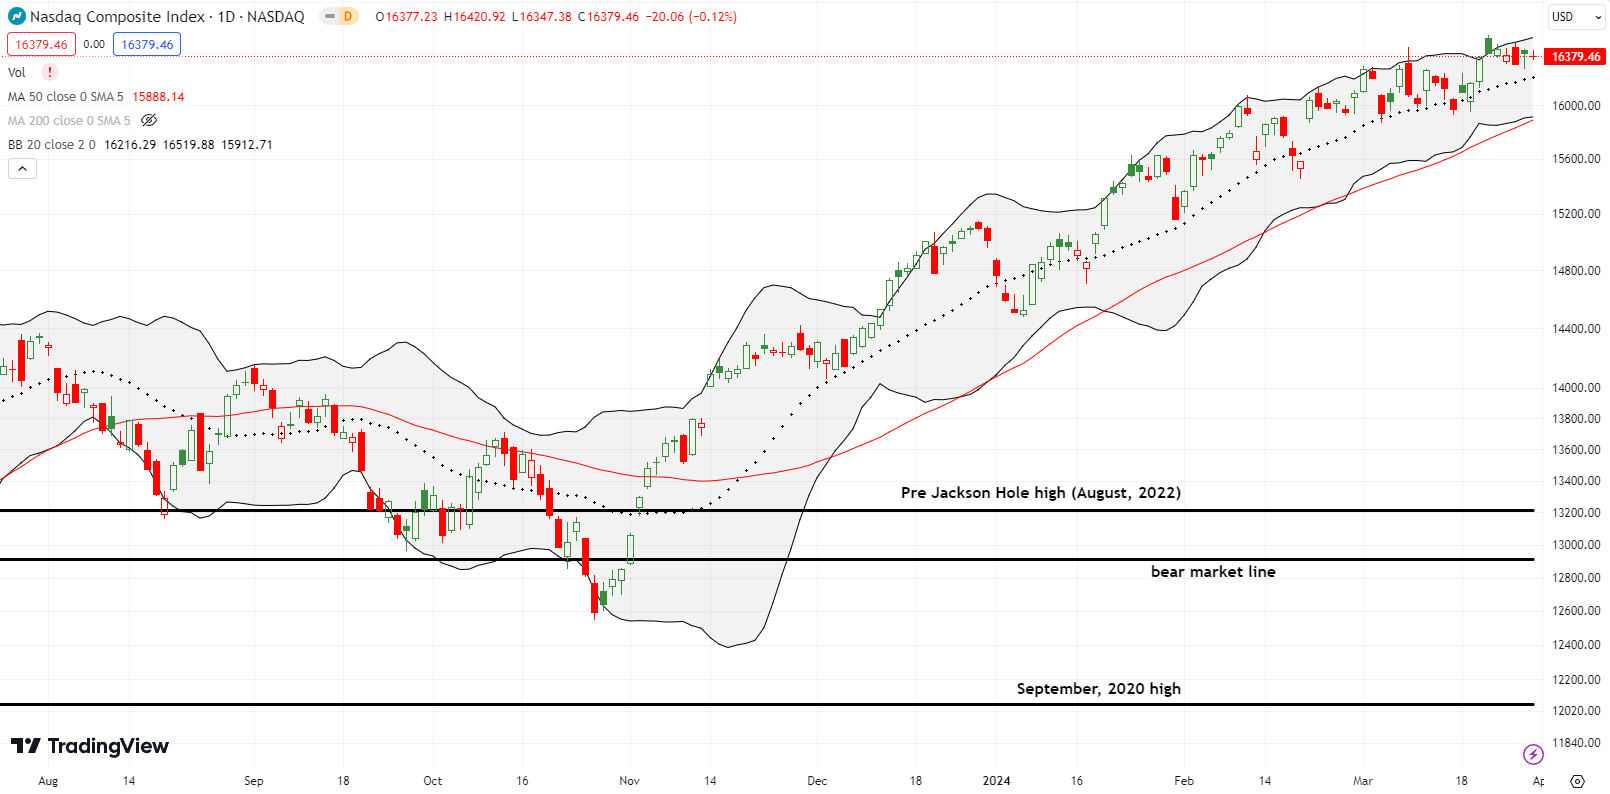
The NASDAQ (COMPQ) enjoyed a strong quarter. The tech-laden index’s 9.1% gain for Q1 was supported by an uptrending 20DMA. The NASDAQ has just 6 closes below the 20DMA this year and half of those were in January. The NASDAQ spent the last week of Q1 churning nowhere after setting an all-time high the week before.
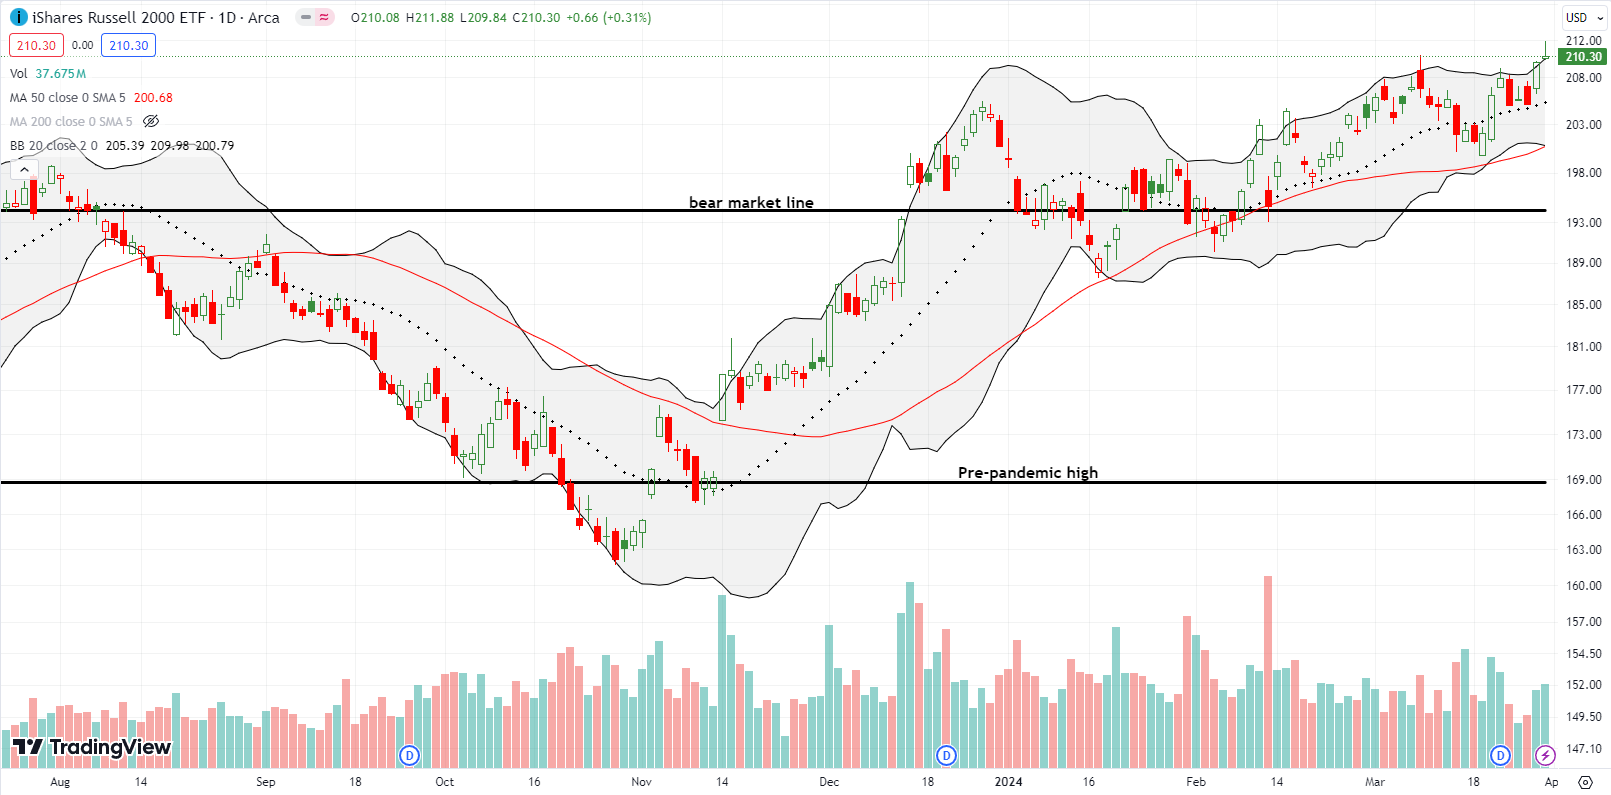
The iShares Russell 2000 ETF (IWM) is an on-going laggard but ended Q1 with a breakout to a 2-year high. This important breakout holds out the prospect of finally pushing market breadth back into overbought territory. IWM is up a respectable 4.8% for the year and offers catch-up potential. The 50DMA (the red line) has been IWM’s comfort blanket providing ample and consistent support. I took profits on my last IWM call on Wednesday.
The Short-Term Trading Call With An Important Breakout
- AT50 (MMFI) = 66.1% of stocks are trading above their respective 50-day moving averages
- AT200 (MMTH) = 65.5% of stocks are trading above their respective 200-day moving averages
- Short-term Trading Call: skeptical
AT50 (MMFI), the percentage of stocks trading above their respective 50DMAs, closed at 66.1% after making an important breakout to a 2-month high. My favorite technical indicator looks ready for a long overdue return to overbought conditions. This year’s divergence between AT50 and the S&P 500 for much of this year kept me skeptical about the rally. Now, market breadth looks ready to make the final mockery of my refusal to return to bullishness. Needless to say, even if AT50 flashes another bearish signal by fading from the overbought threshold, I will not feel pressed to flip to a bearish short-term trading call!
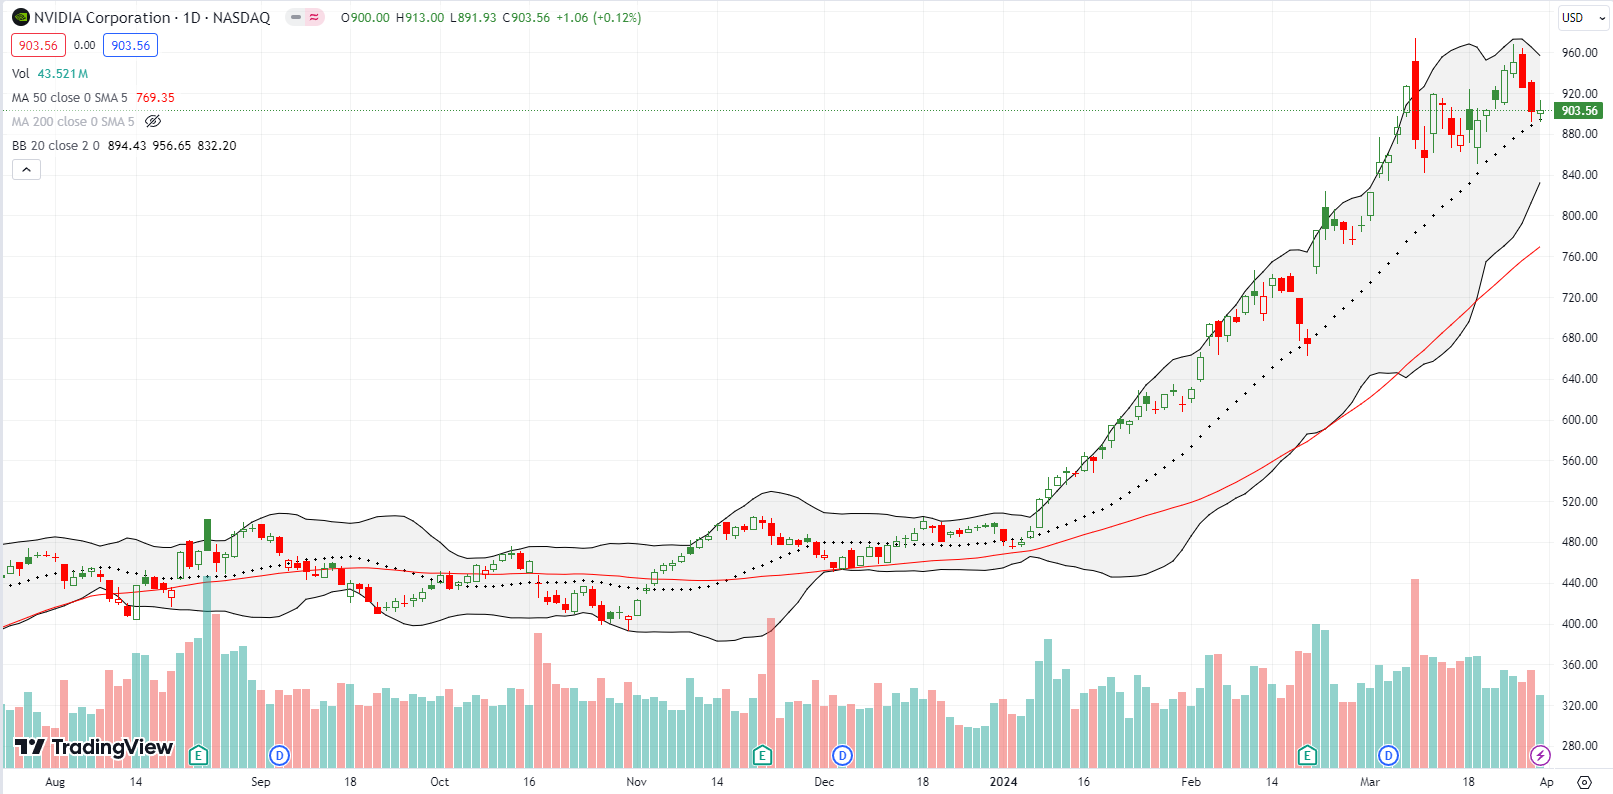
By rule, I turned bullish during the last overbought period at the October lows. I turned neutral a month later and found myself chasing the resumption of strength in December. I finally flipped bearish in mid-January, but the technicals never provided an opportunity to get aggressive; I waited and waited in vain for a convincing breakdown below 20DMA support. That persistent support eventually forced me to create a new trading call, “skeptical”, to reflect a more functional deference to the price action despite the lack of confirmation from market breadth. The all-mighty NVDA stands out as one of the bigger bulldozers pushing past market breadth.
Ironically, while market breadth printed an important breakout, NVIDIA Corporation (NVDA) ended Q1 after stopping just short of invalidating its major topping signal. In the process, NVDA created a potential double-top…awaiting confirmation. At the end of Q1, NVDA tested its 20DMA support for the fourth time this year. If NVDA actually closes lower, the technical flavor of the market will sour just a bit. If NVDA closes below the last lows, around $840, suddenly a quick test of 50DMA support comes into play. Another automatic bounce off the 20DMA will push me to buy into NVDA as a part of the generative AI trade. (I am already long a call spread for the VanEck Semiconductor ETF (SMH)).
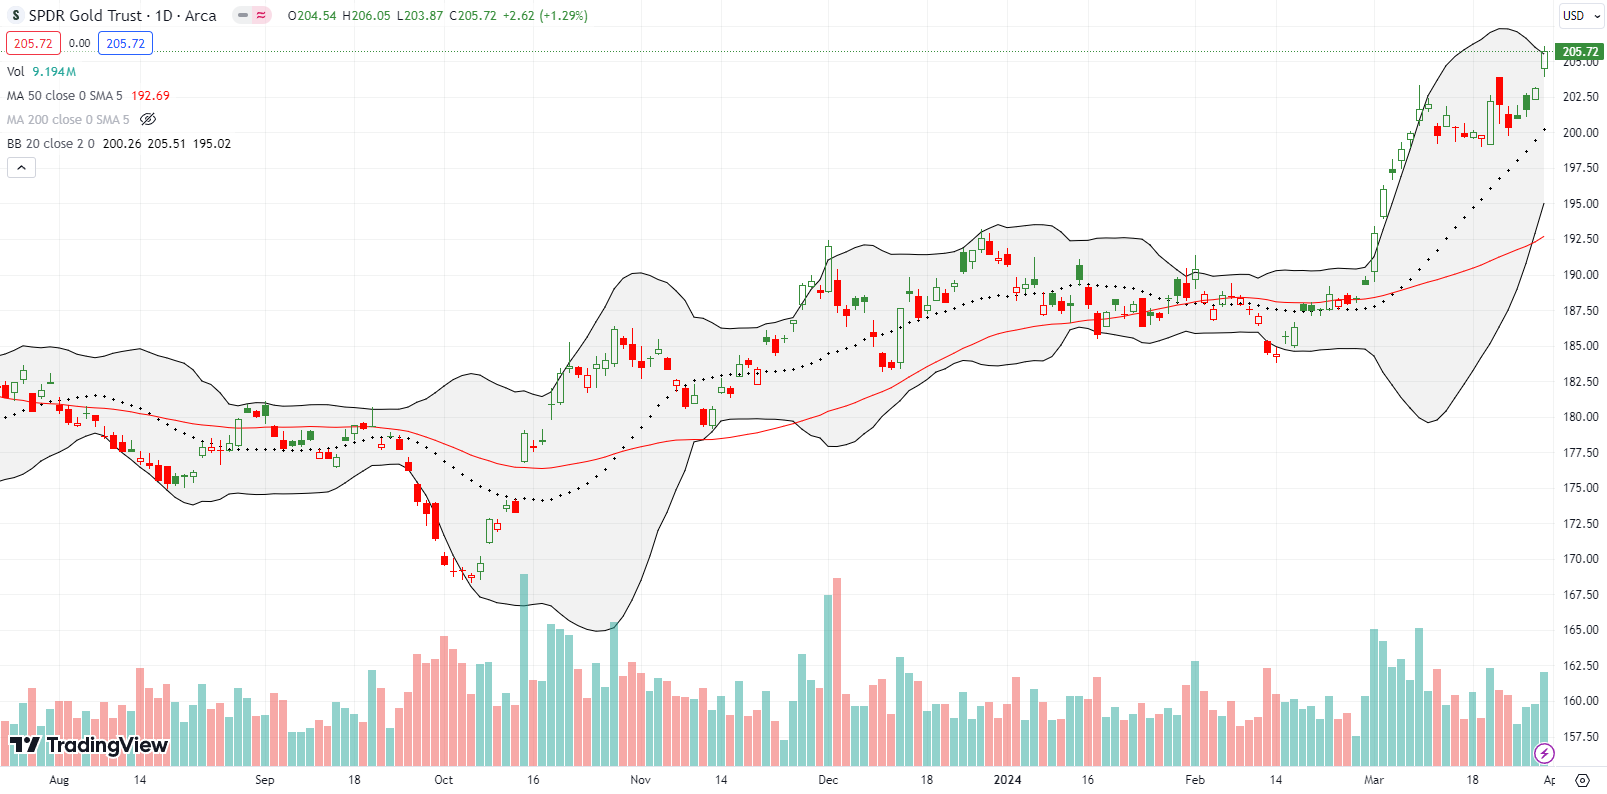
The SPDR Gold Trust (GLD) fell asleep the first two months of the year and woke up bigtime in March. GLD gained 8.7% for the month after a dovish Federal Reserve breathed new life into the breakout. Technicians will notice a Bollinger Band (BB) squeeze forming (see how the solid black lines are tightening around the price action?) with GLD on the verge of making a bullish resolution of the squeeze to the upside. I returned to trading around my core GLD position by adding shares in Sprott Physical Gold Trust (PHYS) which is 100% backed by physical gold. I will next look to GLD call options.
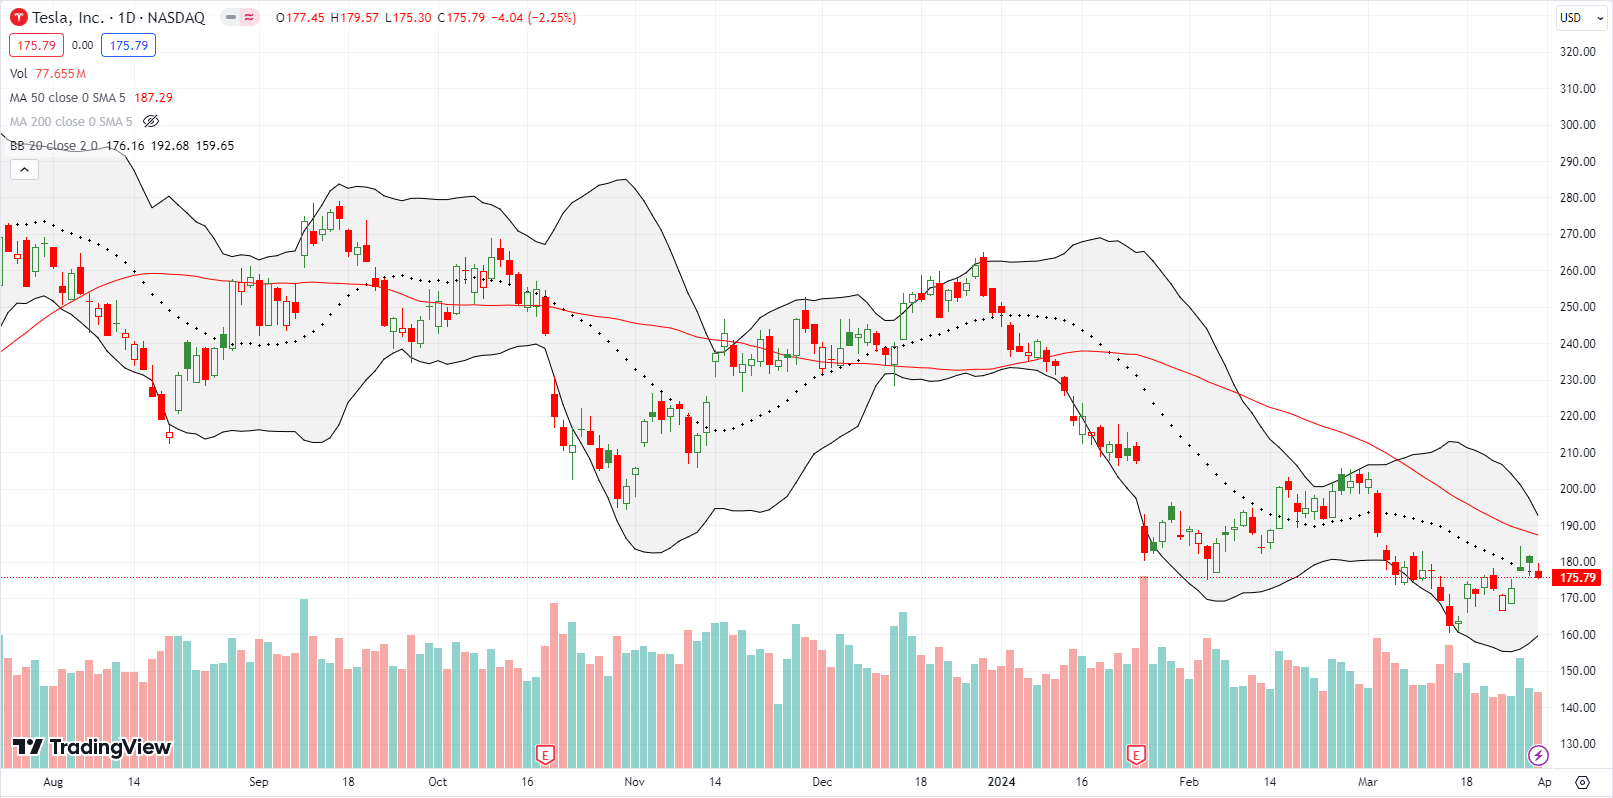
I had to see it to believe it. Strength in Tesla, Inc (TSLA) long served to confirm speculative or bullish sentiment in the stock market. TSLA so often benefited from buying on good news and buying on bad news. However, these days bad news for TSLA actually translates into sustained bad news for the stock price (price cuts, declining margins, competitive pressures). While the major indices relentlessly drove higher in Q1, TSLA spun out with a 29.3% year-to-date loss. A declining 50DMA defines the downtrend with the 20DMA serving as a periodic reminder. I am particularly impressed with the market’s ability to leave TSLA so far behind.
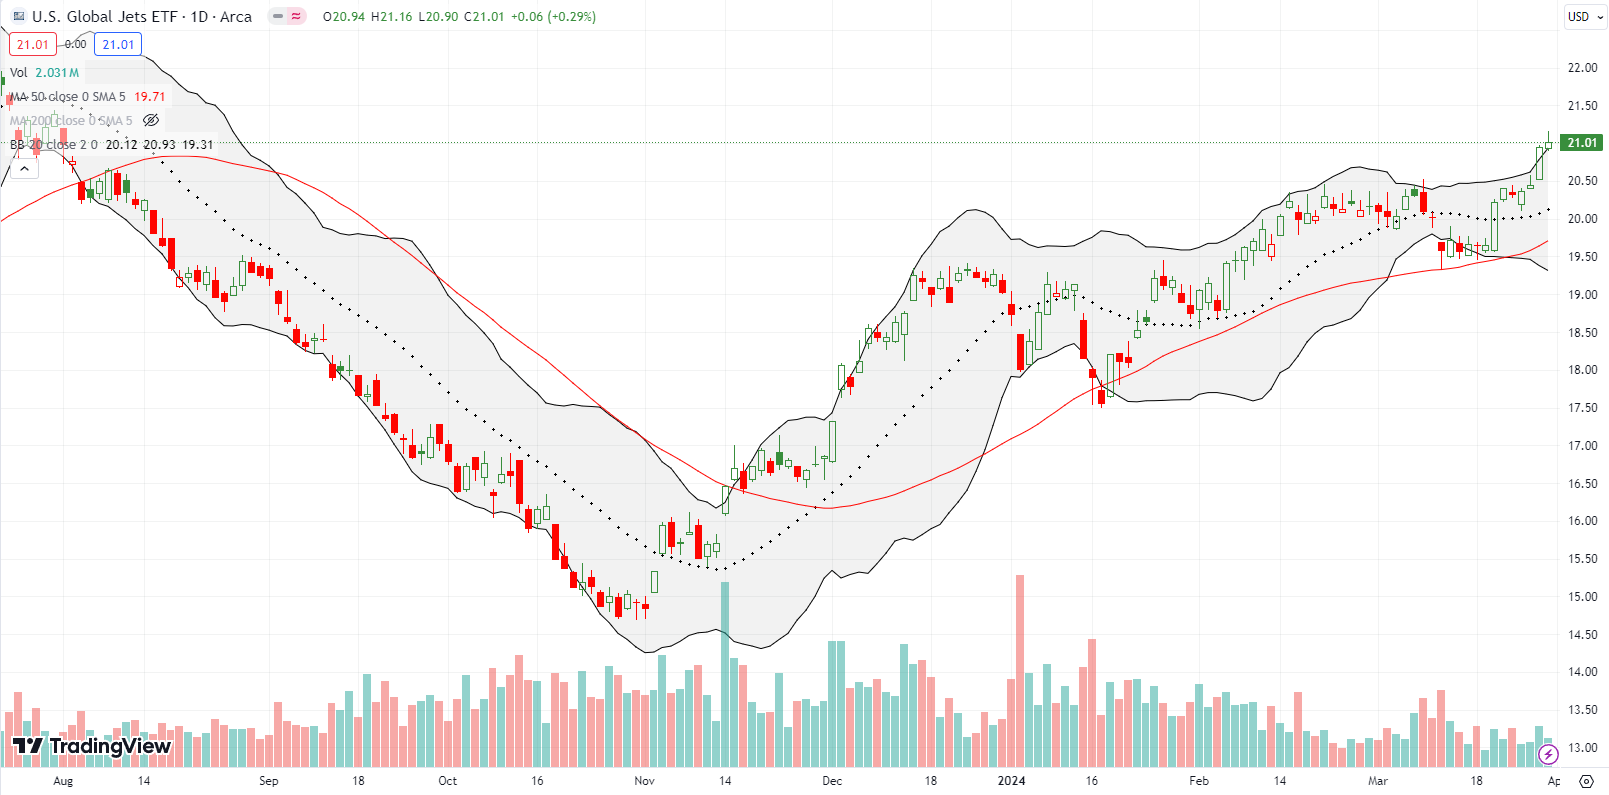
I stopped looking at U.S. Global Jets ETF (JETS) a long time ago. But the ETF of airline stocks is vying for attention with a sneaky breakout in March to an 8-month high. I cannot imagine JETS soaring over last summer’s high around $22 anytime soon. Still, this development intrigues me as a testament to expanding market breadth.
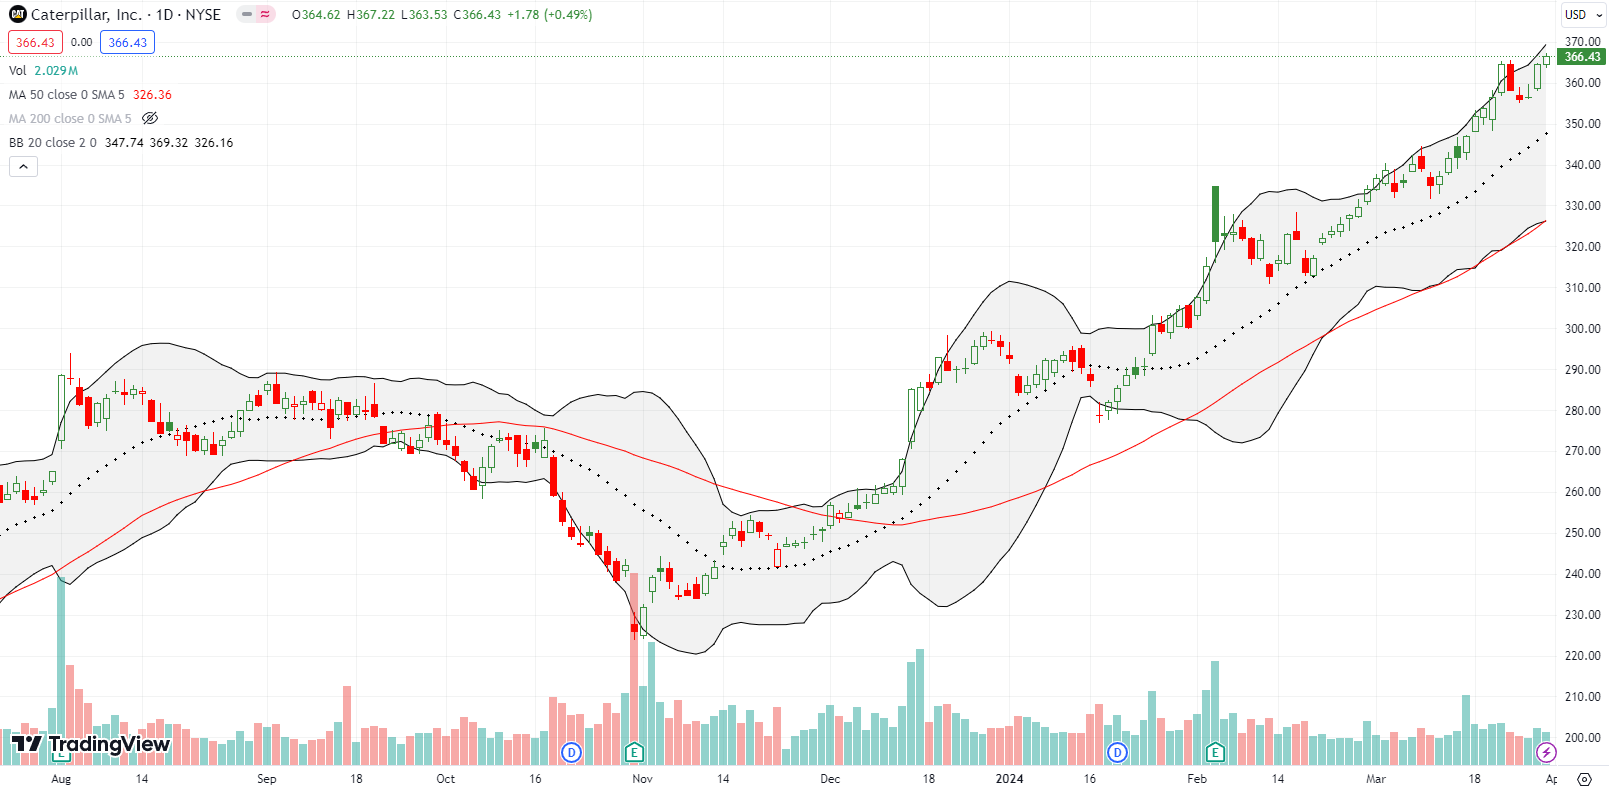
My favorite hedge against bullishness is just plain bullish. Last week, Caterpillar, Inc (CAT) sucked me into a protective put spread after a second lower close. “Someone” must have a serious accumulation program, because the buying resumed well before any test of important support. CAT closed Q1 at an all-time high.
Be careful out there!
Footnotes
Subscribe for free to get email notifications of future posts!
“Above the 50” (AT50) uses the percentage of stocks trading above their respective 50-day moving averages (DMAs) to measure breadth in the stock market. Breadth defines the distribution of participation in a rally or sell-off. As a result, AT50 identifies extremes in market sentiment that are likely to reverse. Above the 50 is my alternative name for “MMFI” which is a symbol TradingView.com and other chart vendors use for this breadth indicator. Learn more about AT50 on my Market Breadth Resource Page. AT200, or MMTH, measures the percentage of stocks trading above their respective 200DMAs.
Active AT50 (MMFI) periods: Day #87 over 20%, Day #85 over 30%, Day #83 over 40%, Day #31 over 50%, Day #2 over 60% (overperiod), Day #54 under 70% (underperiod)
Source for charts unless otherwise noted: TradingView.com
Full disclosure: long CAT put spread, long SMH call spread, long TSLA, long TSLQ, long GLD, long PHYS
FOLLOW Dr. Duru’s commentary on financial markets via StockTwits, Twitter, and even Instagram!
*Charting notes: Stock prices are not adjusted for dividends. Candlestick charts use hollow bodies: open candles indicate a close higher than the open, filled candles indicate an open higher than the close.


