

Stock Market Commentary
Exactly two weeks ago, the stock market fell out of bed. I called the abrupt move the rally’s third strike. However, buyers jumped right back into the fray and overcame that third strike with a rally right to the second to last trading day of the year. So far, the new year has brought a swell of selling which has the “smell” of pent-up profit-taking. I have to guess traders and investors sat on their hands last month as they eagerly awaited the new year to keep capital gains off the books for 2023 taxes.
The short year has delivered plenty of excuses for sellers and bears looking for reasons to bail on stocks: a slight increase in rates (which started to reverse today), “not so dovish” minutes from the Federal Reserve (no surprise there), and sour headlines over a non-news report on the Job Openings and Labor Turnover Survey (JOLTS). Yet, none of these reasons matter until the bears and sellers manage to push the stock market out of overbought conditions.
(Reminder! The One-Twenty Two Holiday Contest and Giveaway ends January 7th!)
The Stock Market Indices
The S&P 500 (SPY) lost steam the last trading day of 2023. The first two trading days of the year have delivered an “orderly” test of support at the 20-day moving average (DMA) (the dotted line). The close also coincides with the close from the index’s third strike on December 20th, an important roundtrip during this extended overbought rally.
If 20DMA support fails, the remaining gains from December would be in jeopardy. Given this 20DMA test is the first of the rally, I went ahead and bought an SPY monthly $475 calendar call spread. This configuration should work well unless the stock market actually printed a sustained top last week. In other words, I am betting that the current selling is simple profit-taking in the middle of an extended overbought rally.
")
The NASDAQ (COMPQ) made a case against simple profit-taking and made a case for a more sustained top. Sellers managed to gap the tech laden index below 20DMA support for a fourth day in a row of selling. Thus, the NASDAQ already looks set up to reverse the rest of its December gains. Note how the NASDAQ closed just above its breakout point where it resolved a Bollinger Band (BB) squeeze to the upside (follow the red dashed line from the right to the left). In my previous Market Breadth, I observed a “beckoning” 20DMA. The NASDAQ barely stopped long enough to say hello!
")
The iShares Russell 2000 ETF (IWM) made the most convincing case for a top as it roundtripped back to its bear market line. The ETF of small caps closed slightly below its 20DMA and perched precariously right on top of its bear market line. I previously assumed IWM was finally finished with its bear market. A lower close from here will not only put the 50DMA (the solid red line) into play as support, but also will catalyze a swift end to the overbought period. Still, I took a speculative swing at a slightly diagonal weekly call spread. The 200/199 spread was just a way to lower the cost of speculating on a recovery from profit-taking by next week.
")
The Short-Term Trading Call With Profit-Taking
- AT50 (MMFI) = 79.4% of stocks are trading above their respective 50-day moving averages (22nd overbought day)
- AT200 (MMTH) = 62.2% of stocks are trading above their respective 200-day moving averages
- Short-term Trading Call: neutral
AT50 (MMFI), the percentage of stocks trading above their respective 50DMAs, closed at 79.4% for a 22nd straight day in overbought territory (above the 70% threshold). My favorite technical indicator took a roundtrip back to its important low two weeks ago.
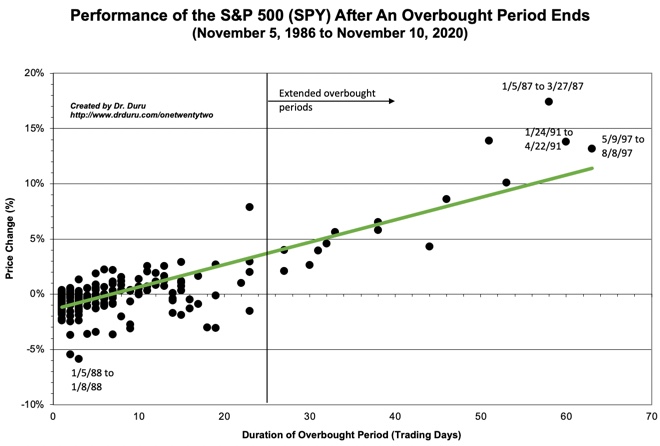
The S&P 500 has only lost 1.6% from its last peak, but the sudden reversal in fortunes makes sentiment feel a lot worse. The index is now up 2.9% since the overbought period started. Per the chart below, the odds favor an exit from overbought territory with a gain. However, to achieve gains commensurate with historical patterns, the overbought period needs to last longer. This historical behavior is another reason I am already looking for buying opportunities in the middle of the current profit-taking. (Note that the CNN Fear & Greed Index as cooled similarly to AT50 from extreme greed to greed).
Of course, I could be very wrong! Fortunately, the duality of my neutral short-term trading call on the stock market motivated me to act on the “Be Ready” part of the stock market’s tension (see the “A Remarkable Year Ends With Signature Stock Market Moments – The Market Breadth” for more details). I took profits on most of my hedges into the selling which gives me a sentiment buffer to speculate against the selling pressure. The charts below explore more of my thinking on the tensions between the “Cathie Wood Market” and the “Be Ready So You Don’t Have to Get Ready Market.”
The ARK Innovation ETF (ARKK) found no support at its 20DMA. The swift selling pressure on Cathie Wood’s flagship ETF has taken this core vehicle of speculation within a day’s selling of fully reversing all of December’s gains. ARKK is already below its previous high for 2023 set last July. Such is the mercurial nature of speculation.
Per my strategy, I executed another leg of my covered call strategy by buying shares and selling a weekly call against them. My existing position will certainly have its short call expire worthless this Friday. The presumed support at the 50DMA would be the last spot for me to take one more swing.
")
Apple Inc (AAPL) is the big sentiment killer of 2024 so far, even more so than ARK’s slide below the highs of 2023. A downgrade of AAPL featuring a meaningless change in a bearish price target set off an explosion of selling. AAPL gapped down right to its 50DMA and closed below it for a 3.6% loss for the day. AAPL’s remaining December gains evaporated in the blink of an eye. The trail of destruction left behind a potential double-top in its wake. Over these past two days I executed what might be my last swing at the Apple Trading Model (ATM) strategy for a while!
")
With profit-taking underway, I checked in on my generative AI plays for a fresh buying opportunity. Advanced Micro Devices Inc (AMD) looked attractive with a near test of 20DMA support and a full reversal of the late run-up the last two weeks 2023. I bought a January 142/150 call spread and added to the long side on today’s 2.4% drop. Like the indices, a failure to hold support here puts 50DMA support into play. (My dip back into Alphabet (GOOG) is doing well so far).
")
In my last Market Breadth post, I pointed out the near parabolic move in Intel Corporation (INTC). I looked forward to the next pullback to 20DMA support. That moment is already here. INTC is on my buy list for the next trading day. I will buy call options if INTC avoids gapping down below its 20DMA.
")
Caterpillar, Inc (CAT) served its role well as my favorite hedge against bullishness. CAT is now also a top member of my “Be Ready” club. I interpreted the stock’s stall last week as an opportunity to jump into a put spread. I took profits on that put spread in today’s selling toward 20DMA support. Note CAT is now slightly below its high from 2023.
")
Uber Technologies, Inc (UBER) looks like a stock for betting on a top. Thus, I have inaugurated it into my “Be Ready” club of stocks to hedge against bullishness. I am looking for any bounce this week to fade with put options. UBER has no “natural” support until its 50DMA.
The tremendous surge in trading volume on December 15th with no (public) news looks ominous given its coincidence with a topping pattern.
")
SEMRush Holdings, Inc (SEMR) took a steep but still relatively orderly plunge right to 20DMA support. I am a fan of the company and the stock. Thus, I am a buyer on a bounce from 20DMA support and a price above today’s intraday high (around $13). I am fine to wait things out if support instead fails.
")
Zoom Video Communications, Inc (ZM) just cannot get out of its own way. I keep thinking ZM will join the ranks of damaged stocks experiencing a rebirth of speculative fury. Instead, ZM hit the same brick wall it hit three times before in 2023. Sellers wasted no time in bailing and sending ZM right to 50DMA support. I am looking for an entry to play the next rally back to resistance.
")
Healthcare stocks took a different road to start the year. In what looks like a sharp case of rotations, SPDR Select Sector Fund (XLV) jumped 1.8% to start the year. That close at a 13-month high makes me think health care will keep the rally cry going further than the duration of the overbought period.
")
")
")
Be careful out there!
Footnotes
Subscribe for free to get email notifications of future posts!
“Above the 50” (AT50) uses the percentage of stocks trading above their respective 50-day moving averages (DMAs) to measure breadth in the stock market. Breadth defines the distribution of participation in a rally or sell-off. As a result, AT50 identifies extremes in market sentiment that are likely to reverse. Above the 50 is my alternative name for “MMFI” which is a symbol TradingView.com and other chart vendors use for this breadth indicator. Learn more about AT50 on my Market Breadth Resource Page. AT200, or MMTH, measures the percentage of stocks trading above their respective 200DMAs.
Active AT50 (MMFI) periods: Day #39 over 20%, Day #37 over 30%, Day #35 over 40%, Day #34 over 50%, Day #31 over 60%, Day #21 over 70% (22nd day overbought)
Source for charts unless otherwise noted: TradingView.com
Full disclosure: long ARKK shares and short calls, long AMD call spread, long IWM diagonal calendar call spread, long SPY calendar call spread, long
FOLLOW Dr. Duru’s commentary on financial markets via StockTwits, Twitter, and even Instagram!
*Charting notes: Stock prices are not adjusted for dividends. Candlestick charts use hollow bodies: open candles indicate a close higher than the open, filled candles indicate an open higher than the close.
If you look at the 5-year S&P chart, you’ll see that the 2023 high failed to break the 2001 (or whenever) high. CNN Fear and Greed Index has been wavering between Extreme Greed (since 12/15) and Greed, with MACD and RSI having a downward movement, at least for now. Supertrend hasn’t given a sell signal for the S&P, yet did so on 12/20 for the Fidelity Large Cap Index Fund, which is comprised of the M7+ stocks. Trimming back on my small positions, so sold the fund, and another. Watching LMT for a sell point. to reduce the number of positions I own. Will have some comments later in the week on my website after the so-called Santa Claus rally officially ends…!
Taking some profits during an overbought period makes a lot of sense so that you can BE READY for the end of the period.