

Stock Market Commentary
Bring on the bears…The process terminating a historically extended overbought period started with the first trading day of the year. While the S&P 500 recovered from the year’s initial fit of selling, small caps did not. The sagging fortunes of small caps have now returned the related ETF to bear market territory. That breakdown also contributed to a decisive slice through market breadth’s overbought threshold.
The lingering strength in the S&P 500 and the NASDAQ means that the post overbought selling cycle could be an extended process. Market breadth could even turn on a dime and challenge the overbought threshold. So even as I declare “bring on the bears”, I am far from announcing the immediate arrival of significant market pain.
The Stock Market Indices
The S&P 500 (SPY) barely acknowledged the blowing of bearish winds. The index lost 0.4% but still managed to bounce off support at the 20-day moving average (DMA) (the dashed line). If not for the end of overbought conditions, I would not even bother writing about this trading action. However, once the 20DMA gives way as support, the S&P 500 will look like it printed a (minor) double top. I still expect the next sell-off to be shallow and well-supported by the uptrending 50DMA (the red line below). Needless to say, I took profits as planned on my calendar call spread.
")
The NASDAQ (COMPQ) also held its 20DMA support. The next test of 50DMA support is on schedule to coincide with a test of the 2024 low.
")
The iShares Russell 2000 ETF (IWM) has caught the focus of ire from the bears of 2024. Unlike the other two major indices, the index of small caps never rebounded from the year’s early sell-off. IWM’s attempt to consolidate below 20DMA resistance came to a decisive end with today’s 1.3% loss. This lower close below the bear market line officially ushers in a fresh bear market period for IWM.
IWM now looks ready to test 50DMA support at the same time it finishes reversing the 3.4% gain that preceded its celebratory, albeit, temporary end to its bear market. The downward turn in the lower Bollinger Band (BB) (the solid black lines carving out two standard deviations price volatility) sealed my deal on a weekly calendar put spread on IWM with the strike sitting right on top of the 50DMA at $187.
")
The Short-Term Trading Call With A Bring on the Bears
- AT50 (MMFI) = 62.3% of stocks are trading above their respective 50-day moving averages (ending 29 days overbought)
- AT200 (MMTH) = 59.2% of stocks are trading above their respective 200-day moving averages
- Short-term Trading Call: cautiously bearish
AT50 (MMFI), the percentage of stocks trading above their respective 50DMAs, plunged from the edge of the overbought threshold to close at 62.3%. This decisive end to the overbought period was sufficient to trigger my rules for flipping bearish. Accordingly, I changed my short-term trading call from neutral to cautiously bearish. The caution is necessary because I do not think the S&P 500 and the NASDAQ will easily or readily follow IWM’s breakdown. Moreover, I expect a shallow sell-off. However, a topping pattern in the longer-term indicator of market breadth, AT200 (MMTH), the percentage of stocks trading above their respective 200DMAs, suggests that further upside is tightly capped in the short-term.
If my favorite technical indicator turns right around and gets back to overbought conditions, I will just as quickly flip neutral. I will only get short-term bullish again on a successful test of 50DMA support by the S&P 500 or on oversold conditions.
I took great interest in the latest prognostication from permabull Tom Lee of Fundstrat. He expects a 7% drawdown after January before the stock market regains its mojo in the second half of the year. He maintains a 5200 target on the S&P 500 and a mouth-watering gain of 40-50% for small caps. I am habitually skeptical of predictions in the stock market. Yet, I cannot help giving these predictions serious consideration since they roughly align to post overbought selling that in turn generates a major buying opportunity during oversold conditions. As always, one-step-at-a-time…
I think of this market as almost entirely trading on monetary policy, so I am assuming monetary policy will be at the center of the market’s excuse to sell. If so, then the March announcement on monetary policy looks like a perfect pivot point. The market still expects the Fed to start cutting in March (62% chance), so I see a lose-lose scenario with either 1) the market selling on the highly anticipated news (oh no, the Fed confirmed it fears a recession is near!), or 2) the market selling on the disappointment of no rate cut (oh no, the Fed is determined to cause a recession in order to completely squash inflation!).

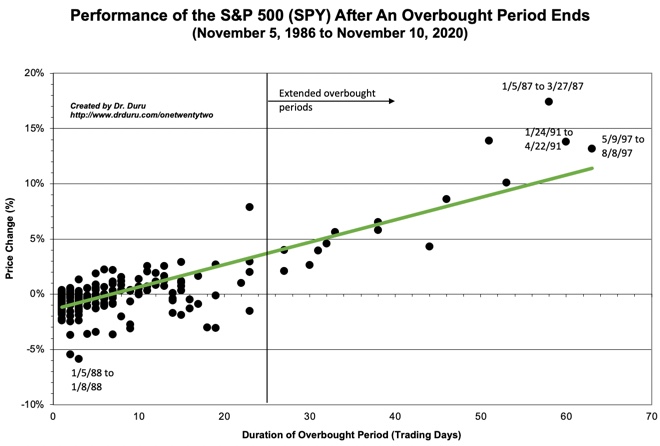
At 29 days long, the last overbought period reached historically extended levels. Per the chart below, only 13 other overbought periods since 1986 lasted longer. Overbought conditions ended with the S&P 500 recording a 3.7% gain over this period. This performance is slightly below the expectations represented by the green line below. Once again we see how the start of an overbought period is NOT an automatic bearish signal (especially for the S&P 500).
In another tale of “live by speculation, die by speculation”, the ARK Innovation ETF (ARKK) significantly underperformed the S&P 500 by the end of the overbought period. Bears who shorted Cathie Wood’s core ETF of speculation at the start of overbought trading are sitting on a 3.6% gain. However, ARK’s 11.4% gain at its overbought peak far outperformed the S&P 500’s 4.1% gain at last week’s overbought peak.
With the current change in fortunes, I am now using my ARKK holdings as a hedge against bearishness. Notably, ARKK essentially lost all its gains from last month and is now teetering on confirming a bearish 50DMA breakdown.
")
I thought I did well by profitably trading Advanced Micro Devices, Inc (AMD) from its rebound away from its 20DMA. Today’s 8.4% surge left me flat footed with empty pockets. My new favorite trade on the generative AI trade did not quite pull back far enough to move me to a fresh buy. AMD’s defiance of the bearish taint in the air is one of many examples of stocks that may very well ignore the market weakness led by small caps…for THIS cycle of selling anyway.
")
")
")
Be careful out there!
Footnotes
Subscribe for free to get email notifications of future posts!
“Above the 50” (AT50) uses the percentage of stocks trading above their respective 50-day moving averages (DMAs) to measure breadth in the stock market. Breadth defines the distribution of participation in a rally or sell-off. As a result, AT50 identifies extremes in market sentiment that are likely to reverse. Above the 50 is my alternative name for “MMFI” which is a symbol TradingView.com and other chart vendors use for this breadth indicator. Learn more about AT50 on my Market Breadth Resource Page. AT200, or MMTH, measures the percentage of stocks trading above their respective 200DMAs.
Active AT50 (MMFI) periods: Day #47 over 20%, Day #45 over 30%, Day #43 over 40%, Day #42 over 50%, Day #39 over 60%, Day #1 under 70% (1st day under 70%, ending 29-day overbought period)
Source for charts unless otherwise noted: TradingView.com
Full disclosure: long ARKK, long IWM calendar put spread
FOLLOW Dr. Duru’s commentary on financial markets via StockTwits, Twitter, and even Instagram!
*Charting notes: Stock prices are not adjusted for dividends. Candlestick charts use hollow bodies: open candles indicate a close higher than the open, filled candles indicate an open higher than the close.
You sure have an interesting writing style. It’s easy to read and understand…
Great! Glad to hear it.