

Housing Market Intro and Summary
What happened in the housing market in March, 2024? Home builders grew more positive and greeted the spring selling season with a resurgence in housing starts. In my previous Housing Market Review, I pointed out breakouts in the stocks of homebuilders and a bottoming in existing home sales. Both developments followed through in the proceeding month. While all the nails and boards are lining up well for builders, I also point to two yellow flags to monitor: sinking new home sales in the South and rising mortgage delinquencies.
- Builder sentiment improved for a fourth straight month to flipped positive for the first time since last July.
- Housing starts rebounded sharply and realigned with positive homebuilder sentiment.
- New home sales remain stable on a month-over-month basis although sales in the South are near levels last seen in the depths of the pandemic.
- Existing home sales confirmed a bottom for this cycle with a surge all the way to an 11-month high.
- A plunge in the median time to sell an existing home in California helped drive home sales to levels last seen in September, 2022.
- FHA (Federal Housing Administration) mortgage loan delinquencies have increased to levels last seen in 2021 and raise a yellow flag over the health of the housing market.
I also take a look at some of the doom gloom from two years ago to now and put the data in context. I get particularly nostalgic looking back at 2022 at predictions of collapse and calamity from 2022.
Housing Stocks
There is no doom and gloom in iShares US Home Construction ETF (ITB). The ETF of home builders and related companies broke out last week to fresh all-time highs. ITB is now up 13.8% year-to-date and outpacing the S&P 500 (SPY) once again. The seasonal outperformance for the stocks of home builders is back in effect!
")
Seeing the persistent strength in the stocks of home builders, I made the case for a “late season” buy in Century Communities (CCS) in “Investing In Century Communities After It Hit An All-Time High: Why It’s Time To Buy“. CCS joined its contemporaries in making fresh all-time highs last week.
")
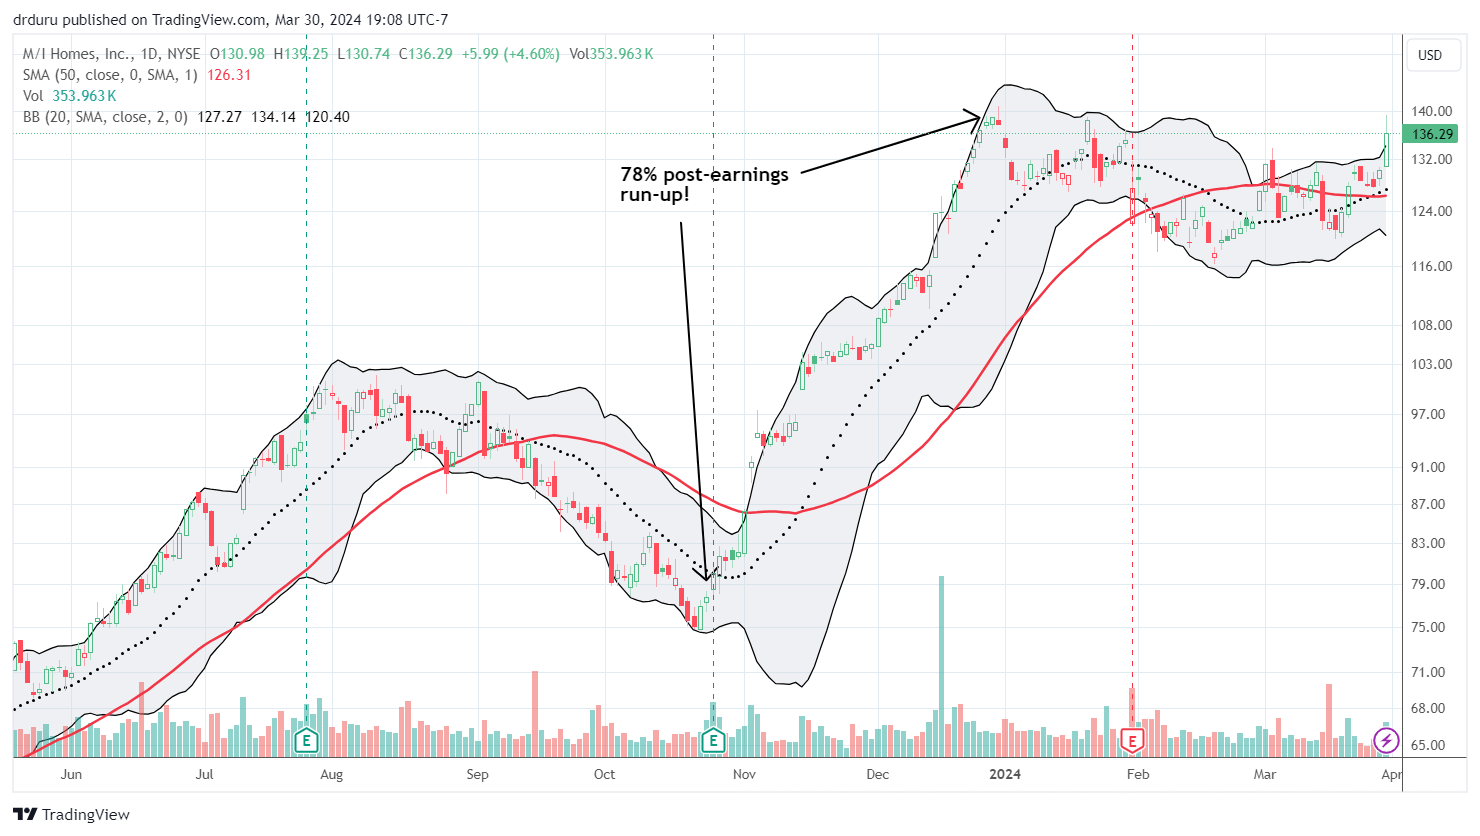
The strength in the stocks of home builders also motivated me to return to my analysis of M/I Homes in “Strong Demand Helps M/I Homes Q3 Outperform With Record Revenue And Net Income“. At the time, I was quite surprised by MHO’s results and the subsequent run-up: 78% from earnings to the last price peak! I used the recent softness in the stock to accumulate fresh shares. MHO broke out along with ITB but did not quite set an all-time high.
Housing Data
Home Builder Confidence: The Housing Market Index – March, 2024
The rebound in builder sentiment continued for a fourth straight month. March’s 3 point jump to 51 (from a downwardly revised 48 in February) for the National Association of Home Builders (NAHB)/Wells Fargo Housing Market Index (HMI) pushed sentiment over the hump and into positive territory (above 50) for the first time since last July. The HMI component Single-Family: Present gained the most points with a 4 point jump to its highest point since August. The HMI component Single-Family: Next Six Months (Seasonally Adjusted) increased to the highest relative point of the components with a gain to its highest point since June.
With confidence continuing higher, the NAHB reported further reduction in pressure to incentivize sales. The 24% share of builders cutting prices is down from 25% in February and significantly down from January’s 31% and December’s 36%. This is the lowest share since July. The average price discount stayed flat at 6% for the ninth straight month. The share of builders providing incentives actually increased from 58% in February to 60% in March but has remained in a tight range for several months.
/Wells Fargo Housing Market Index (HMI) and the University of Michigan Index of Consumer Sentiment")
Source for data: NAHB and the University of Michigan
Builder sentiment continued to rise with consumer sentiment, but it still lags the breakout for consumer sentiment.
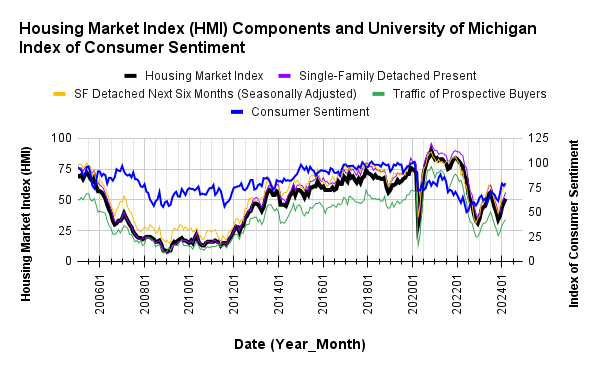
Despite the notable gain for HMI, the regional changes were very mixed. While confidence surged in the Northeast and West in February, HMI cooled a bit in those regions by 1 and 2 points respectively. The Midwest surged an amazing 11 points to its highest point since June and is no longer a laggard. The South increased 2 points.
Back in 2022, there was a lot of angst about builder confidence, particularly the HMI component Traffic of Prospective Buyers. There were predictions of crashes and calamities for the housing market that never came. The prediction below about a “struggle” in prices came true for new home prices but of course affordability-minded builders returned to building smaller homes and shifted mix toward lower price tiers. The earnings reports and related stocks tell the story of how home builders have thrived in this new environment. The median price of existing homes remained and remains resilient given the scarcer inventory. The average or median price trends do not tell enough of the housing story.
New Residential Construction (Single-Family Housing Starts) – February, 2024
The recent brief divergence between builder sentiment and housing starts ended with February’s surge in housing starts. My earlier assumption of a “natural pullback” looks correct. Single-family housing starts jumped 11.6% month-over-month to 1,129,000, up from 1,012,000 (revised upward). Starts continued year-over-year strength with a 35.2% gain in February. Recall that the favorable comparables will continue until May. In a previous Housing Market Review I claimed that year-over-year strength would begin to moderate but February’s gain far exceeded January’s 22.0% year-over-year change.
![US. Bureau of the Census, Privately Owned Housing Starts: 1-Unit Structures [HOUST1F], first retrieved from FRED, Federal Reserve Bank of St. Louis, March 30, 2024](https://drduru.com/onetwentytwo/wp-content/uploads/2024/03/20240330_Housing-Starts-February-2024.png "Housing starts")
Poor builder sentiment never hindered intentions to build in 2023 and positive sentiment continues to support permit growth. Building permits in February continued the uptrend. The thirteenth consecutive monthly increase was a 1.1% gain. The year-over-year gain dropped for the first time during this streak going from 36.5% in January to 29.6% in February.
Every region achieved large year-over-year jumps in housing starts. This month was the Midwest’s turn to surge significantly (aligned with the surge in builder sentiment in the region). The Northeast, Midwest, South, and West each changed +23.2%, +80.5%, +32.9%, and +23.6% respectively year-over-year.
New Residential Sales (Single-Family) – February, 2024
It was a “boring” month for new home sales. February new home sales of 662,000 decreased ever so slightly from January by 0.3%. January sales were revised upward from 661,000 to 664,000. Sales increased 5.9% year-over-year. Given the pace of housing starts (and the new all-time highs in the stocks of builders!), I expect sales to jump as the spring selling season unfolds.
![US. Bureau of the Census, New One Family Houses Sold: United States [HSN1F], first retrieved from FRED, Federal Reserve Bank of St. Louis, March 30, 2024.](https://drduru.com/onetwentytwo/wp-content/uploads/2024/03/20240330_New-Home-Sales-2024.png "new home sales")
The median price decreased 3.5% from January to $485,000, also a decline of 7.6% year-over-year. While the year-over-year changes have likely bottomed, a downtrend from early 2022 remains in place.
The sequential transition in price mix toward lower price tiers took a big detour in November but mostly resumed in December. In January the change in price mix did not exhibit a particular pattern. February’s price mix returned the shift sharply toward the lower tiers on both a year-over-year and sequential basis. (Again, understanding the dynamics of mix is critical to interpreting the decline in average and median prices correctly).
February’s inventory was 8.4 months of sales, little changed from the 8.3 and 8.2 of previous months. Absolute inventory increased 456,00 to 463,000 or up 1.5%. On a month of sales basis, the new home market remains well supplied given 6 months of sales is considered a balanced market.
In November, the South stuck out as the one region with a year-over-year decline in sales. The same surprise occurred for February. New home sales in the South are now scraping at the lows seen during the 2022 interest rate driven trough which in turn almost hit the lows from the depths of the pandemic. As the nation’s largest region of housing, I will closely monitor the South’s drag on the national numbers. Potentially, the outsized boom and dramatic demographic shifts to the South are finally taking a natural “rest.” The Northeast, Midwest, South, and the West changed +60.9%, +15.3%, -10.0%, and +43.4% respectively.
Some housing pundits overly focused on price trends, see a housing downturn and use dramatic terms like collapse. Yet, as I have demonstrated here and in previous housing market reviews, the price action does not tell the whole story. After enjoying an unnatural and parabolic price run-up, builders have been forced to build for lower price tiers as mortgage rates have reduced the buying power of home buyers. There is no real collapse until sales actually turn down sharply and/or the fortunes of builders erode. Neither have happened…with the South waving a potential yellow flag.
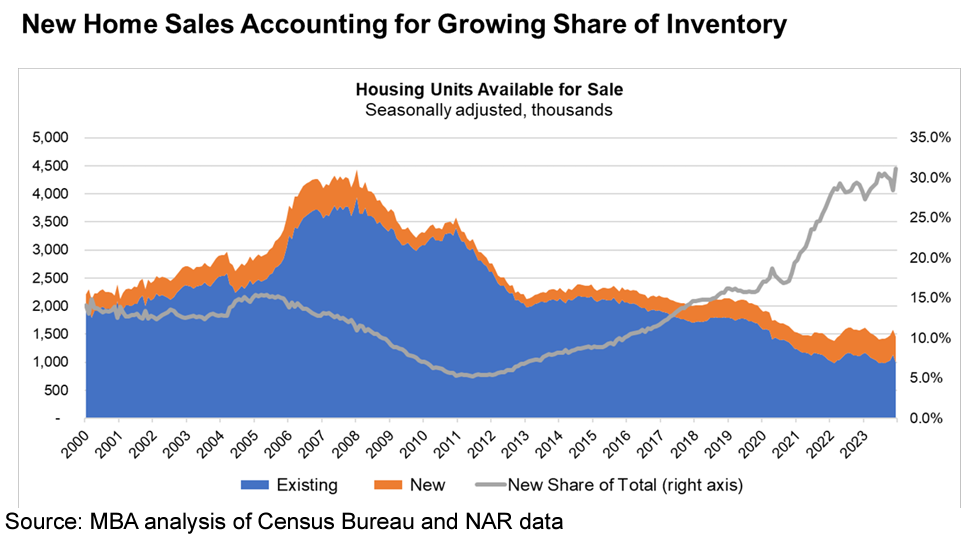
The real “downturn” is in housing inventory. The chart below comes from testimony at a Congressional hearing (see section toward the end of this post). Housing inventory is well off levels that were considered normal before the housing bubble of the financial crisis. At the same time, housing starts have recovered more quickly than inventory in the existing home sales market. The result is a skyrocketing share of inventory going to new homes. The share gains for new homes stalled over the past two years or so but now looks ready to resume higher (I previously thought the share was finally ready to normalize lower).
Existing Home Sales – February, 2024
Existing home sales finally experienced a dramatic change in fortunes. As I mentioned in the last Housing Market Review, existing home sales looked like they were bottoming and February’s surge all but confirms a bottom for the cycle has finally arrived. The seasonally adjusted annualized sales in February of 4.38M jumped 9.5% from January’s 4.0M (unrevised) while still decreasing 3.3% year-over-year. Given the current momentum, I expect the spring selling season to deliver year-over-year gains in sales. The chart below shows a clear bottom for sales. The leap over last March’s sales level all but assures a year-over-year gain for this March’s data.

(For historical data from 1999 to 2014, click here. For historical data from 2014 to 2018, click here) Source for chart: National Association of Realtors, Existing Home Sales© [EXHOSLUSM495S], retrieved from FRED, Federal Reserve Bank of St. Louis, March 30, 2024

Interestingly, sales of condos and coops continue to languish near pandemic era lows. Thus, the turn-around is not quite complete. Perhaps a rebound for these sales requires a rebound in the share of first-time home buyers.
For the January report, the NAR heralded a change in market dynamics: “While home sales remain sizably lower than a couple of years ago, January’s monthly gain is the start of more supply and demand…” A parallel increase in inventory and sales in February validate those early observations. February’s absolute inventory of 1.07M homes was up 5.9% month-over-month and up 3.1% year-over-year. According to the NAR, “unsold inventory sits at a 3.0-month supply at the current sales pace, down from 3.1 months in December but up from 2.9 months in January 2023.”
The median sales price of an existing home may be ending a downtrend along with the bottom in sales. The median price increased 1.6% month-over-month, the first such gain since June, 2023. The median price increased 5.7% year-over-year for the 8th straight year-over year gain.
The average time on market for an existing home leapt higher by 7 days to 36 days in January and increased another 2 days for February to 38 days. Buyers must be enjoying the ability to take a little more time with more available inventory.
The share of sales to first-time home buyers decreased to 26% from 28% in January and 29% in December. The share was 27% a year ago and 31% in January, 2023. While there could be a seasonal effect, I took interest this time around in the jump in purchases from individual investors or second-home buyers: “21% of homes in February, up from 17% in January and 18% in February 2023.” For a healthy spring selling season, I do not want to see any further crowding out of first-timers. Overall, their share continues to drift up and down. The NAR’s 2017 Profile of Home Buyers and Sellers reported an average of 34% for 2017, 33% for 2018, 33% for 2019, 31% for 2020, 34% for 2021, 26% for 2022, and 32% for 2023.
In January, the West was a surprising exception to the regional year-over-year declines in sales. All regions declined in February, but the West outperformed again. The regional year-over-year changes were: Northeast -7.7%, Midwest -3.7%, South -2.9%, West -1.2%.
As usual, every region experienced a year-over-year price increase. The regional year-over-year price changes were substantial for three of four regions: Northeast +11.5%, Midwest +6.8%, South +4.1%, West +9.1%.
Single-family existing home sales increased 10.3% from January and declined on a yearly basis by 2.7%. The median price of $388,700 was up 5.6% year-over-year and up 1.5% month-over-month, the first sequential increase since June, 2023.
California Existing Home Sales – February, 2024
California’s existing home sales market helped the West out-perform other regions. After surging off a 16-year low ending a 30-month streak of year-over-year declines, California’s sales increased again sequentially and year-over-year. Sales surged 12.8% from January to 290,020 and increased 1.3% year-over-year to a level last seen in September, 2022. As the California Association of Realtors (C.A.R.) noted in the January report, it expects to “see more pent-up demand translate into sales.” However, in this latest report the C.A.R. cautioned “with mortgage rates on the uptick since the start of the year and concerns about rates staying elevated for at least the first half of 2024, the housing market could struggle to build on the momentum exhibited in the first two months of this year.”
The median home price in February increased to $806,490, representing a 2.2% increase from January, yet showing a 9.7% increase from $735,300 in February 2023. The median price has increased year-over-year for eight straight months. Unlike new homes nationally, California’s mix of sales has skewed toward the higher end: “The high-end market segment continued to grow year-over-year in February by double digits, while the more affordable segment declined again modestly.” The mix of sales toward higher priced homes continued to provide support to the statewide median price and was partly responsible for the strong showing in year-over-year price growth rate in February. I am guessing a strong stock market is helping boost California’s higher end of the market.
The jump in demand helped drive the Unsold Inventory Index (UII) lower despite an increase in active listings. UII dropped from 3.2 months in January to 3.0 months in February, also a slight decrease from 3.1 months a year ago. The median time to sell a home plunged from 32.0 in January to 22.0 in February. This measure was 35.0 a year ago. I had to do a double-take on those numbers! This rush to buy homes in February augurs well for a strong spring selling season in California. Consistent with the buying rush, the sales-price-to-list-price ratio increased back to 100.0% from 98.9% in January.
In January, the C.A.R. reported that active listings increased for the first time in 19 months with a year-over-year increase that was last exceeded almost 2 years ago in May, 2022. There may have been some revisions as the C.A.R. reported in February that “active listings at the state level increased on a year-over year basis for the first time in 11 months.” In January, new active listings at the state level increased from the previous year for the first time in 19 months, and the annual increase was the largest since May 2022. In February, the C.A.R. reported “new active listings at the state level increased from a year ago for the second consecutive month by double digits.” (I have decided to stop reporting the California active listings from FRED through realtor.com as they consistently contradict the numbers from C.A.R.).
Home closing thoughts
Spotlight on Mortgage Rates
The Mortgage Bankers Association (MBA) reported weekly increases in mortgage applications the first two weeks of March and decreases the last two weeks. The interest rate on the 30-year fixed mortgage stayed within a tight range all month (see the chart below).
New home mortgage purchase applications surged 15.7% year-over-year in February and 1% month-over-month (not seasonally adjusted). This strength follows a 19.1% year-over-year surge in January. The year-over-year increase was the 13th consecutive month of gains. Average loan size grew to its highest level since March, 2023.
![Freddie Mac, 30-Year Fixed Rate Mortgage Average in the United States [MORTGAGE30US], retrieved from FRED, Federal Reserve Bank of St. Louis; March 30, 2024.](https://drduru.com/onetwentytwo/wp-content/uploads/2024/03/20240330_30-Year-Fixed-Rate-Mortgage-Average-in-the-United-States.png)
The Characteristics and Challenges of Today’s Homebuyers
On March 20, Mike Fratantoni, the MBA’s Chief Economist and SVP of Research and Industry Technology, testified at a Congressional hearing titled, “The Characteristics and Challenges of Today’s Homebuyers” held before the House Committee on Financial Services Subcommittee on Housing and Insurance. The associated presentation was rich in data on the housing market and how it is financed. The complete hearing featured valuable insights and observations from experts across the housing industry.
Fratantoni spoke to the supply deficit in the housing industry writing:
“While this country built 16-18 million housing units of all types per decade from 1970-2009, following the GFC, in the next decade, only 11 million units were built. With the interruption from the pandemic, we are also running short of the needed supply thus far this decade. While estimates of the needed supply vary widely, it is clear that we are millions of units behind at this point. And even though we expect to see a large delivery of multifamily units over the next few years, this will not resolve the broader lack of inventory that we see across the country.”
Home builders have spoken about this persistent under-supply for years. It is clear this deficit will supply a tailwind to the industry for years to come and means the typical seasonal trading pattern for home builders may become less relevant or at least less compelling over time as a stock market timing technique. This year may be the last time I ask the question “Has the Builder Seasonal Trade Topped Out?“
With inventory tight and mortgage rates higher, affordability has dropped notably. Never mind the drop from the parabolic run-up in the price of new homes. The average home buyer is struggling to catch-up. The squeeze is starting to hurt. Fratantoni noted an important rise in loan delinquencies (emphasis mine):
“One manifestation of this declining affordability has been increasing debt to income (DTI) ratios on new originations. Homebuyers, particularly first-time buyers who do not have the ability to make larger downpayments, have been more willing to accept a higher payment burden. For FHA borrowers in particular, this is posing a noticeable increase in risk, and we are seeing FHA delinquencies increase in recent quarters. In Q4 2023, the delinquency rate on FHA mortgages increased to 10.8%, the highest rate since 2021 (when borrowers were recovering from the pandemic driven spike in delinquencies).”
Given 2021 was the peak in the last housing run-up, this rise in delinquencies has me on alert!
Be careful out there!
Full disclosure: long ITB, long CCS, long MHO